Documentation Revision Date: 2024-04-24
Dataset Version: 1
Summary
There are two data files in comma-separated values (.csv) format with this dataset.
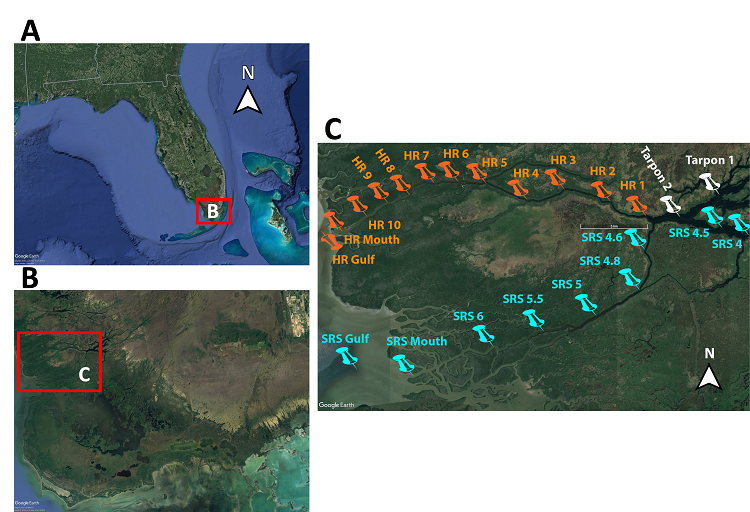
Figure 1. Study site sampling locations. (A) General location in south Florida. (B) Study area within Florida Everglades. (C) Distribution of sampling locations along the Harney (HR*) and Shark (SR*) tidal rivers.
Citation
Vaughn, D., and P. Raymond. 2024. BlueFlux: Dissolved Carbon and Greenhouse Gases. ORNL DAAC, Oak Ridge, Tennessee, USA. https://doi.org/10.3334/ORNLDAAC/2333
Table of Contents
- Dataset Overview
- Data Characteristics
- Application and Derivation
- Quality Assessment
- Data Acquisition, Materials, and Methods
- Data Access
- References
Dataset Overview
This dataset provides dissolved carbon (dissolved inorganic carbon and dissolved organic carbon), greenhouse gas, dissolved organic matter optical, and hydrological (water temperature, pH, alkalinity, dissolved oxygen) data collected from the Shark and Harney tidal rivers in the Everglades. The data were collected as part of the BlueFlux field campaigns over the 2022 wet season (October 2022) and 2023 dry season (March 2023). Data includes single-collection samples collected from sites along both rivers and samples collected by an autosampler at one site over multiple tidal cycles.
Project: Carbon Monitoring System
The NASA Carbon Monitoring System (CMS) program is designed to make significant contributions in characterizing, quantifying, understanding, and predicting the evolution of global carbon sources and sinks through improved monitoring of carbon stocks and fluxes. The System uses NASA satellite observations and modeling/analysis capabilities to establish the accuracy, quantitative uncertainties, and utility of products for supporting national and international policy, regulatory, and management activities. CMS data products are designed to inform near-term policy development and planning.
The BlueFlux project was funded by the NASA CMS program. The project brings together scientists from NASA Goddard Space Flight Center, Yale University, and Eastern Carolina University to study blue carbon ecosystems and climate mitigation in Southern Florida by measuring carbon stocks and carbon dioxide and methane fluxes.
Related Publication
Vaughn, D., J. Rosentreter, B. Poulter, D. Lagomasino, S.P. Charles, and P.R. Raymond. Seasonal Dissolved Carbon and Greenhouse Gas Fluxes from Tidal Rivers Draining Mangroves in the Florida Everglades. In process, 2024.
Acknowledgement
This study was supported by the NASA Carbon Monitoring System program (grant 80NSSC21K1509).
Data Characteristics
Spatial Coverage: Florida Everglades - Shark and Harney Rivers
Spatial Resolution: Point
Temporal Coverage: 2022 wet season (October 15-17 2022) and 2023 dry season (March 10-13 2023)
Temporal Resolution: Multiple one-time samples were collected during wet and dry seasons
Study Area: Latitude and longitude are given in decimal degrees
| Site | Westernmost Longitude | Easternmost Longitude | Northernmost Latitude | Southernmost Latitude |
|---|---|---|---|---|
| Florida Everglades | -81.9146 | -80.9302 | 25.4316 | 25.2085 |
Data File Information
There are two files in comma-separated values (.csv) format with this dataset:
BLUEFLUX_Transect_Shark_Haney_Rivers_TarponBay.csv: Contains data collected from samples along the Shark and Harney rivers during the 2022 wet season (October 2022) and the 2023 dry season (March 2023).
BLUEFLUX_ISCO_FCEC_LTER_SRS6.csv: Contains data from continuous water samples collected from the mouth of a tidal creek at one FCE-LTER site (SRS 6) using portable autosamplers.
Table 1. Variables in the file BLUEFLUX_Transect_Shark_Haney_Rivers_TarponBay.csv
| Variable | Units | Description |
|---|---|---|
| site | - | Site name |
| season | - | Wet or Dry season |
| date | YYYY-MM-DD | Date of sample collection |
| time | HH:MM:SS | Time sample was collected |
| latitude | decimal degrees | Latitude of sample location |
| longitude | decimal degrees | Longitude of sample location |
| temp | degrees C | Water temperature in degrees C |
| pH | 1 | pH |
| specific_conductance | μs cm-1 | Specific conductance in microsiemens per cm |
| turbidity | NTU | Turbidity in Nephelometric Turbidity Units (NTU) |
| HDO_con_mg_L | mg L-1 | Dissolved oxygen concentration (mg/L) |
| HDO_sat_percent | percent | Dissolved oxygen saturation (percent) |
| cdom_probe_value | 1 | Chromophoric (or colored) Dissolved Organic Materials (CDOM) value |
| alternate_cdom_probe_value | 1 | Alternate CDOM value |
| Chl | µg L-1 | Chlorophyll a concentrations (µg/L) |
| salinity | psu | Salinity sensor (psu) |
| DIC | µmol kg-1 | Dissolved Inorganic Carbon (µmol/kg) |
| alkalinity | µmol kg-1 | Alkalinity (µmol/kg) |
| DOC | mg L-1 | Dissolved Organic Carbon (mg/L) |
| fluorescence_index | 1 | Fluorescence index |
| humification_index | 1 | Humification index |
| fluorescence_index_new | 1 | New fluorescence index |
| manta_probe1 | 1 | CDOM fluorescence (fDOM) value |
| manta_probe2 | 1 | Alternate fDOM value |
| freshness | 1 | Freshness index |
| coble_peak_b | 1 | Coble peak b |
| coble_peak_t | 1 | Coble peak t |
| coble_peak_a | 1 | Coble peak a |
| coble_peak_m | 1 | Coble peak m |
| coble_peak_c | 1 | Coble peak c |
| uva_254 | 1 | Absorbance at 254 Naperian |
| specific_uva_254 | 1 | Specific ultraviolet absorbance at 254 nm |
| uva_412 | 1 | Absorbance at 412 Naperian |
| spectral_slope_275_295 | 1 | Spectral slope 275-295 nm |
| spectral_slope_350_400 | 1 | Spectral slope 350-400 nm |
| spectral_slope_ratio | 1 | Spectral slope ratio |
| spectral_slope_280_450 | 1 | Spectral slope 280-450 |
| spectral_slope_588_598 | 1 | Spectral slope 588-598 |
| total_absorb_250_450 | 1 | Total absorbance from 250 to 450 nm |
| total_absorb_300_340 | 1 | Total absorbance from 300 to 340 nm |
| model_comp_1 | 1 | Parafac model component #1 |
| model_comp_2 | 1 | Parafac model component #2 |
| model_comp_3 | 1 | Parafac model component #3 |
| model_comp_4 | 1 | Parafac model component #4 |
| pCO2 | µatm | Partial pressure of dissolved CO2 in µatm |
| pCH4 | µatm | Partial pressure of dissolved CH4 in µatm |
| pN2O | µatm | Partial pressure of dissolved N2O in µatm |
Table 2. Variables in the file BLUEFLUX_ISCO_FCEC_LTER_SRS6.csv
| Variable | Units | Description |
|---|---|---|
| sample | - | Sample name |
| date | YYYY-MM-DD | Date of sample collection |
| time | HH:MM:SS | Time sample was collected |
| DOC | mg L-1 | Dissolved Organic Carbon (mg/L) |
| alkalinity | µmol kg-1 | Alkalinity (µmol/kg) |
| temp | degrees C | Water temperature |
| pH | 1 | pH |
| specific_conductance | μs cm-1 | Specific conductance in microsiemens per cm |
| HDO_con_mg_liter | mg L-1 | Dissolved oxygen concentration (mg/L) |
| HDO_sat_percent | percent | Dissolved oxygen saturation (percent) |
| turbidity | NTU | Turbidity in NTU |
| Chl | µg L-1 | Chlorophyll a concentrations (µg/L) |
| cdom_probe_value | 1 | Chromophoric (or colored) Dissolved Organic Materials (CDOM) value |
| alternate_cdom_probe_value | 1 | Alternate CDOM value |
| salinity | psu | Salinity sensor (practical salinity unit) |
| fluorescence_index | 1 | Fluorescence index |
| humification_index | 1 | Humification index |
| fluorescence_index_new | 1 | New fluorescence index |
| manta_probe1 | 1 | CDOM fluorescence (fDOM) value |
| manta_probe2 | 1 | Alternate fDOM value |
| freshness | 1 | Freshness index |
| coble_peak_b | 1 | Coble peak b |
| coble_peak_t | 1 | Coble peak t |
| coble_peak_a | 1 | Coble peak a |
| coble_peak_m | 1 | Coble peak m |
| coble_peak_c | 1 | Coble peak c |
| uva_254 | 1 | Absorbance at 254 Naperian |
| specific_uva_254 | 1 | Specific ultraviolet absorbance at 254 nm |
| uva_412 | 1 | Absorbance at 412 Naperian |
| spectral_slope_275_295 | 1 | Spectral slope 275-295 nm |
| spectral_slope_350_400 | 1 | Spectral slope 350-400 nm |
| spectral_slope_ratio | 1 | Spectral slope ratio |
| spectral_slope_280_450 | 1 | Spectral slope 280-450 nm |
| spectral_slope_588_598 | 1 | Spectral slope 588-598 nm |
| total_absorb_250_450 | 1 | Total absorbance from 250 to 450 nm |
| total_absorb_300_340 | 1 | Total absorbance from 300 to 340 nm |
| model_comp_1 | 1 | Parafac model component #1 |
| model_comp_2 | 1 | Parafac model component #2 |
| model_comp_3 | 1 | Parafac model component #3 |
| model_comp_4 | 1 | Parafac model component #4 |
Application and Derivation
These data are useful to study blue carbon ecosystems and carbon dynamics and inform mangrove restoration and conservation.
Quality Assessment
Uncertainty from laboratory analyses was analyzed according to standard operating procedures. Replicate samples were collected in the field to evaluate precision of sample collection. Equipment used for measuring parameters was calibrated and maintained as recommended by the manufacturer.
Data Acquisition, Materials, and Methods
Study sites
Two field studies were conducted along the Shark and Harney rivers during the 2022 wet season (October 2022) and the 2023 dry season (March 2023). Along both rivers, several sites were chosen for discrete water collection along a salinity gradient based on the on-going, long-term ecological research program in the Florida Everglades (FCE-LTER). Additional sites not used by the FCE-LTER were also added along both rivers for water collection. Included in these sites for both rivers are a marine end-member from the Gulf of Mexico and a fresher up-stream end-member within Tarpon Bay. During the collection of discrete water samples for each season, one multi-parameter sonde (Eureka Manta 2) was used to record additional environmental data at each site, including temperature, pH, specific conductivity, salinity, and dissolved oxygen (concentration and percentage).
Surface water was collected ~0.25 m below the surface using a peristaltic pump and was filtered in the field through Sterivex 0.22 µm polyethersulfone membrane filters to remove bacteria and minimize microbial activity. Samples for dissolved organic carbon (DOC) and dissolved organic matter (DOM) analyses were collected in acid-cleaned polycarbonate or high-density polyethylene (HDPE) sample bottles. Dissolved inorganic carbon (DIC) samples were collected in screw-capped small borosilicate glass vials (100 mL) because polycarbonate and HDPE bottles are CO2 permeable. Alkalinity samples were collected in a mix of glass and polycarbonate bottle. All samples were stored on ice immediately after collection and stored under refrigeration prior to analyses.
In addition to the discrete samples collected along each river, water samples were collected from the mouth of a tidal creek at one FCE-LTER site (SRS 6) using portable autosamplers (Teledyne ISCO) during both field campaigns. During the 2022 wet season, water was collected hourly over a 14-hour period in a refrigerated autosampler. During the 2023 dry season, water was collected hourly over a 24-hour period in an unrefrigerated autosampler filled with ice. Acid-cleaned polypropylene bottles were used to collect the water during each cycle. After each sampling cycle, water samples were immediately filtered through 0.22 µm filters (Durapore, Millipore) and into HDPE sample bottles for DOC, total akalinity (TA), and DOM composition. One multi-parameter sonde (Eureka Manta 2) was used to record additional environmental data at 15-minute intervals, including temperature, pH, specific conductivity, salinity, and dissolved oxygen (concentration and percentage). Greenhouse gas samples were also collected from the tidal creek at FCE-LTER site SRS 6 in both seasons and from porewater within the mangroves (~100 m away from the Shark River edge) at sites SRS 6 and SRS 5 during the dry season.
Dissolved Carbon Concentrations
Samples were analyzed for total DOC using high temperature catalytic combustion on a Shimadzu TOC-L CPH using the non-purgeable organic carbon (NPOC) method, with sample sparging at 75 ml min-1 for 8 min and the addition of 12 N analytical-grade HCl to remove dissolved inorganic carbon. DOC concentrations are calculated as the mean of at least three injections with a coefficient of variance of <2 %.
On the day of measurement, DIC samples were warmed at room temperature. DIC was measured using a DIC analyzer (AS-C2, Apollo Scitech), consisting of a KloehnTM syringe pump (module #50300) with a 2.5 mL syringe. Seawater samples (0.5 mL) were acidified by adding 0.5 mL HCl, and the released CO2 was subsequently quantified by a nondispersive infrared CO2 detector (LI-COR®, LI-6262). This method has a precision of 0.1 %. All DIC values were directly measured with reference to certified reference material (CRM; Dickson, 2010).
Total alkalinity (TA) was measured by the Gran titration using the open cell method with a semi-automatic titration system (AS-ALK3, Apollo Scientific), consisting of two KloehnTM syringe pumps of 1 mL and 25 mL respectively, a high precision pH meter, and a ROSS combination pH glass electrode (Orion 8102BN, Thermo Scientific). Throughout the measurements, the TA samples, the HCl solution and the syringes of the KhloehnTM pumps were all water-jacketed at 25 +/- 0.1°C maintained by a thermal bath (VWR®, Scientific Product). Tygon® tubing (R-3603) was used to transfer solutions between these containers. For each measurement, 25 mL TA sample was titrated with an HCl solution (0.1M HCl and 0.5M NaCl). This TA titration system has a precision of better than 0.1 % (Cai et al., 2010). All TA values were directly measured with reference to CRM. Opened CRM bottles were stored in the refrigerator.
Dissolved Organic Matter (DOM) Composition
UV-Vis absorption spectra and fluorescence excitation-emission matrices (EEMs) were analyzed using a Horiba Aqualog spectroflurometer and protocols followed standard practice including blank subtraction (Hosen et al., 2020). Spectra were measured in a quartz cuvette with a 1-cm pathlength. UV-absorbance from 200-800 nm was collected at 1-nm increments with an integration time of 1 s. Excitation-emission matrices were collected at excitation wavelengths of 240-800 nm at 3-nm increments and fluorescence emission from 247.808 to 828.528 nm at 2.06-nm increments using 4 CCD pixel integration (Hosen et al., 2020). Fluorescence data were corrected for inner-filter effects and Raman-normalized (Cory et al., 2010). Raman scattering area was determined using Type I (18.2 MW-cm) water from a Milli-Q Advantage A-10 water purification system.
Specific ultraviolet absorbance at 254 nm (SUVA254), the decadant absorption coefficient at 254 nm divided by DOC concentration (Weishaar et al., 2003), and spectral slope ratio (SR), the ratio of log-transformed absorbance slopes between 275-295 nm and 350-400 nm (Helms et al., 2008), were calculated for each sample. The spectral slope ratio has previously been used as an indicator of DOM molecular weight (MW) and photochemically induced shifts in MW across water types (Helms et al., 2008). Freshness index is the ratio of fluorescence emission at 380 nm divided by the maximum emission intensity from 420-435 nm at excitation wavelength of 310 nm (Parlanti et al., 2000; Wilson and Xenopoulos, 2009). The fluorescence index (FI) is the ratio of fluorescence emission at 470 and 520 nm at excitation 370 nm (Cory et al., 2010; McKnight et al., 2001). The humification index (HIX) is the summation of fluorescence emissions at 435-480 nm divided by the sum of fluorescence emission at 300-345 nm at excitation 254 nm (Ohno, 2002).
Parallel factor (PARAFAC) analysis (Stedmon and Bro, 2008) was used on fluorescence EEM data using R staRdom v. 1.1.21 (Pucher et al., 2019). The input data (n = 108) included samples collected during both field campaigns from both the ISCO and the single sample collections along both tidal rivers.
Greenhouse Gas Collection
Greenhouse gas samples were collected in triplicate using the headspace equilibration technique (Raymond et al., 1997; Aho et al., 2019) where 120 ml of water was equilibrated with a 20-mL atmospheric headspace in a 160 mL syringe, and 20 mL of the equilibrated headspace was transferred to pre-evacuated 12-mL exetainers (Labco vials) and analyzed at the Yale Analytical and Stable Isotope Center on a Shimadzu GC2014 with an FID for CO2 and CH4 measurements and ECD calibrated for N2O measurements. Standard gas concentrations for CO2 were 0, 152, 1007, 2013, 4967 and 10090 ppm; for CH4 were 0, 0.98, 10.3, 20.6, 201, and 5030 ppm; for N2O were 0, 0.23, 0.25, 0.50, 2.49, and 5 ppm. Equilibration was achieved by shaking the syringe for 3 minutes at ambient conditions. Samples for atmospheric gas concentrations were also taken to correct for the atmospheric headspace.
Data Access
These data are available through the Oak Ridge National Laboratory (ORNL) Distributed Active Archive Center (DAAC).
BlueFlux: Dissolved Carbon and Greenhouse Gases
Contact for Data Center Access Information:
- E-mail: uso@daac.ornl.gov
- Telephone: +1 (865) 241-3952
References
Aho, K.S., and P.A. Raymond. 2019. Differential Response of Greenhouse Gas Evasion to Storms in Forested and Wetland Streams. Journal of Geophysical Research: Biogeosciences 124:649–662. https://doi.org/10.1029/2018JG004750
Cai, W., X. Hu, W. Huang, L. Jiang, Y. Wang, T. Peng, and X. Zhang. 2010. Alkalinity distribution in the western North Atlantic Ocean margins. Journal of Geophysical Research: Oceans 115:C08014. https://doi.org/10.1029/2009JC005482
Cory, R.M., M.P. Miller, D.M. McKnight, J.J. Guerard, and P.L. Miller. 2010. Effect of instrument-specific response on the analysis of fulvic acid fluorescence spectra. Limnology and Oceanography: Methods 8:67–78. https://doi.org/10.4319/lom.2010.8.67
Dickson, A. 2010. Standards for Ocean Measurements. Oceanography 23:34–47. https://doi.org/10.5670/oceanog.2010.22
Helms, J.R., A. Stubbins, J.D. Ritchie, E.C. Minor, D.J. Kieber, and K. Mopper. 2008. Absorption spectral slopes and slope ratios as indicators of molecular weight, source, and photobleaching of chromophoric dissolved organic matter. Limnology and Oceanography 53:955–969. https://doi.org/10.4319/lo.2008.53.3.0955
Hosen, J.D., K.S. Aho, J.H. Fair, E.D. Kyzivat, S. Matt, J. Morrison, A. Stubbins, L.C. Weber, B. Yoon, and P.A. Raymond. 2020. Source switching Maintains dissolved organic matter chemostasis across discharge levels in a large temperate river network. Ecosystems 24:227–247. https://doi.org/10.1007/s10021-020-00514-7
McKnight, D.M., E.W. Boyer, P.K. Westerhoff, P.T. Doran, T. Kulbe, and D.T. Andersen. 2001. Spectrofluorometric characterization of dissolved organic matter for indication of precursor organic material and aromaticity. Limnology and Oceanography 46:38–48. https://doi.org/10.4319/lo.2001.46.1.0038.
Ohno, T. 2002. Fluorescence inner-filtering correction for determining the Humification Index of Dissolved Organic Matter. Environmental Science and Technology 36:742–746. https://doi.org/10.1021/es0155276.
Parlanti, E., K. Wörz, L. Geoffroy, and M. Lamotte. 2000. Dissolved organic matter fluorescence spectroscopy as a tool to estimate biological activity in a coastal zone submitted to anthropogenic inputs. Organic Geochemistry 31:1765–1781. https://doi.org/10.1016/S0146-6380(00)00124-8
Pucher, M., U. Wünsch, G. Weigelhofer, K. Murphy, T. Hein, and D. Graeber. 2019. staRdom: Versatile software for analyzing spectroscopic data of dissolved organic matter in R. Water 11:2366. https://doi.org/10.3390/w11112366.
Raymond, P.A., N.F. Caraco, and J.J. Cole. 1997. Carbon dioxide concentration and atmospheric flux in the Hudson River. Estuaries 20:381-390. https://doi.org/10.2307/1352351.
Stedmon, C.A., and R. Bro. 2008. Characterizing dissolved organic matter fluorescence with parallel factor analysis: a tutorial. Limnology and Oceanography: Methods 6:572–579. https://doi.org/10.4319/lom.2008.6.572.
Vaughn, D., J. Rosentreter, B. Poulter, D. Lagomasino, S.P. Charles, and P.R. Raymond. Seasonal Dissolved Carbon and Greenhouse Gas Fluxes from Tidal Rivers Draining Mangroves in the Florida Everglades. In process, 2024.
Weishaar, J.L., G.R. Aiken, B.A. Bergamaschi, M.S. Fram, R. Fujii, and K. Mopper. 2003. Evaluation oof specific ultraviolet absorbance as an indicator of the chemical composition and reactivity of dissolved organic carbon, Environmental Science and Technology 37: 4702-4708. https://doi.org/10.1021/es030360x
Wilson, H.F., and M.A. Xenopoulos. 2008. Effects of agricultural land use on the composition of fluvial dissolved organic matter. Nature Geoscience 2:37–41. https://doi.org/10.1038/ngeo391.