Documentation Revision Date: 2025-04-16
Dataset Version: 1
Summary
There are four data files in this dataset in netCDF (.nc) format.
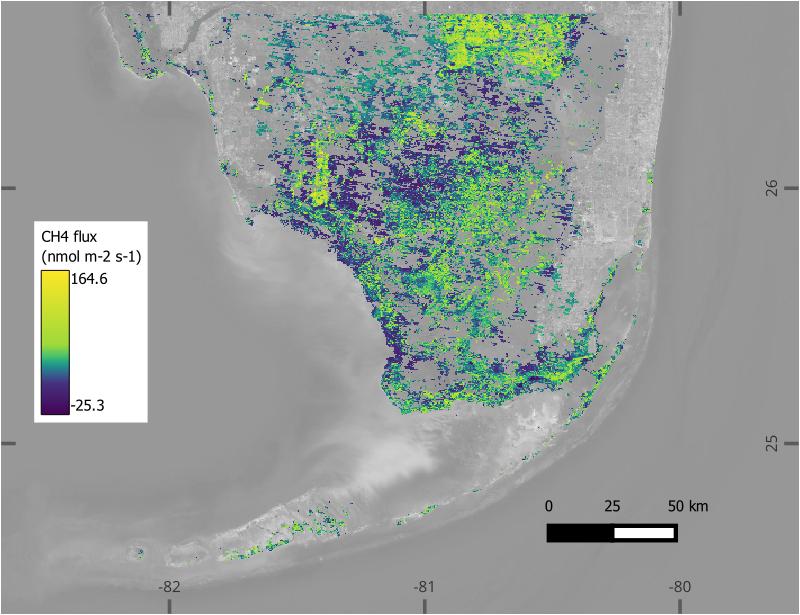
Figure 1. Estimates of methane flux (nmol m-2 s-1) from wetlands in southern Florida, U.S., on 29 June 2000. Methane flux was modeled using a machine learning model based on in-situ and airborne flux measurements paired with MODIS satellite reflectance. Source: blueflux_fch4_nmol_500m_mean_v1.nc
Citation
Doughty, C.L., Q. Ying, E.J. Ward, E.R. Delaria, G.M. Wolfe, and B. Poulter. 2025. BlueFlux: Modeled Daily CO2 and CH4 Wetland Fluxes, Southern Florida, 2000-2024. ORNL DAAC, Oak Ridge, Tennessee, USA. https://doi.org/10.3334/ORNLDAAC/2404
Table of Contents
- Dataset Overview
- Data Characteristics
- Application and Derivation
- Quality Assessment
- Data Acquisition, Materials, and Methods
- Data Access
- References
Dataset Overview
This dataset contains gridded estimates of carbon dioxide (CO2) and methane (CH4) fluxes at daily resolution covering the Southern Florida region from 2000 to 2024. Gridded CO2 and CH4 flux prototype products at 500-m spatial resolution were derived from a machine learning model based on eddy covariance (EC) measurements from 1) airborne fluxes collected seasonally with the NASA Carbon Airborne Flux Experiment (CARAFE) over the region during five flight deployments and 2) regional EC tower networks representing long term wetland ecosystem fluxes since 2004. Multiscale flux measurements were upscaled with remote sensing observations of MODIS optical reflectance using a bootstrap ensemble random forest modeling approach to predict daily mean flux intensity and uncertainty from February 2000 to August 2024. Prototypes of modeled, gridded greenhouse gas fluxes were developed as part of the NASA Carbon Monitoring System (CMS) BlueFlux Project (Poulter et al., 2023).
Project: Carbon Monitoring System
The NASA Carbon Monitoring System (CMS) program is designed to make significant contributions in characterizing, quantifying, understanding, and predicting the evolution of global carbon sources and sinks through improved monitoring of carbon stocks and fluxes. The System uses NASA satellite observations and modeling/analysis capabilities to establish the accuracy, quantitative uncertainties, and utility of products for supporting national and international policy, regulatory, and management activities. CMS data products are designed to inform near-term policy development and planning.
Related Publication:
Doughty, C., Q. Ying, E. Ward, E. Delaria, G. Wolfe, S. Malone D. Reed, T. Troxlet, J. Kominoski, E. Castaneda, B. Shoemaker, D. Yannick, G. Starr, S. Oberbauer, C. Amaral, A. Barblitt, A. Campbell, S. Charles, L. Fatoyimbo, J. Gewirtzman, T. Hanisco, R. Hannun, S. Kawa, D. Lagomasino, L. Lait, A. Lindquist, P. Newman. P. Raymond, J. Rosentreter, K. Thornhill, D. Vaughn, and B. Poulter. 2025. Compounded effects of climate change and management on blue carbon ecosystems via flux upscaling to support nature-based climate solutions. Manuscript in preparation.
Related Datasets:
Delaria, E.R., G.M. Wolfe, R.A. Hannun, K. Blanock, B. Poulter, and K.L. Thornhill. 2024. BlueFlux Airborne Trace Gases, Fluxes, and Mixing Ratios, Southern Florida, 2022-2023. ORNL DAAC, Oak Ridge, Tennessee, USA. https://doi.org/10.3334/ORNLDAAC/2327
Vaughn, D., and P. Raymond. 2024. BlueFlux: Dissolved Carbon and Greenhouse Gases. ORNL DAAC, Oak Ridge, Tennessee, USA. https://doi.org/10.3334/ORNLDAAC/2333
Xiong, L., D. Lagomasino, and B. Poulter. 2024. Blueflux: Terrestrial Lidar Scans of Mangrove Forests, Everglades, FL, USA, 2022-2023. ORNL DAAC, Oak Ridge, Tennessee, USA. https://doi.org/10.3334/ORNLDAAC/2311
- These three datasets also address carbon cycling dynamics in the BlueFlux study area.
Acknowledgement:
This research was supported by the NASA Carbon Monitoring Program (Grant Number 20-CMS20-0009).
Data Characteristics
Spatial Coverage: Everglades National Park (ENP), the Big Cypress National Preserve (BCNP), and surrounding ecosystems in southern Florida, USA
Spatial Resolution: 500 m
Temporal Coverage: 2000-01-01 to 2024-08-31
Temporal Resolution: daily
Site Boundaries: Latitude and longitude are given in decimal degrees.
| Site | Westernmost Longitude | Easternmost Longitude | Northernmost Latitude | Southernmost Latitude |
|---|---|---|---|---|
| southern Florida | -82.22 | -79.96 | 26.68 | 24.48 |
Data File Information
There are four data files in this dataset in netCDF (.nc) format (Table 1). These files hold gridded estimates of methane and carbon dioxide flux from wetlands in the southern Florida study region.
Data characteristics:
- Coordinate system: geographic coordinates, WGS 84 datum, EPSG: 4326
- Spatial resolution: 500 m
- Grid size: 528 rows x 541 columns
- Temporal resolution: Daily between 2000-01-01 to 2024-08-31; estimate begin on 2000-02-25
- No data value: -9999
Table 1. Data files and principal variables.
| File name | Main variable | Units | Description |
|---|---|---|---|
| blueflux_fch4_nmol_500m_mean_v1.nc | fch4_mean | nmol m-2 s-1 | Daily mean methane flux intensity from wetlands in nanomoles of CH4 m-2 s-1 |
| blueflux_fch4_nmol_500m_std_v1.nc | fch4_std | nmol m-2 s-1 | Standard deviation of daily mean methane flux intensity |
| blueflux_fco2_micromol_500m_mean_v1.nc | fco2_mean | µmol m-2 s-1 | Daily mean carbon dioxide flux intensity from wetlands in micromoles of CO2 m-2 s-1 |
| blueflux_fco2_micromol_500m_std_v1.nc | fco2_std | µmol m-2 s-1 | Standard deviation of daily mean carbon dioxide flux intensity |
Application and Derivation
Wetlands remain a large source of uncertainty in the global carbon budget despite growing recognition of wetland management as a nature-based solution with the ability to uptake carbon and mitigate climate change. Blue carbon, the carbon sequestered and stored in coastal ecosystems, has the potential to offset ~3% of global emissions if tidal marsh, mangrove, and seagrass ecosystems are adequately protected and managed. The large uncertainties associated with blue carbon need to be constrained with updated wetland extents and improved understanding of the effects of climate change and other human disturbances on blue carbon processes that vary across spatial and temporal scales. These estimates, derived from in-situ flux measurements and remote sensing, provide information on methane and carbon dioxide fluxes from the extensive wetland system across southern Florida, USA.
Quality Assessment
Uncertainty was estimated as the standard deviation of the upscaling predictions in CH4 and CO2 fluxes derived from 100 bootstrap ensemble random forest models. Models were evaluated based on the variance explained (R2), root mean squared error (RMSE), and mean absolute error (MAE) of predicted fluxes fit to the measured fluxes at daily, monthly, and annual time scales.
The annual estimates were compared to the EPA inventory of greenhouse gas emissions and removals for Florida for IPCC sector “Land Use Change, Land Use Change and Forestry” categories “Wetlands Remaining Wetlands (NIR Section 6.8)”, subcategory “Coastal Wetlands Remaining Coastal Wetlands”, “Peatlands Remaining Peatlands (Managed peatlands), and “Flooded Land Remaining Flooded Land” (NIR Section 6.8) (EPA, 2024).
Data Acquisition, Materials, and Methods
The study domain focused on large wetland areas within the Everglades National Park (ENP), the Big Cypress National Preserve (BCNP), and surrounding ecosystems in southern Florida, USA, where in situ and aircraft measurements were collected as part of the BlueFlux field campaign (Figure 2). To understand the spatial and temporal variability in greenhouse gas fluxes in a (sub)tropical wetland system (Ruis et al., 2021; SFWMD, 2024) with intense climatic and human pressures, an ensemble random forest machine learning approach was developed for data-driven upscaling of daily carbon dioxide (CO2) and methane (CH4) fluxes for over 20 years in the ENP and BCNP using in situ and airborne flux measurements paired with satellite reflectance.
Flux Data from Eddy Covariance and Airborne Platforms
Eddy covariance towers: Published and provisional data from eight eddy covariance (EC) towers in south Florida that represent a range of wetland vegetation types with varying hydrology and disturbance histories were compiled. Half-hourly time series of CO2 and CH4 fluxes were collected from AmeriFlux and FCE-LTER when available. Daily integrated average fluxes of CO2 and CH4 were estimated from the half-hourly data when tower measurements covered more than 80% of the 24-hour period. Midday average fluxes of CO2 and CH4 represent mean fluxes during midday to align with MODIS and CARAFE acquisition times.
Airborne flux measurements: Estimates of carbon flux were obtained from NASA's Carbon Airborne Flux Experiment (CARAFE) instrument (Wolfe et al. 2018). BlueFlux deployments of CARAFE were conducted on 19-26 April 2022, 14-20 October 2022, 06-13 February 2023, 13-19 April 2023, and 13-22 July 2024. Each deployment consisted of 6-8 flights primarily during midday hours (10:00 and 17:00 local time) taken over several days. A total of 30 flight days provided airborne CO2 and CH4 flux estimates over the ENP/BCNP study area. Instantaneous CARAFE flux measurements taken during each flight were available as georeferenced samples along preplanned flight segments. Analysis was limited to CARAFE flux measurements sampled during midday to match the acquisition times of MODIS. To match the 500-m resolution of MODIS, CARAFE samples with a given pixel were averaged to create gridded mean CO2 and CH4 fluxes at 500-m. Gridded standard error at 500-m was first estimated as the average standard error among all CARAFE samples within a MODIS pixel.
The daily integrated average CO2 flux from midday average fluxes was estimated using linear fits developed by Delaria et al (2024a) from four EC towers coincident with CARAFE flights, and adapted for all EC tower data used in this study. Midday average CO2 flux (μmol m-2 s-1) was converted to daily average CO2 flux for each flight. Daily average CH4 flux (nmol m-2 s-1) was estimated as the mean midday CH4 flux scaled by 24 hours; flux was assumed to be constant throughout the day (Delaria et al. 2024a). Gridded and tabular CARAFE flux inputs for upscaling include daily average CO2 flux ± standard error and daily average CH4 flux ± standard error linked to 500-m MODIS pixels incident with CARAFE flights.
MODIS reflectance
The MODerate-resolution Imaging Spectroradiometer (MODIS) collection 6.1 MCD43A4 Nadir Bidirectional Reflectance Distribution Function (BRDF)-Adjusted Reflectance (NBAR) product was selected for upscaling, and provides gridded, daily surface reflectance at 500-m resolution dating back to February 2000. MODIS NBAR was selected as the basis for upscaling due to its global spatial coverage and gap-filled daily temporal resolution, high quality control, BRDF corrections, and demonstrated similarity to Aqua and Terra reflectances values in flux upscaling (Joiner et al. 2018, Poulter et al. 2023). MODIS NBAR data for prediction was acquired using the NASA Application for Extracting and Exploring Analysis Ready Samples (AρρEEARS).
MODIS data were filtered to the study region for the time period February 2000 to December 2023. Additional preprocessing of the daily NBAR time series included quality masking using the MODIS collection 6.1 MCD43A2 BRDF and Albedo Quality dataset to keep pixels with bit values 0-3 indicating good quality inversion data that are not filled. Water masks for NBAR images and composites were created for delineating water and land. This allowed for dynamic water masking on either daily images or monthly composites to remove inundated pixels from further analyses when appropriate. A static water and urban mask was created from MODIS Terra Land Water Mask (MOD44W.006) data from 2000 - 2015 to remove non-vegetated pixels for mapping purposes.
Upscale Modeling
Daily average fluxes from airborne CARAFE and EC towers were used as the basis for upscaling CO2 flux and CH4 flux. Combined CARAFE and EC tower data provided improved geographic and temporal coverage of fluxes and captured variability across wetland habitats, disturbances, and seasons in the study area. MODIS band reflectances (blue, green, red, NIR1, NIR2, SWIR1 and SWIR2) were sampled at 500-m for each CARAFE and EC tower flux measure on a given date to serve as predictor covariates in upscaling the flux response.
Bootstrap random forest regressions were developed for each flux using the combined CARAFE and EC tower fluxes. Random forest was selected for its robustness to outliers and similar performance to other machine learning algorithms in predicting net ecosystem exchange (NEE) in the ENP and BCNP (Zhang et al. 2021).
These regression models were then used to predict daily CO2 and CH4 fluxes as a function of MODIS NBAR reflectance across the study area, resulting in 500-m gridded daily average CO2 flux ± standard error and daily average CH4 flux ± standard error covering the available NBAR archive from Feb 2000 to August 2024. Upscaled model flux predictions were generated using the NASA Center for Climate Simulation (NCCS) Discover Supercomputer. These BlueFlux prototype outputs include daily predicted mean fluxes and standard deviations.
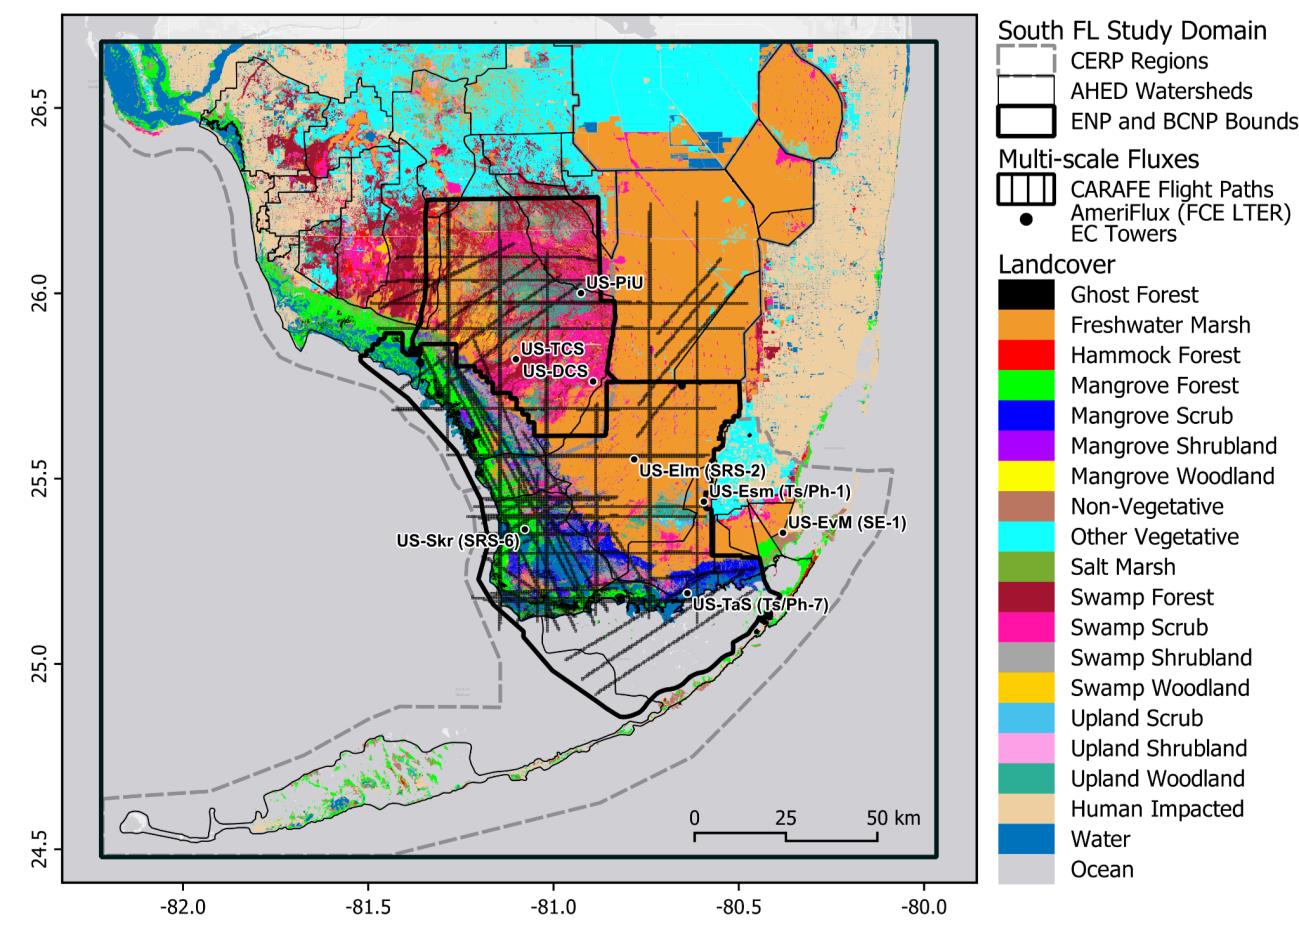
Figure 2. The BlueFlux study domain over the Florida Everglades ecosystem where multi-scale flux observations were collected from AmeriFlux (FCE LTER) EC towers and airborne CARAFE flights.
See Doughty et al. (2025) for details of methods and results from a related analysis.
Data Access
These data are available through the Oak Ridge National Laboratory (ORNL) Distributed Active Archive Center (DAAC).
BlueFlux: Modeled Daily CO2 and CH4 Wetland Fluxes, Southern Florida, 2000-2024
Contact for Data Center Access Information:
- E-mail: uso@daac.ornl.gov
- Telephone: +1 (865) 241-3952
References
Delaria, E. R., G. Wolfe, K. Blanock, R. A. Hannun, K. L. Thornhill, P. A. Newman, L. Lait, S. R. Kawa, J. Alvarez, S. Blum, E. Castañeda-Moya, C. D. Holmes, D. Lagomasino, S. L. Malone, D. Murphy, S. F. Oberbauer, C. Pruett, A. Sere, G. Starr, R. Szot, T. Troxler, D. Yannick, and B. Poulter. 2024a. Assessment of landscape-scale fluxes of carbon dioxide and methane in subtropical coastal wetlands of South Florida. ESS Open Archive, April 16, 2024 (preprint). https://doi.org/10.22541/essoar.171322735.54594835/v1
Delaria, E.R., G.M. Wolfe, R.A. Hannun, K. Blanock, B. Poulter, and K.L. Thornhill. 2024b. BlueFlux Airborne Trace Gases, Fluxes, and Mixing Ratios, Southern Florida, 2022-2023. ORNL DAAC, Oak Ridge, Tennessee, USA. https://doi.org/10.3334/ORNLDAAC/2327
Doughty, C., Q. Ying, E. Ward, E. Delaria, G. Wolfe, S. Malone D. Reed, T. Troxlet, J. Kominoski, E. Castaneda, B. Shoemaker, D. Yannick, G. Starr, S. Oberbauer, C. Amaral, A. Barblitt, A. Campbell, S. Charles, L. Fatoyimbo, J. Gewirtzman, T. Hanisco, R. Hannun, S. Kawa, D. Lagomasino, L. Lait, A. Lindquist, P. Newman. P. Raymond, J. Rosentreter, K. Thornhill, D. Vaughn, and B. Poulter. 2025. Compounded effects of climate change and management on blue carbon ecosystems via flux upscaling to support nature-based climate solutions. Manuscript in preparation.
EPA. 2024. Inventory of U.S. Greenhouse Gas Emissions and Sinks: 1990-2022. U.S. Environmental Protection Agency, EPA 430R-24004. https://www.epa.gov/ghgemissions/inventory-us-greenhouse-gas-emissions-and-sinks-1990-2022
Joiner, J., Y. Yoshida, Y. Zhang, G. Duveiller, M. Jung, A. Lyapustin, Y. Wang, and C. J. Tucker. 2018. Estimation of terrestrial global gross primary production (GPP) with satellite data-driven models and eddy covariance flux data. Remote Sensing 10:1346. https://doi.org/10.3390/rs10091346
Poulter, B., F. M. Adams-Metayer, C. Amaral, A. Barenblitt, A. Campbell, S. P. Charles, R. M. Roman-Cuesta, R. D’Ascanio, E. R. Delaria, C. Doughty, T. Fatoyinbo, J. Gewirtzman, T. F. Hanisco, M. Hull, S. R. Kawa, R. Hannun, D. Lagomasino, L. Lait, S. L. Malone, P. A. Newman, P. Raymond, J. A. Rosentreter, N. Thomas, D. Vaughn, G. M. Wolfe, L. Xiong, Q. Ying, and Z. Zhang. 2023. Multi-scale observations of mangrove blue carbon ecosystem fluxes: The NASA Carbon Monitoring System BlueFlux field campaign. Environmental Research Letters 18:075009. https://doi.org/10.1088/1748-9326/acdae6
Ruiz, P., T. Schall, R. Shamblin, and K. Whelan. 2021. The vegetation of Everglades National Park: Final report. Natural Resource Report NPS/SFCN/NRR-2021/2256. National Park Service. https://doi.org/10.36967/nrr-2286460
SFWMD. 2024. SFWMD Land Cover Land Use 2017-2019. SFWMD Geospatial Services, South Florida Water Management District. https://www.sfwmd.gov/science-data/gis
Vaughn, D., and P. Raymond. 2024. BlueFlux: Dissolved Carbon and Greenhouse Gases. ORNL DAAC, Oak Ridge, Tennessee, USA. https://doi.org/10.3334/ORNLDAAC/2333
Wolfe, G. M., S. R. Kawa, T. F. Hanisco, R. A. Hannun, P. A. Newman, A. Swanson, S. Bailey, J. Barrick, K. L. Thornhill, G. Diskin, J. DiGangi, J. B. Nowak, C. Sorenson, G. Bland, J. K. Yungel, and C. A. Swenson. 2018. The NASA Carbon Airborne Flux Experiment (CARAFE): instrumentation and methodology. Atmospheric Measurement Techniques 11:1757–1776. https://doi.org/10.5194/amt-11-1757-2018
Xiong, L., D. Lagomasino, and B. Poulter. 2024. Blueflux: Terrestrial Lidar Scans of Mangrove Forests, Everglades, FL, USA, 2022-2023. ORNL DAAC, Oak Ridge, Tennessee, USA. https://doi.org/10.3334/ORNLDAAC/2311
Zhang, C., D. Brodylo, M. J. Sirianni, T. Li, X. Comas, T. A. Douglas, and G. Starr. 2021. Mapping CO2 fluxes of cypress swamp and marshes in the Greater Everglades using eddy covariance measurements and Landsat data. Remote Sensing of Environment 262:112523. https://doi.org/10.1016/j.rse.2021.112523