Documentation Revision Date: 2024-03-22
Dataset Version: 1
Summary
There are 159 data files in ICARTT (.ict) version 1.1 format with this dataset.
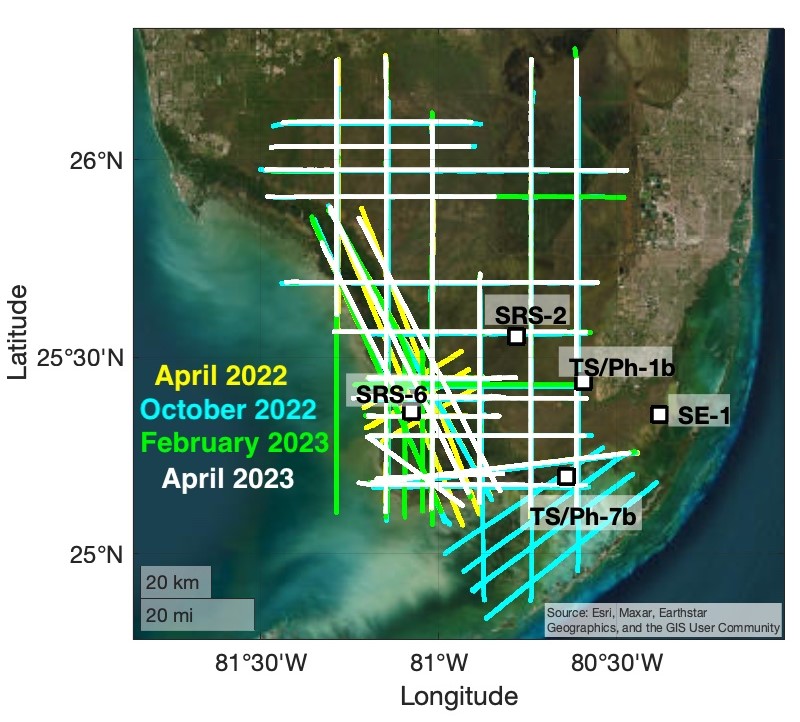
Figure 1. Map of flight lines for each deployment during the campaign. The squares are ground-based tower measurements. Map courtesy of E.R. Delaria.
Citation
Delaria, E.R., G.M. Wolfe, R.A. Hannun, K. Blanock, B. Poulter, and K.L. Thornhill. 2024. BlueFlux Airborne Trace Gases, Fluxes, and Mixing Ratios, Southern Florida, 2022-2023. ORNL DAAC, Oak Ridge, Tennessee, USA. https://doi.org/10.3334/ORNLDAAC/2327
Table of Contents
- Dataset Overview
- Data Characteristics
- Application and Derivation
- Quality Assessment
- Data Acquisition, Materials, and Methods
- Data Access
- References
Dataset Overview
This dataset includes airborne in situ measurements of greenhouse gas mixing ratios, meteorological parameters, and fluxes (CO2, CH4, latent heat fluxes, friction velocity, and convective velocity scale) calculated with wavelet transforms. CO2, CH4, CO, O3, and water vapor mixing ratios, and meteorological variables were obtained from a Beechcraft A90 King Air aircraft. Flights occurred on April 19-26 2022, October 14-20 2022, February 5-13 2023, and April 13-19 2023 as part of the BlueFlux campaign, funded by NASA’s Carbon Monitoring System program. Measurements were made with several instruments, including a PICARRO 2401-m (0.5 Hz CO2/CH4/H2O/CO), PICARRO 2311-f (10 Hz CO2/CH4/H2O), NASA Rapid Ozone Experiment (ROZE, 10 Hz O3), and AIMMS-20 probe (3-D winds, meteorology, and aircraft location data). Flight lines span Everglades National Park (ENP) and Big Cypress National Preserve (BCNP) in southern Florida, USA. The measurements were used to calculate vertical fluxes of trace gases and heat via wavelet transform eddy covariance
Project: Carbon Monitoring System
The NASA Carbon Monitoring System (CMS) program is designed to make significant contributions in characterizing, quantifying, understanding, and predicting the evolution of global carbon sources and sinks through improved monitoring of carbon stocks and fluxes. The System uses NASA satellite observations and modeling/analysis capabilities to establish the accuracy, quantitative uncertainties, and utility of products for supporting national and international policy, regulatory, and management activities. CMS data products are designed to inform near-term policy development and planning.
Related Publication
Wolfe, G.M., S.R. Kawa, T.F. Hanisco, R.A. Hannun, P.A. Newman, A. Swanson, S. Bailey, J. Barrick, K.L. Thornhill, G. Diskin, and J. DiGangi. 2018; The NASA carbon airborne flux experiment (CARAFE): instrumentation and methodology. Atmospheric Measurement Techniques 11:1757-76. https://doi.org/10.5194/amt-11-1757-2018
Acknowledgments
This study was funded by the NASA Carbon Monitoring System (WBS 281945.02.03.11.35) and the NASA Postdoctoral Program.
Data Characteristics
Spatial Coverage: southern Florida, USA
Spatial Resolution: approximately 7-8 m for 10-Hz measurements; 70-80 m for 1-Hz data; and 150 m for 0.5-Hz data.
Temporal Coverage: Four deployment periods. April 19-26 2022, October 14-20 2022, February 5-13 2023, and April 13-19 2023
Temporal Resolution: 10 Hz for fast GHG and O3 mixing ratios. 0.5 Hz data for slow GHG mixing ratios. 1 Hz for flux data. 20 Hz for meteorological data.
Study Area: Latitude and longitude are given in decimal degrees
| Site | Westernmost Longitude | Easternmost Longitude | Northernmost Latitude | Southernmost Latitude |
|---|---|---|---|---|
| southern Florida | -81.53 | -80.35 | 29.99 | 24.80 |
Data File Information
There are 159 data files in ICARTT (.ict) version 1.1 format with this dataset.
Files are named in accordance with the ICARTT naming convention:
<project>-<measurement>_<platform>_<date>_<revision number>_<sortie>.ict, where
- <project> = "blueflux"
- <measurement> = measurement type listed in Table 1
- <platform> = "kingair"
- <revision number> = data processing revision number (e.g., "R0", "R1", "R2"), etc.
- <sortie> = optional flight leg or sortie designator (e.g., "L1, "L2")
Table 1. Measurement types.
| Measurement | Description (instrument) |
|---|---|
| ghg-slow | 0.5 Hz CO2/CH4/H2O/CO mixing ratios (PICARRO 2401-m) |
| ghg-fast | 10 Hz CO2/CH4/H2O mixing ratios (PICARRO 2311-f) |
| roze | ozone (O3) mixing ratios (NASA Rapid OZone Experiment, ROZE) |
| ghg-flux | fluxes of greenhouse gases and meteorological parameters |
| o3-flux | fluxes of ozone and meteorological parameters |
| aimms20 | winds and meteorological measurements (Aircraft-Integrated Meteorological Measurement System, AIMMS-20) |
| metmodel | high resolution rapid refresh meteorological model interpolated along the flight track |
Ozone flux and concentration measurements are only available for the deployment periods February 2023 and April 2023.
Data File Properties:
These files are ICARTT time-series data files in text format. The ICARTT version 1.1 format specification is available at https://www-air.larc.nasa.gov/missions/etc/IcarttDataFormat.htm. The files contain columns of variables at different time points along the flight line, indicated by the time variable in each file given in UTC in units of seconds. Each ICARTT file includes a header holding metadata with details that may be specific to the data contained therein.
Missing data are typically indicated by -9999 or -99999; see metadata in file header.
Table 1. Variables in the data files.
| Variable | Units | Description | Measurement type |
|---|---|---|---|
| Time_Start | s |
Start time of measurement |
ghg-slow,ghg-fast |
| Time_Stop | s | Stop time of measurement | ghg-slow |
| Time_Mid | s | Midpoint of measurement | ghg-flux, o3-flux,metmodel |
| UTC_mid | s | Seconds after midnight, Time of acquisition | aimms20 |
| CO2_ppm | ppm | Dry mole fraction of carbon dioxide | ghg-slow, ghg-fast |
| CH4_ppm | ppm | Dry mole fraction of methane | ghg-slow, ghg-fast |
| H2O_ppm | ppm | Mixing ratio of water vapor | ghg-slow, ghg-fast |
| CO_ppb | ppb | Mixing ratio of carbon monoxide | ghg-slow |
| GPS_Alt | m | Garmin GPS altitude | ghg-slow, ghg-fast |
| GPS_Lon | deg | Garmin GPS longitude | ghg-slow, ghg-fast |
| GPS_Lat | deg | Garmin GPS latitude | ghg-slow, bghg-fast |
| Leg | - | Flight leg (sortie) index | ghg-flux, o3-flux |
| Lat | degrees_north | GPS latitude | ghg-flux, o3-flux, metmodel |
| Lon | degrees_east | GPS longitude | ghg-flux, o3-flux, metmodel |
| Alt | m | GPS altitude | ghg-flux, o3-flux |
| Dist | m | Distance along leg | ghg-flux, o3-flux |
| ustar | m s-1 | Friction velocity | ghg-flux, o3-flux |
| wstar | m s-1 | Convective velocity scale | ghg-flux, o3-flux |
| LE | W m-2 | Latent heat flux | ghg-flux |
| FCO2 | umol m-2 s-1 | CO2 flux | ghg-flux |
| FCH4 | nmol m-2 s-1 | CH4 flux | ghg-flux |
| LE_RE | W m-2 | flux random error for latent heat | ghg-flux |
| FCO2_RE | uumol m-2 s-1 | flux random error for CO2 | ghg-flux |
| FCH4_RE | nmol m-2 s-1 | flux random error for CH4 | ghg-flux |
| LE_SE | - | flux systematic error fraction | ghg-flux |
| FCO2_SE | - | flux systematic error fraction for CO2 | ghg-flux |
| FCH4_SE | - | flux systematic error fraction for CH4 | ghg-flux |
| LE_qflag | - | LE quality flag | ghg-flux |
| FCO2_qflag | - | FCO2 quality flag | ghg-flux |
| FCH4_qflag | - | FCH4 quality flag | ghg-flux |
| u | m s-1 | Along-vector wind speed | ghg-flux, o3-flux |
| v | m s-1 | Cross-vector horizontal wind speed | ghg-flux, o3-flux |
| WDIR | deg | Calculated horizontal wind direction | ghg-flux, o3-flux |
| WSPD | deg | Calculated horizontal wind direction | ghg-flux, o3-flux |
| u_std | m s-1 | Standard deviation of along-vector wind speed | bghg-flux, o3-flux |
| v_std | m s-1 | Standard deviation of cross-vector horizontal wind speed | ghg-flux, o3-flux |
| w_std | m s-1 | Standard deviation of vertical wind speed | ghg-flux, o3-flux |
| Lobukhov | m | Obukhov length | ghg-flux, o3-flux |
| FO3 | nmol m-2 s-1 | O3 flux | o3-flux |
| FO3_RE | nmol m-2 s-1 | O3 flux random error | o3-flux |
| FO3_SE | - | O3 flux systematic error fraction | bo3-flux |
| FO3_qflag | - | FO3 quality flag | o3-flux |
| Latitude_deg | degrees_north | Latitude from AIMMS-20 | aimms20 |
| Longitude_deg | degrees_east | Longitude form AIMMS-20 | aimms20 |
| gpsALT_ft | ft | GPS altitude from AIMMS-20 in feet | aimms20 |
| u_ms-1 | m s-1 | East/west wind | aimms20 |
| v_ms-1 | m s-1 | North/south wind | aimms20 |
| w_ms-1 | m s-1 | Vertical wind | aimms20 |
| WSPD_ms-1 | m s-1 | Horizontal wind speed | aimms20 |
| WDIR_deg | degrees | Horizontal wind direction | aimms20 |
| Tstat_degC | degrees_C | Static air temperature | aimms20 |
| RH | percent | Relative humidity | aimms20 |
| Pstat_mb | Mb | Static pressure | aimms20 |
| Pitch_deg | degrees | Aircraft pitch angle | aimms20 |
| Roll_deg | degrees | Aircraft roll angle | aimms20 |
| HDG_deg | degrees | Aircraft heading | aimms20 |
| TAS_ms-1 | m s-1 | Aircraft true air speed | aimms20 |
| HPBL | m | Mixed layer depth | metmodel |
Application and Derivation
BlueFlux is a NASA Carbon Monitoring Systems (CMS) project to measure greenhouse gases (GHG) in Florida mangrove and related ecosystems. Airborne flux measurements were performed in southern Florida over the Everglades and Big Cypress National Preserve region during April 2022, October 2022, February 2023, and April 2023. Flux transects during each deployment are linear flight portions of length 30 -150 km at an altitude of ~300 ft (90 m) and average airspeed of 65 - 80 m s-1 (130 - 150 kts). Flights were designed to have flux legs greater than 20 km in length targeting mangrove forests, regions of recent mangrove dieback (ghost forests), and areas with different dominant vegetation. The dataset includes continuous in situ measurements of CO2, CH4, CO, H2O, and derived fluxes of CO2, CH4, O3, sensible heat (H) and latent heat (LE). This dataset covers a large section of the southern Florida region and demonstrates the heterogeneity of GHG and O3 exchange.
Quality Assessment
Measurements of the mixing ratios in “blueflux-ghg-slow” made with the PICARRO 2401-m have an accuracy (systematic uncertainty) of 0.2 ppm CO2, 0.004 ppm CH4, 1.3 ppb CO, and 2 ppm H2O. Precision (random uncertainty) is 0.03 ppm CO2, 0.0002 ppm CH4, 3 ppb CO, and 20 ppm H2O.
Mixing ratios provided in “blueflux-ghg-fast”, measured with the PICARRO 2311-f have an accuracy (systematic uncertainty) of +/- 0.2 ppm, +/- 0.004 ppm, and +/- 200 ppm for CO2, CH4, and H2O, respectively. Precision (random uncertainty) is 0.08 ppm CO2, 0.0006 ppm CH4, and 1 ppm + 3% for H2O.
Uncertainty in the PICARRO measurements were determined from a lab calibration against WMO-traceable standards. When averaging, precision reduces as (number of points)0.5, but accuracy does not reduce.
O3 mixing ratios measured with the ROZE instrument and reported in “blueflux-roze” are accurate to within 6.8% (1 sigma). The accuracy of horizontal winds (u and v) is +/- 0.75 m/s and vertical winds (w) is +/-0.5 m/s.
Uncertainties for derived fluxes are reported in “blueflux-ghg-flux” and “blueflux-o3-flux”. Systematic error contributions to flux uncertainties include error due to under-sampling high and low frequencies (SEturb), the instrument response time limiting detection of high-frequency signals (SERT), and instrument accuracy (SEacc). The e-folding response time used to calculate SERT was determined through laboratory tests to be 90 ± 10 ms for the PICARRO 2311-f, which translates to an effective cutoff measurement frequency of 3.8 Hz. SEacc for each scalar is based on the measurement precision and that of the vertical wind speed, w. The AIMMS-20 probe has an instrument precision of 10% for the vertical wind. The cumulative systematic error is provided, while component error contributions are available upon request.
Random flux errors are due to turbulence (stochastic noise) and instrument noise. We empirically calculate the total random flux error (RERMSE) as the root mean squared deviation from zero of the cross-covariance between a scalar, s, and w:
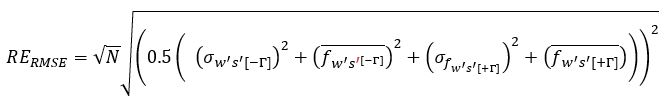
Here N is the number of data points per second, σw's' is the standard deviation and ƒw’s’ is the average cross-covariance over a time lag range of -Γ or +Γ. The value Γ was defined to be over a time lag range from one to 100 data points. Here 100 was chosen as the maximum lag considered for Γ to be representative of the integral time scale. This representation considered the variability in the cross-covariance of s and w, as well as the offset from zero related to trends in the data not related to turbulence. Note that RE is given in flux units, while SE is in fractional units.
The total flux error can be calculated as E = sqrt(RE2 + (SE*F)2). When averaging fluxes, average errors are: SEavg = mean(SE), REavg = sqrt(sum(RE2))/N, where N is number of points in the average. Divergence uncertainty should be added in fractional quadrature with RE and SE: Esurf = Fsurf*sqrt(F_div_err2 + (RE/F)2 + SE2). Fluxes can become spurious at the beginning/end of a flight leg due to the cone-of-influence. Quality flags (F_qflag) are provided to filter out suspect fluxes. A qflag of 1 denotes good quality fluxes. By definition, F_qflag is 1 when the fraction of cospectral power within the cone-of-influence is < 0.5.
Data Acquisition, Materials, and Methods
The data were obtained from in situ measurements from a Beechcraft A90 King Air (N87Q), operated out of Homestead, Florida, USA by Dynamic Aviation during four deployment periods:
- April 2022: 19, 20, 21, 22, 24, 25, and 26
- October 2022: 14, 15, 17, 18, and 20
- February 2023: 6, 7, 8, 10, 11, and 13
- April 2023: 13, 14, 15, 16, 18, and 19
Measurements were made with PICARRO 2401-m (0.5 Hz CO2/CH4/H2O/CO), PICARRO 2311-f (10 Hz CO2/CH4/H2O), NASA Rapid Ozone Experiment (ROZE, 10 Hz O3), and AIMMS-20 probe (3-D winds, meteorology, and aircraft location data). Flight data covers much of the southern Florida regions, especially over the Everglades National Park and Big Cypress National Preserve.
Ambient air was sampled from a common inlet (0.5-inch stainless steel with fluoropel coating) located under right wing. The sample tube had an inner diameter 0.25 inch and a length of about 25 feet, material FEP. Each PICARRO instrument was backed by an Agilent IDP3 scroll pump. Both PICARRO instruments were calibrated with WMO-grade calibration NOAA cylinders (IDs CC746186 and CA03516). Greenhouse gas (GHG) instruments were time-aligned through lag correlation. The time response of PICARRO 2311-f was 100 ms (1/e) based on laboratory pulse-decay experiments. 10 Hz PICARRO 2311-f CO2 and CH4 data were corrected for a pressure dependence using 2401-m measurements.
The AIMMS-20 probe (Advantech) was mounted under the left wing and measured ambient temperature, pressure, and relative humidity. 3-D winds were calculated from differential dynamic pressures using AIMMS software. Probe calibration flights occurred prior to the start of each deployment.
O3, CO2, CH4, latent heat (LE), sensible heat (H), and momentum fluxes at aircraft radar altitudes of 300-900 ft were calculated with wavelet transforms (Torrence and Compo, 1998) applied to 10-Hz observations over each leg. Scalar time series were detrended with a 40 second (~3 km) running mean. Reported fluxes include contributions from all frequencies, including those within the cone-of-influence. Raw 10-Hz fluxes are bin-averaged to 1 Hz (~70-80 m horizontal resolution). Friction velocities (ustar) are filtered for momentum fluxes with the fraction of the cospectral power lying within the cone-of-influence <0.5. wstar has been filtered in the same manner with sensible heat fluxes.
Ozone flux and concentration measurements are only available for the deployment periods February 2023 and April 2023.
See Wolfe et al. (2018) for additional details about airborne in situ sampling methods.
Data Access
These data are available through the Oak Ridge National Laboratory (ORNL) Distributed Active Archive Center (DAAC).
BlueFlux Airborne Trace Gases, Fluxes, and Mixing Ratios, Southern Florida, 2022-2023
Contact for Data Center Access Information:
- E-mail: uso@daac.ornl.gov
- Telephone: +1 (865) 241-3952
References
Wolfe, G.M., S.R. Kawa, T.F. Hanisco, R.A. Hannun, P.A. Newman, A. Swanson, S. Bailey, J. Barrick, K.L. Thornhill, G. Diskin, and J. DiGangi. 2018; The NASA carbon airborne flux experiment (CARAFE): instrumentation and methodology. Atmospheric Measurement Techniques 11:1757-76. https://doi.org/10.5194/amt-11-1757-2018
Torrence, C., and G.P. Compo. 1998. A practical guide to wavelet analysis. Bulletin of the American Meteorological Society 79:61-78. https://doi.org/10.1175/1520-0477(1998)079<0061:APGTWA>2.0.CO;2