Documentation Revision Date: 2019-01-22
Data Set Version: 1
Summary
There are two comma separated data (*.csv) files for this dataset.
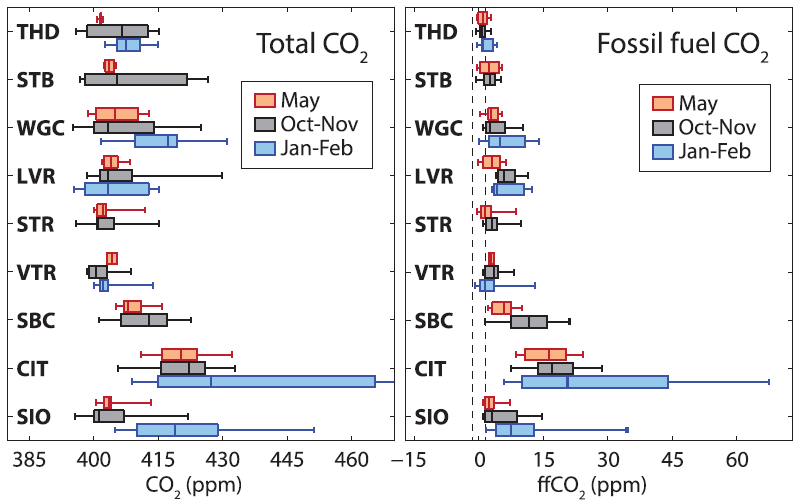
Figure 1. Boxplots showing seasonal quartiles of total CO2 concentrations and fossil fuel CO2 concentrations for each of the nine observation sites in California, 2014-2015. From Graven et al. (2018).
Citation
Graven, H., M.L. Fischer, T. Lueker, S. Jeong, T.P. Guilderson, R.F. Keeling, R. Bambha, K. Brophy, W. Callahan, X. Cui, C. Frankenberg, K.R. Gurney, B.W. Lafranchi, S. Lehman, H.A. Michelsen, J.B. Miller, S. Newman, W. Paplawsky, N.C. Parazoo, C. Sloop, and S.J. Walker. 2019. CMS: Atmospheric CO2 and C Isotopes, Fossil Fuel Contributions, California, 2014-2015. ORNL DAAC, Oak Ridge, Tennessee, USA. https://doi.org/10.3334/ORNLDAAC/1641
Table of Contents
- Data Set Overview
- Data Characteristics
- Application and Derivation
- Quality Assessment
- Data Acquisition, Materials, and Methods
- Data Access
- References
Data Set Overview
This dataset provides measurements of atmospheric CO2 concentrations, carbon isotopes δ13C and Δ14C and, fossil fuel CO2 (ffCO2) estimates from nine observation sites in California over three month-long campaigns in separate seasons of 2014-2015. ffCO2 was quantified based on the CO2 concentration and Δ14C. Simulations of ffCO2 at the sites and times of the observations were conducted with the Vulcan v2.2 fossil fuel emissions estimate for 2002 and the Weather Research and Forecasting - Stochastic Time-Inverted Lagrangian Transport (WRF-STILT) atmospheric model. The observed and simulated ffCO2 were incorporated into Bayesian inverse estimates of ffCO2 to calculate California's ffCO2 emissions during the campaign period.
Project: Carbon Monitoring System (CMS)
The NASA Carbon Monitoring System (CMS) is designed to make significant contributions in characterizing, quantifying, understanding, and predicting the evolution of global carbon sources and sinks through improved monitoring of carbon stocks and fluxes. The System will use the full range of NASA satellite observations and modeling/analysis capabilities to establish the accuracy, quantitative uncertainties, and utility of products for supporting national and international policy, regulatory, and management activities. CMS will maintain a global emphasis while providing finer scale regional information, utilizing space-based and surface-based data and will rapidly initiate generation and distribution of products both for user evaluation and to inform near-term policy development and planning.
Related Publication:
Graven, H. D., Fischer, M. L., Lueker, T., Jeong, S., Guilderson, T. P., Keeling, R., Bambha, R. P., Brophy, K., Callahan, W., Cui, X., Frankenberg, C., Gurney, K. R., LaFranchi, B., Lehman, S., Michelsen, H., Miller, J. B., Newman, S., Paplawsky, W., Parazoo, N., Sloop, C., Walker, S. J. 2018. Assessing fossil fuel CO2 emissions in California using atmospheric observations and models. Environmental Research Letters. https://doi.org/10.1088/1748-9326/aabd43
Related Dataset:
Fischer, M.L., N.C. Parazoo, K. Brophy, X. Cui, S. Jeong, J. Liu, R. Keeling, T.E. Taylor, K.R. Gurney, T. Oda, and H. Graven. 2017. CMS: CO2 Signals Estimated for Fossil Fuel Emissions and Biosphere Flux, California. ORNL DAAC, Oak Ridge, Tennessee, USA. https://doi.org/10.3334/ORNLDAAC/1381
Acknowledgements:
This project was funded by NASA Carbon Monitoring System (NNX13AP33G and NNH13AW56I).
Data Characteristics
Spatial Coverage: California, USA
Spatial Resolution: Point locations
Temporal Coverage: 2014-05-01 through 2015-02-16
Temporal Resolution: Seasonal
Study Area (All latitudes and longitudes are given in decimal degrees):
| Sites | Westernmost Longitude | Easternmost Longitude | Northernmost Latitude | Southernmost Latitude |
|---|---|---|---|---|
| California, USA | -124.151 | -117.257 | 41.055 | 32.867 |
Table 1. Observation sites in California.
| Site | Code | Latitude | Longitude | Sampling height (magl) |
|---|---|---|---|---|
| Trinidad Head | THD | 41.055 | -124.151 | 20 |
| Sutter Buttes | STB | 39.206 | -121.821 | 10 |
| Walnut Grove | WGC | 38.265 | -121.491 | 91 |
| Sutro | STR | 37.755 | -122.452 | 232 |
| Sandia-Livermore | LVR | 37.674 | -121.708 | 27 |
| Victorville | VTR | 34.609 | -117.287 | 90 |
| Caltech | CIT | 34.137 | -118.126 | 10 |
| San Bernardino | SBC | 34.085 | -117.313 | 58 |
| Scripps Inst. Ocean | SIO | 32.867 | -117.257 | 10 |
Data file information:
There are two comma separated data (*.csv) files for this dataset. The file names and general descriptions are provided in Table 2.
Table 2. Data file names and general descriptions
| File Name | Description |
| graven_ca_co2_isotopes.csv | This file contains atmospheric CO2 concentrations, Δ14C of CO2, δ13C of CO2, and fossil fuel CO2 (ffCO2) estimates from nine observation sites in California |
| sampling_sites_graven_ca_co2_isotopes.csv |
This file contains location information for the nine observation sites. |
The columns names, their units, and descriptions in graven_ca_co2_isotopes.csv are listed below. Missing values within the data file are reported as -9999.
Table 3. Variables in the data file.
| Variable | Units/format | Description |
|---|---|---|
| Site | Text | One of the nine measurement sites. |
| Date | YYYY-MM-DD | Sampling date in UTC. |
| Time | hh:mm | Sampling time in UTC. |
| Time_zone | Text | Time zone for date and time columns. |
| CO2 | ppm | CO2 concentration. |
| δ13C | per mil | Ratio of 13C to 12C in CO2, relative to VPDB |
| Δ14C | per mil | Ratio of 14C to C in CO2, relative to Modern and including fractionation and age corrections |
| beta | ppm | Correction for biospheric, non-fossil influences on Δ14C. |
| beta_unc | ppm | Calculated uncertainty in beta. |
| ffCO2 | ppm | Estimated fossil fuel CO2 concentrations. |
| ffCO2_unc | ppm | Uncertainty in ffCO2. |
| prior_ffCO2 | ppm | The simulated fossil fuel CO2 concentration in the prior simulation using time-varying Vulcan emissions. |
| post_ffCO2 | ppm | The fossil fuel CO |
| outlier | 1 or 0 | A value of 1 indicates that a measurement was determined to be an outlier, based on two criteria: (1) simulated or observed ffCO2 is greater than 5 ppm, and (2) absolute differences between simulated and observed ffCO2 are greater than the average of the simulated and observed ffCO2. Only samples that met both criteria were identified as outliers. |
Application and Derivation
See Graven et al., 2018 for additional details.
Quality Assessment
See Graven et al., 2018 for more details.
Data Acquisition, Materials, and Methods
CO2 concentration and Δ14C in CO2 was measured at nine existing observation sites within California as listed in Table 1 and shown in Figure 2. The measured CO2 concentration and Δ14C in CO2 was used to observe fossil-derived CO2 (fossil fuel CO2 or ffCO2) emissions over California and use the observations in a top-down calculation of California's ffCO2 concentrations using Vulcan v2.2 and WRF-STILT atmospheric transport model. See Graven et al., 2018 for more details.
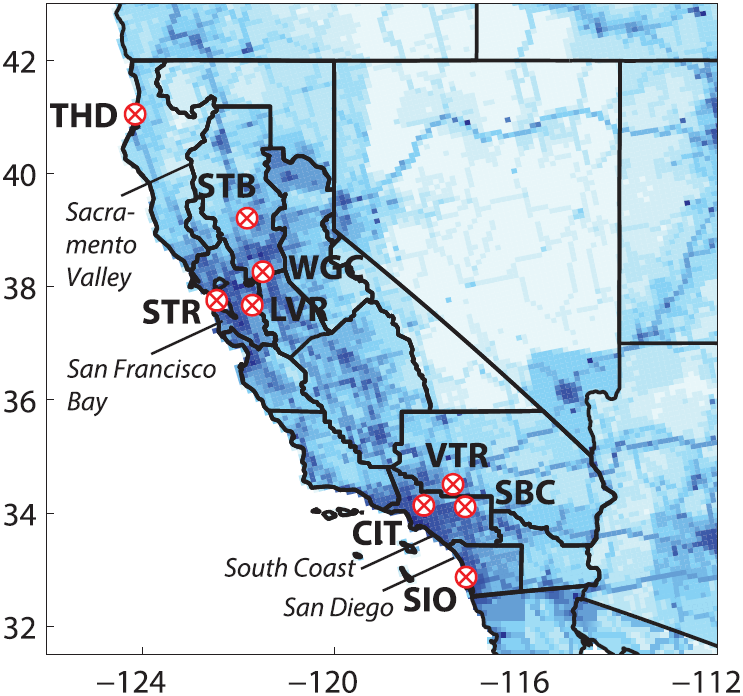
Figure 2. The sites in the observation network are shown as circles on the map: Trinidad Head (THD), Sutter Buttes (STB), Walnut Grove (WGC), Sutro (STR), Sandia-Livermore (LVR), Victorville (VTR), San Bernardino (SBC), Caltech (CIT) and Scripps Institution of Oceanography (SIO).
Data Access
These data are available through the Oak Ridge National Laboratory (ORNL) Distributed Active Archive Center (DAAC).
CMS: Atmospheric CO2 and C Isotopes, Fossil Fuel Contributions, California, 2014-2015
Contact for Data Center Access Information:
- E-mail: uso@daac.ornl.gov
- Telephone: +1 (865) 241-3952
References
Fischer M. L., et al., 2017. Simulating estimation of California fossil fuel and biosphere carbon dioxide exchanges combining in-situ tower and satellite column observations. J. Geophys. Res. Atmos. 122, 3653–71. https://doi.org/10.1002/2016JD025617
Graven, H. D., Fischer, M. L., Lueker, T., Jeong, S., Guilderson, T. P., Keeling, R., Bambha, R. P., Brophy, K., Callahan, W., Cui, X., Frankenberg, C., Gurney, K. R., LaFranchi, B., Lehman, S., Michelsen, H., Miller, J. B., Newman, S., Paplawsky, W., Parazoo, N., Sloop, C., Walker, S. J. 2018. Assessing fossil fuel CO2 emissions in California using atmospheric observations and models. Environmental Research Letters. https://doi.org/10.1088/1748-9326/aabd43