Documentation Revision Date: 2019-10-08
Dataset Version: 1
Summary
The burned pixels were processed into shapefiles representing annual burned area. Note that the 1997 map is a special case with fires continuing into and including 1998. No fires were recorded in 2008 and 2010.
There are 16 total data files in shapefile (.shp) format provided as compressed *.zip files. The data in the shapefiles are also provided as companion files in *.kmz format for viewing in Google Earth.

Figure 1. The area burned in 1997 and 1998 in Mawas area, Central Kalimantan, Indonesia is shown in pink. Inset with white dot, shows location of Mawas study site on the Island of Borneo. Source: Mawas.BA.1997.001.shp
Citation
Vetrita, Y., and M.A. Cochrane. 2019. Annual Burned Area from Landsat, Mawas, Central Kalimantan, Indonesia, 1997-2015. ORNL DAAC, Oak Ridge, Tennessee, USA. https://doi.org/10.3334/ORNLDAAC/1708
Table of Contents
- Dataset Overview
- Data Characteristics
- Application and Derivation
- Quality Assessment
- Data Acquisition, Materials, and Methods
- Data Access
- References
Dataset Overview
This dataset provides maps of annual burned area for the part of Mawas conservation program in Central Kalimantan, Indonesia from 1997 through 2015. Landsat imagery (TM, ETM+, OLI/TIR) at 30 m resolution was obtained for this 19-year period, including the variables surface reflectance, brightness temperature, and pixel quality assurance, plus the indices NDVI, NDMI, NBR, NBR2, SAVI, and MSAVI (See Table 1). The MODIS active fire product (MCD14) was used to define when fires occurred. Random Forest classifications were used to separate burned and unburned 30-m pixels with inputs of composites of Landsat indices and thermal bands, based on the pre- and post-fire values.
The burned pixels were processed into shapefiles representing annual burned area. Note that the 1997 map is a special case with fires continuing into and including 1998. No fires were recorded in 2008 and 2010.
Project: Carbon Monitoring System (CMS)
The NASA Carbon Monitoring System (CMS) is designed to make significant contributions in characterizing, quantifying, understanding, and predicting the evolution of global carbon sources and sinks through improved monitoring of carbon stocks and fluxes. The System will use the full range of NASA satellite observations and modeling/analysis capabilities to establish the accuracy, quantitative uncertainties, and utility of products for supporting national and international policy, regulatory, and management activities. CMS will maintain a global emphasis while providing finer scale regional information, utilizing space-based and surface-based data and will rapidly initiate generation and distribution of products both for user evaluation and to inform near-term policy development and planning.
Related Dataset:
Ferraz, A., S.S. Saatchi, L. Xu, S. Hagen, J. Chave, Y. Yu, V. Meyer, M. Garcia, C. Silva, O. Roswintiarti, A. Samboko, P. Sist, S.M. Walker, T. Pearson, A. Wijaya, F.B. Sullivan, E. Rutishauser, D. Hoekman, and S. Ganguly. 2019. Aboveground Biomass, Landcover, and Degradation, Kalimantan Forests, Indonesia, 2014. ORNL DAAC, Oak Ridge, Tennessee, USA. https://doi.org/10.3334/ORNLDAAC/1645
Acknowledgments:
This work was funded by NASA CMS grants NNX13AP46G, NNX17AC95G, and 80NSSC18K0235.
Data Characteristics
Spatial Coverage: Mawas area, Central Kalimantan, Indonesia
Spatial Resolution: Derived from 30 m Landsat imagery
Temporal Coverage: 1997-01-01 to 2015-12-31
Temporal Resolution: annual
Study Area: (all latitudes and longitudes given in decimal degrees)
| Site | Westernmost Longitude | Easternmost Longitude | Northernmost Latitude | Southernmost Latitude |
|---|---|---|---|---|
| Mawas, Central Kalimantan, Indonesia | 114.389621 | 114.609157 | -2.214576 | -2.502413 |
Data File Information
There are 16 total data files in shapefile (.shp) format provided as compressed *.zip files. The data in the shapefiles are also provided as companion files in *.kmz format for viewing in Google Earth.
Note that the 1997 map is a special case with fires continuing into and including 1998. No fires were recorded in 2008 and 2010.
File Naming Convention:
File names are structured as Mawas.BA.YYYY.001.shp, where:
Mawas– refers to the site name
BA – refers to Burned Area
YYYY – refers to the year of burn
001 – refers to the version of the product
Coordinate Reference System:
EPSG: 32750 (UTM Zone 50S (Transverse Mercator))
Application and Derivation
The Mawas area is/was a large peatland forest that has undergone numerous historical and recent human manipulations affecting land cover and ground water elevations. Fire disturbance is a major factor shaping this ecosystem and important to ongoing conservation and restoration projects.
Quality Assessment
SPOT 5 imagery available from the Indonesian National Institute of Aeronautics and Space (LAPAN) for 2014 and ground truth data from 2015 were used to verify the maps. In the cross-validation of the Random Forest classification, on average, the Out of Bag estimate of error rate was low (~1.5%) with an overall accuracy of ~98% from validating points.
Data Acquisition, Materials, and Methods
Landsat data series (TM, ETM+, OLI/TIR) from 1997 to 2015 were used to generate the annual burned areas. All available scenes of level 1T (path/raw 118/62) were selected using the U.S. Geological Survey (USGS) Earth Explorer website and limited to cloud cover less than 80%. All selected scenes were submitted to the Earth Resources Observation and Science (EROS) Center Science Processing Architecture (ESPA) Ordering Interface website for Level-2 product processing. The surface reflectance, brightness temperature, and pixel QA, including indices (NDVI, NDMI, NBR, NBR2, SAVI, and MSAVI; Table 1) were ordered. Only good pixels (i.e., flagged in pixel QA, meaning, cloud and water mask out) were employed to derive the maps.
Random Forest classifications were used to separate the burned and unburned pixels. All band indices and thermal bands in that particular year were employed to derive the annual maps, except for the 1997 event. The 1997 map was generated from Landsat series from 1997 to early 1998 (since burning was considered as a continuous event during the El Nino of 1997-1998). The final inputs used to run the algorithm were composites of indices and thermal bands, based on the pre- and post-fire values (Fig. 2).
The MODIS active fire product (MCD14) was used to define when fires occurred. The highest difference of indices values between pre-fire and post-fire periods was extracted. Post-fire values were the minimum pixel value (indices) and the maximum brightness temperatures (BT) of the Landsat thermal band (Band 6 for Landsat 7; Band 10 and 11 for Landsat 8) from the annual post-fire imagery set. Pre-fire values were the maximum pixel value (indices) and the minimum brightness temperatures (BT) from the annual pre-fire imagery set.
Burned and unburned training data depend largely on visual detection in imagery. A balanced number of training data points for both burned and unburned classes (~3000) were created, with 80% as training points and 20% as validation points. The salt-pepper noise of predicted burned areas was removed using a 3x3 windows majority filter. Owing to high cloud cover or smoke during fire events obscuring the land, some areas burned were likely to be undetected. For a number of fires, burned areas were added using visual-interpretation when possible. For the severe fire events of 2015, the annual map was merged with the Sentinel-1 burned area product provided by the European Space Agency (Lohberger et al. 2018).
Table 1. Variables used to derive the burned area maps.
| Variable | Abbreviation | Reference |
|---|---|---|
| Normalized difference vegetation index | NDVI | Tucker 1979 |
| Normalized difference moisture index | NDMI | Gao 1996 |
| Normalized burn ratio | NBR | Garcia & Caselles 1991 |
| Normalized burn ratio 2 | NBR2 | Key & Benson 2006 |
| Soil adjusted vegetation index | SAVI | Huete 1988 |
| Modified Soil Adjusted Vegetation Index | MSAVI | Qi 1994 |
| Brightness temperature | Band 6 (Landsat 5/7), Band 10 and 11 (Landsat 8) | USGS 2018 |
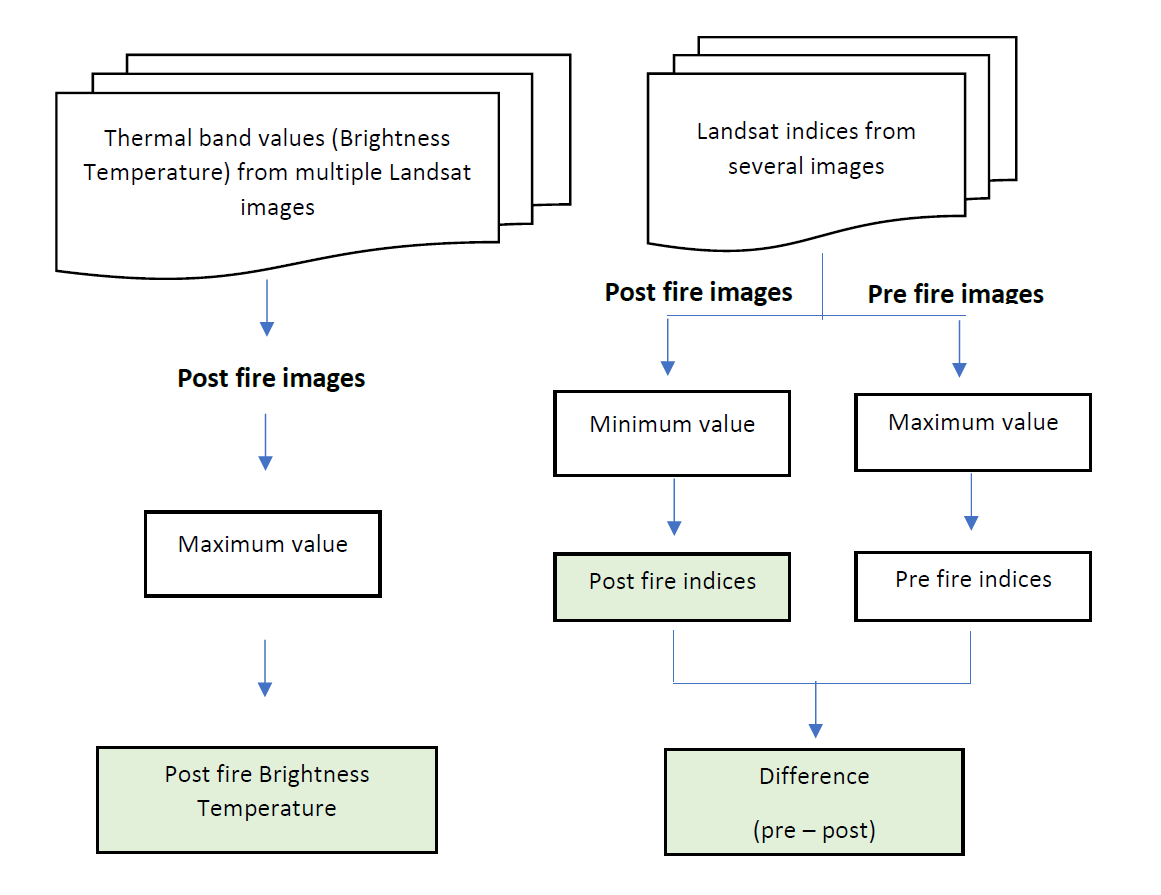
Figure 2. The process to composite Landsat images to derive the input variables for Random Forest algorithm to separate burned and unburned pixels. On the right side, we first identified the post- and pre-fire imagery based on the MODIS active fire product (MCD14) occurring in the year of interest. For each index (NDVI, NDMI, NBR, NBR2, SAVI, MSAVI), we selected the minimum value of post-fire images and the maximum value of pre-fire images. On the left side, we selected the maximum brightness temperature of the Landsat thermal band (Band 6 for Landsat 5/7; Band 10 and 11 for Landsat 8) for post-fire images. Green boxes represent all input variables used for the Random Forest algorithm.
Data Access
These data are available through the Oak Ridge National Laboratory (ORNL) Distributed Active Archive Center (DAAC).
Annual Burned Area from Landsat, Mawas, Central Kalimantan, Indonesia, 1997-2015
Contact for Data Center Access Information:
- E-mail: uso@daac.ornl.gov
- Telephone: +1 (865) 241-3952
References
Gao, B-C., NDWI—A normalized difference water index for remote sensing of vegetation liquid water from space. Remote Sensing of Environment, 1996. 58(3): p. 257-266. https://doi.org/10.1016/S0034-4257(96)00067-3
Garcia, M.L. and V. Caselles, Mapping burns and natural reforestation using Thematic Mapper data. Geocarto International, 1991. 6(1): p. 31-37. https://doi.org/10.1080/10106049109354290
Huete, A.R., A soil-adjusted vegetation index (SAVI). Remote sensing of environment, 1988. 25(3): p. 295-309. https://doi.org/10.1016/0034-4257(88)90106-X
Key, C. and N. Benson, Landscape assessment: remote sensing of severity, the normalized burn ratio and ground measure of severity, the composite burn index, in FIREMON: Fire effects monitoring and inventory system Ogden, Utah: USDA Forest Service, Rocky Mountain Res. Station, D.C. Lutes, Editor. 2006, United States Department of Agriculture.
Lohberger, S., Stängel, M., Atwood, E. C., & Siegert, F. (2018). Spatial evaluation of Indonesia's 2015 fire-affected area and estimated carbon emissions using Sentinel-1. Global change biology, 24(2), 644-654. https://doi.org/10.1111/gcb.13841
Qi, J., et al., A modified soil adjusted vegetation index. Remote Sensing of Environment, 1994. 48(2): p. 119-126. https://doi.org/10.1016/0034-4257(94)90134-1
Tucker, C.J., Red and photographic infrared linear combinations for monitoring vegetation. Remote sensing of Environment, 1979. 8(2): p. 127-150. https://doi.org/10.1016/0034-4257(79)90013-0
U.S. Geological Survey. Landsat 8 User Data Handbooks. https://www.usgs.gov/media/files/landsat-8-data-users-handbook, Last updated on October 2018.