Documentation Revision Date: 2021-04-03
Dataset Version: 1
Summary
There are 6 files in GeoTIFF (*.tif) format included in this dataset.
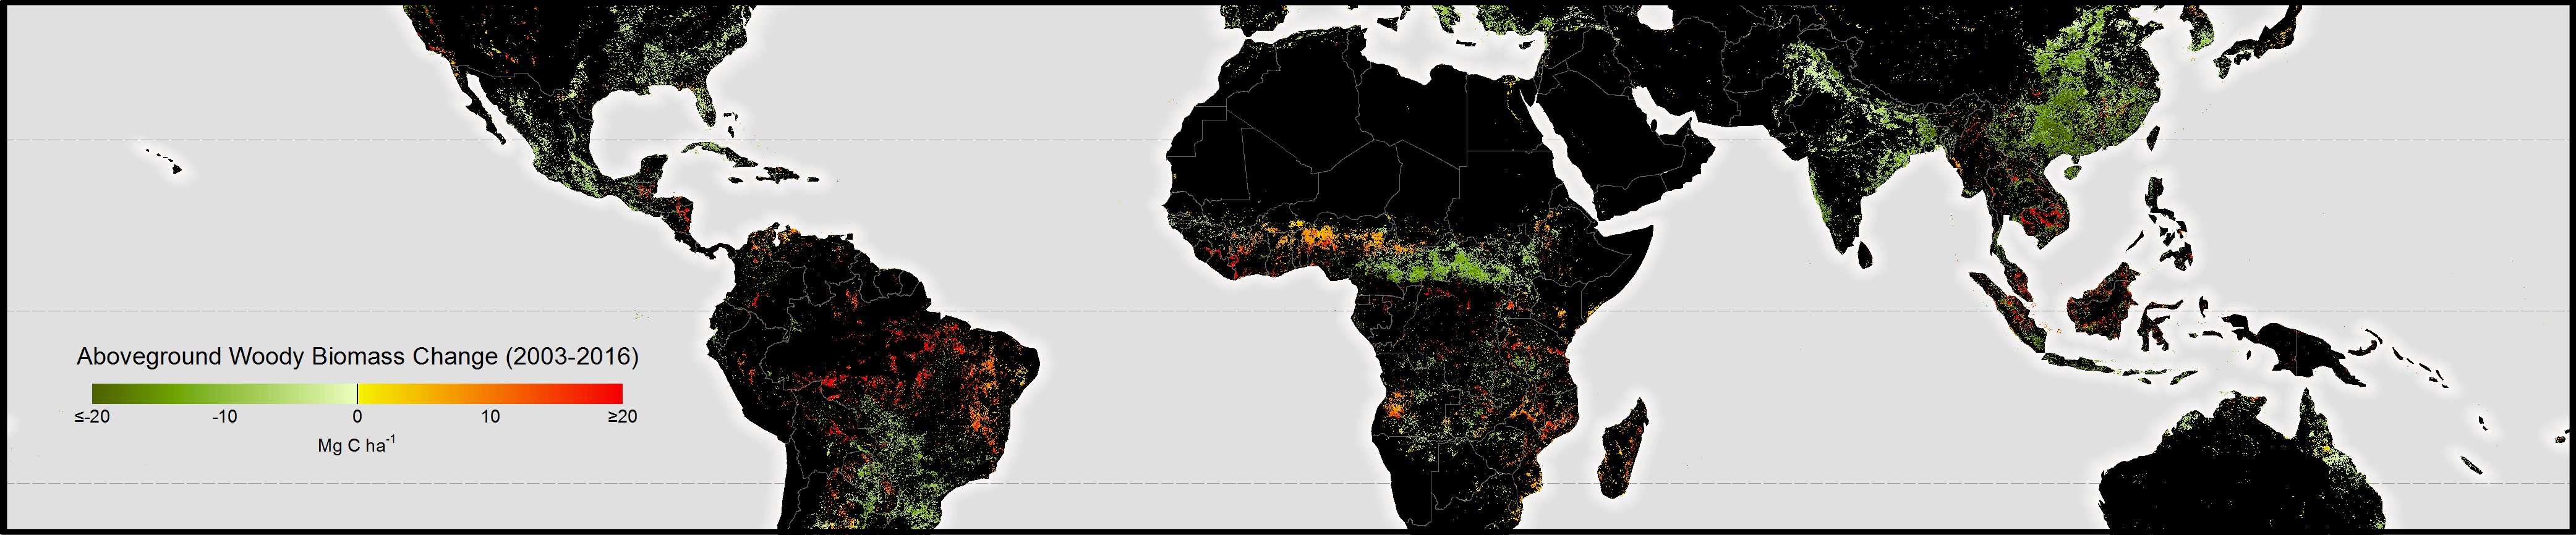
Figure 1. Pantropical aboveground biomass density change from 2003 to 2016. Data have been aggregated to ca. 5 km resolution for illustration.
Citation
Baccini, A., W. Walker, L.E. Carvalho, M.K. Farina, K.K. Solvik, and D. Sulla-Menashe. 2021. Aboveground Biomass Change for Amazon Basin, Mexico, and Pantropical Belt, 2003-2016. ORNL DAAC, Oak Ridge, Tennessee, USA. https://doi.org/10.3334/ORNLDAAC/1824
Table of Contents
- Dataset Overview
- Data Characteristics
- Application and Derivation
- Quality Assessment
- Data Acquisition, Materials, and Methods
- Data Access
- References
Dataset Overview
This dataset provides gridded estimates of aboveground biomass (AGB) for live dry woody vegetation density in the form of both stock for the baseline year 2003 and annual change in stock from 2003 to 2016. Data are at a spatial resolution of approximately 500 m (463.31 m; 21.47 ha) for three geographies: the biogeographical limit of the Amazon Basin, the country of Mexico, and a Pantropical belt from 40 degrees North to 30 degrees South latitudes. Estimates were derived from a multi-step modeling approach that combined field measurements with co-located LiDAR data from NASA ICESat Geoscience Laser Altimeter System (GLAS) to calibrate a machine-learning (ML) algorithm that generated spatially explicit annual estimates of AGB density. ML inputs included a suite of satellite and ancillary spatial predictor variables compiled as wall-to-wall raster mosaics, including MODIS products, WorldClim climate variables reflecting current (1960–1990) climatic conditions, and SoilGrids soil variables. The 14-year time series was analyzed at the grid cell (~500 m) level with a change point-fitting algorithm to quantify annual losses and gains in AGB. Estimates of AGB and change can be used to derive total losses, gains, and the net change in aboveground carbon density over the study period as well as annual estimates of carbon stock.
Project: Carbon Monitoring System
The NASA Carbon Monitoring System (CMS) program is designed to make significant contributions in characterizing, quantifying, understanding, and predicting the evolution of global carbon sources and sinks through improved monitoring of carbon stocks and fluxes. The System uses NASA satellite observations and modeling/analysis capabilities to establish the accuracy, quantitative uncertainties, and utility of products for supporting national and international policy, regulatory, and management activities. CMS data products are designed to inform near-term policy development and planning.
Related Publications
Baccini, A., S.J. Goetz, W.S. Walker, N.T. Laporte, M. Sun, D. Sulla-Menashe, J. Hackler, P.S.A. Beck, R. Dubayah, M.A. Friedl, S. Samanta, and R.A. Houghton. 2012. Estimated carbon dioxide emissions from tropical deforestation improved by carbon-density maps. Nature Climate Change 2:182–185. https://doi.org/10.1038/nclimate1354
Baccini, A., W. Walker, L. Carvalho, M. Farina, D. Sulla-Menashe, and R.A. Houghton. 2017. Tropical forests are a net carbon source based on aboveground measurements of gain and loss. Science 358:230–234. https://doi.org/10.1126/science.aam5962
Walker, W.S., S.R. Gorelik, A. Baccini, J.L. Aragon-Osejo, C. Josse, C. Meyer, M.N. Macedo, C. Augusto, S. Rios, T. Katan, A.A. de Souza, S. Cuellar, A. Llanos, I. Zager, G.D. Mirabal, K.K. Solvik, M.K. Farina, P. Moutinho, and S. Schwartzman. 2020. The role of forest conversion, degradation, and disturbance in the carbon dynamics of Amazon indigenous territories and protected areas. Proceedings of the National Academy of Sciences 117:3015–3025. https://doi.org/10.1073/pnas.1913321117
Acknowledgments
This work was supported by NASA's Carbon Monitoring System (grants NNX14AO81G and NNX16AP24G) and the Norwegian Government’s International Climate and Forest Initiative (grant RAM-2019 RAM-16/0003).
Data Characteristics
Spatial Coverage: Mexico, Amazon Basin, Pantropics
Spatial Resolution: ~500 m (463.31 m; 21.47 ha)
Temporal Coverage: 2003 through 2016
Temporal Resolution: Annual
Study Area: Latitude and longitude are given in decimal degrees.
| Site | Northernmost Latitude | Southernmost Latitude | Easternmost Longitude | Westernmost Longitude |
|---|---|---|---|---|
| Amazon Basin | 10.05833 | -18.16249722 | -44.2678833 | -83.3222611 |
| Mexico | 32.7167 | 14.533 | -83.41496389 | -129.46895278 |
| Pantropical Belt | 40 | -29.99999722 | 180 | -180 |
Data File Information
There are 6 files in GeoTIFF (*.tif) format included in this dataset. The files are named site_variable_time.tif, where
- site is Amazon, Mexico, or Pantropical,
- variable is AGB_Base or AGB_Change, and
- time is 2003 or 2003_2016.
Table 1. File names and descriptions.
| File Names | Units | Description |
|---|---|---|
| Amazon_AGB_Base_2003.tif | Mg/ha |
A single-band raster in which grid cell values represent aboveground live dry woody biomass density in megagrams per hectare for the baseline year 2003 spanning the biogeographical limit of the Amazon Basin. |
| Amazon_AGB_Change_2003_2016.tif | Mg/ha | A 13-band raster in which grid cell values represent aboveground live dry woody biomass density change in megagrams per hectare for the 2003-2016 time period (i.e., band 1 = change from 2003 to 2004 and band 13 = change from 2015 to 2016) spanning the biogeographical limit of the Amazon Basin. The "no data" value is represented by -32768. Only pixels where the change (i.e., gain or loss) was determined to be statistically significant at the 95% level (p-value ≤ 5) are reported as non-zero values. Pixels with statistically insignificant change or no change detected have a value of zero. |
| Mexico_AGB_Base_2003.tif | Mg/ha |
A single-band raster in which grid cell values represent aboveground live dry woody biomass density in megagrams per hectare for the baseline year 2003 spanning the administrative boundary of Mexico. |
| Mexico_AGB_Change_2003_2016.tif | Mg/ha | A 13-band raster in which grid cell values represent aboveground live dry woody biomass density change in megagrams per hectare for the 2003-2016 time period (i.e., band 1 = change from 2003 to 2004 and band 13 = change from 2015 to 2016) spanning the administrative boundary of Mexico. The "no data" value is represented by -32768. Only pixels where the change (i.e., gain or loss) was determined to be statistically significant at the 95% level (p-value ≤ 5) are reported as non-zero values. Pixels with statistically insignificant change or no change detected have a value of zero. |
| Pantropical_AGB_Base_2003.tif | Mg/ha |
A single-band raster in which grid cell values represent aboveground live dry woody biomass density in megagrams per hectare for the baseline year 2003 spanning the Pantropics. |
| Pantropical_AGB_Change_2003_2016.tif | Mg/ha | A 13-band raster in which grid cell values represent aboveground live dry woody biomass density change in megagrams per hectare for the 2003-2016 time period (i.e., band 1 = change from 2003 to 2004 and band 13 = change from 2015 to 2016) spanning the Pantropics. The "no data" value is represented by -32768, but there are no pixels in the file with that value. Only pixels where the change (i.e., gain or loss) was determined to be statistically significant at the 95% level (p-value ≤ 5) are reported as non-zero values. Pixels with statistically insignificant change or no change detected have a value of zero. |
Data File Details
For all files,
- The "no data" value is represented by -32768. See Table 1 for details.
- The spatial reference system used is the native MODIS sinusoidal projection (SR-ORG:6842), PROJ.4: +proj=sinu +lon_0=0 +x_0=0 +y_0=0 +a=6371007.181 +b=6371007.181 +units=m +no_defs
- No masks have been applied to these files. Users can apply a land/water mask of their choosing based on their research needs.
Application and Derivation
The dataset allows for the estimation of losses, gains, and the net change in aboveground carbon density for the period 2003-2016 for the Pantropical Belt (Baccini et al., 2017), with pre-derived subsets available for the country of Mexico and the Amazon Basin (Walker et al., 2020).
Quality Assessment
The change-point algorithm used to identify temporal trajectories at the pixel level (Baccini et al., 2017) provided a fitted estimate of AGB density for each year in the time series (2003-2016). The algorithm also output (1) the p-value (scaled 0-100) from a modified F-test associated with the pixel-level change estimate where p-values ≤ 5 represent a significant change (i.e., gain or loss) in AGB density and values > 5 represent a non-significant change (i.e., no gain or loss/stable) in AGB density; and (2) the standard error associated with the pixel-level change representing uncertainty in the change estimate at the 95% level. The standard error was estimated from an error propagation analysis carried out at the pixel level across all layers in the time series. The propagation of error, which considered geolocation-, allometric-, and model-based errors, fed first into estimates of the standard error associated with the AGB density prediction at each point in the time series understood most readily as the confidence interval (CI) for each pixel-level trajectory. This CI was then used to calculate the standard error of the AGB density change. Only pixels where the change (i.e., gain or loss) was determined to be statistically significant at the 95% level (p-value ≤ 5) were included in the dataset.
Data Acquisition, Materials, and Methods
This dataset of aboveground live dry woody biomass (AGB) stock (2003) and annual change (2003-2016) is based on a multi-step modeling approach. For details, see Baccini et al. (2012), Baccini et al. (2017), and Walker et al. (2020).
First, a statistical relationship was established between field measurements and co-located NASA ICESat Geoscience Laser Altimeter System (GLAS) light detection and ranging (LiDAR) data to yield a pantropical pseudo-inventory of more than 5 million spatially explicit estimates of biomass density at the GLAS footprint (~60 m diameter) scale. The resulting global inventory of GLAS-based AGB estimates was used to calibrate and validate ecoregional models (i.e., separate models were developed for tropical America, Africa, and Asia) based on machine learning techniques relating AGB to a suite of satellite and ancillary spatial predictor variables compiled as wall-to-wall raster mosaics. This suite included 66 NASA Moderate Resolution Imaging Spectroradiometer (MODIS) Collection 6 (MCD43A4 V006) satellite-image derived variables, 67 WorldClim 1.4 climate variables reflecting current (∼1960 to 1990) climatic conditions, and 59 SoilGrids soil variables. The resulting random forest models were then used to generate annual (2003-2016) spatially-explicit snapshots of pantropical (extending from 40°N to 30°S latitude) biomass density at a resolution of ~500 m (463.31 m; 12.47 ha). The year 2003 corresponds to the first year that sufficient MODIS Terra and Aqua sensor data were available to support this large-area mapping effort and the year 2016 reflects the most current year for which data were available at the onset of this project.
The 14-year time series of AGB density estimates were then analyzed at the grid-cell level with a temporal change-point fitting algorithm that identifies temporal trajectories and provides a fitted value of the AGB for each year in the time series. The algorithm works by (1) identifying all possible change points (i.e., vertices separating piecewise linear segments) in the AGB pixel-level time series based on the deviation from a simple linear regression fitting procedure, and determining the optimal segmentation of the time series using a Bayesian formulation and (2) conditional on the segmentation result, determining a best-fit linear trend model for the time series and assessing change over time in AGB using an approximated p-value. Overall, the algorithm seeks to balance noise removal (model fit simplicity) against trajectory detail (model fit complexity), generating a sequence of straight-line segments connecting points that best capture linear trends in AGB. Only pixels exhibiting statistical significance at the 95% level are reported. Finally, to quantify gains (forest biomass accrual) and losses (forest biomass removals or reductions) in AGB through time, a time series of the annual changes in AGB is computed at the grid-cell level from the fitted annual estimates of AGB stock.
From the pantropical time series of AGB stock and change, two regions of interest were extracted: Mexico and the Amazon Basin. The boundary of Mexico was defined using the Database of Global Administrative Areas (GADM) v3.6 and the Amazon Basin was defined by the biogeographical limit of the greater Amazon ecosystem published by Red Amazónica de Información Socioambiental Georreferenciada (RAISG; the Amazon Georeferenced Socio-Environmental Information Network).
Data Access
These data are available through the Oak Ridge National Laboratory (ORNL) Distributed Active Archive Center (DAAC).
Aboveground Biomass Change for Amazon Basin, Mexico, and Pantropical Belt, 2003-2016
Contact for Data Center Access Information:
- E-mail: uso@daac.ornl.gov
- Telephone: +1 (865) 241-3952
References
Baccini, A., S.J. Goetz, W.S. Walker, N.T. Laporte, M. Sun, D. Sulla-Menashe, J. Hackler, P.S.A. Beck, R. Dubayah, M.A. Friedl, S. Samanta, and R.A. Houghton. 2012. Estimated carbon dioxide emissions from tropical deforestation improved by carbon-density maps. Nature Climate Change 2:182–185. https://doi.org/10.1038/nclimate1354
Baccini, A., W. Walker, L. Carvalho, M. Farina, D. Sulla-Menashe, and R.A. Houghton. 2017. Tropical forests are a net carbon source based on aboveground measurements of gain and loss. Science 358:230–234. https://doi.org/10.1126/science.aam5962
Walker, W.S., S.R. Gorelik, A. Baccini, J.L. Aragon-Osejo, C. Josse, C. Meyer, M.N. Macedo, C. Augusto, S. Rios, T. Katan, A.A. de Souza, S. Cuellar, A. Llanos, I. Zager, G.D. Mirabal, K.K. Solvik, M.K. Farina, P. Moutinho, and S. Schwartzman. 2020. The role of forest conversion, degradation, and disturbance in the carbon dynamics of Amazon indigenous territories and protected areas. Proceedings of the National Academy of Sciences 117:3015–3025. https://doi.org/10.1073/pnas.1913321117