Documentation Revision Date: 2021-05-24
Dataset Version: 2
Summary
This dataset is a new national-scale version of the related Southeast U.S. dataset (Gu et al., 2019a) that is described in the publication Gu et al. (2019b). The new version implemented modest improvements to methods where disturbances were attributed to harvest and fire only, and the calculation of stand age for undisturbed forest pixels was slightly modified.
There are 207 data files in GeoTIFF (*.tif) format included in this dataset: 162 files provide derived estimates of forest carbon stocks and fluxes (9 regions x 3 benchmark years x 6 variables) and 45 files provide model input data (9 regions x 5 input data files).
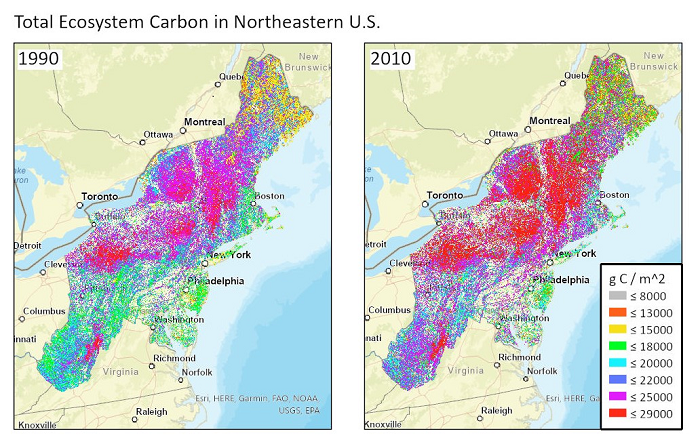
Figure 1. Estimated total ecosystem carbon for the northeast region of the U.S. for the years 1990 (left) and 2010 (right). The estimates were produced from an inventory-constrained version of the Carnegie-Ames-Stanford Approach (CASA) carbon cycle process model. Source: NE_totalc_1990.tif and NE_totalc_2010.tif
Citation
Williams, C.A., N. Hasler, H. Gu, and Y. Zhou. 2020. Forest Carbon Stocks and Fluxes from the NFCMS, Conterminous USA, 1990-2010. ORNL DAAC, Oak Ridge, Tennessee, USA. https://doi.org/10.3334/ORNLDAAC/1829
Table of Contents
- Dataset Overview
- Data Characteristics
- Application and Derivation
- Quality Assessment
- Data Acquisition, Materials, and Methods
- Data Access
- References
- Dataset Revisions
Dataset Overview
This dataset, derived from the National Forest Carbon Monitoring System (NFCMS), provides estimates of forest carbon stocks and fluxes in the form of aboveground woody biomass (AGB), total live biomass, total ecosystem carbon, aboveground coarse woody debris (CWD), and net ecosystem productivity (NEP) as a function of the number of years since the most recent disturbance (i.e., stand age) for forests of the conterminous U.S. at a 30 m resolution for the benchmark years 1990, 2000, and 2010. The data were derived from an inventory-constrained version of the Carnegie-Ames-Stanford Approach (CASA) carbon cycle process model that accounts for disturbance processes for each combination of forest type, site productivity, and pre-disturbance biomass. Also provided are the core model data inputs including the year of the most recent disturbance according to the North American Forest Dynamics (NAFD) and the Monitoring Trends in Burn Severity (MTBS) data products; the type of disturbance; biomass estimates from the year 2000 according to the National Biomass and Carbon Dataset (NBCD); forest-type group; a site productivity classification; and the number of years since stand-replacing disturbance. The data are useful for a wide range of applications including monitoring and reporting recent dynamics of forest carbon across the conterminous U.S., assessment of recent trends with attribution to disturbance and regrowth drivers, conservation planning, and assessment of climate change mitigation opportunities within the forest sector.
This dataset is a new national-scale version of the related Southeast U.S. dataset (Gu et al., 2019a) that is described in the publication Gu et al. (2019b). The new version implemented modest improvements to methods where disturbances were attributed to harvest and fire only, and the calculation of stand age for undisturbed forest pixels was slightly modified.
Project: Carbon Monitoring System
The NASA Carbon Monitoring System (CMS) is designed to make significant contributions in characterizing, quantifying, understanding, and predicting the evolution of global carbon sources and sinks through improved monitoring of carbon stocks and fluxes. The System will use the full range of NASA satellite observations and modeling/analysis capabilities to establish the accuracy, quantitative uncertainties, and utility of products for supporting national and international policy, regulatory, and management activities. CMS will maintain a global emphasis while providing finer scale regional information, utilizing space-based and surface-based data and will rapidly initiate generation and distribution of products both for user evaluation and to inform near-term policy development and planning.
Related Publication
Gu, H., C.A. Williams, N. Hasler, and Y. Zhou. 2019b. The Carbon Balance of the Southeastern U.S. Forest Sector as Driven by Recent Disturbance Trends. Journal of Geophysical Research: Biogeosciences 124:2786–2803. https://doi.org/10.1029/2018JG004841
Zhou, Y., C.A. Williams, N. Hasler, H. Gu, and R.E. Kennedy. 2021. Beyond biomass to carbon fluxes: application and evaluation of a comprehensive Forest Carbon Monitoring System. Environmental Research Letters. https://iopscience.iop.org/article/10.1088/1748-9326/abf06d/meta
Related Dataset
Gu, H., C.A. Williams, N. Hasler, and Y. Zhou. 2019a. Forest Carbon Stocks and Fluxes After Disturbance, Southeastern USA, 1990-2010. ORNL DAAC, Oak Ridge, Tennessee, USA. https://doi.org/10.3334/ORNLDAAC/1728
Acknowledgments
This research was funded under the NASA Carbon Monitoring System Program (solicitations NNH14ZDA001N Element A.7 and NNH15ZDA001N-CMS) under NASA Award numbers NNX14AR39G and NNX16AQ25G.
Data Characteristics
Spatial Coverage: Conterminous U.S. divided into nine regions
Spatial Resolution: 30 m
Temporal Coverage: 1986-01-01 to 2010-12-31 (this period covers the input data)
Temporal Resolution: Annual data for the selected years of 1990, 2000, and 2010
Study Area: Latitude and longitude are given in decimal degrees.
| Sites | Westernmost Longitude | Easternmost Longitude | Northernmost Latitude | Southernmost Latitude |
|---|---|---|---|---|
| Entire dataset | -127.6857 | -65.73072 | 50.36599 | 23.18733 |
| Northeast | -84.4559 | -65.73072 | 49.84164 | 35.21403 |
| Northern Lake States | -97.40542 | -80.4586 | 50.05792 | 40.95718 |
| Northern Prairie States | -105.80143 | -77.4041 | 49.51222 | 35.00445 |
| Pacific Northwest | -127.6857 | -65.73072 | 50.15652 | 35.21403 |
| Pacific Southwest | -125.139683 | -65.73072 | 49.84164 | 31.14671 |
| Rocky Mountain North | -103.242247 | -84.45585 | 50.36599 | 35.21403 |
| Rocky Mountain South | -124.643088 | -65.73072 | 49.84164 | 28.99353 |
| South Central | -108.62768 | -65.73072 | 49.84164 | 24.84884 |
| Southeast | -89.01881 | -65.73072 | 49.84164 | 23.18733 |
Data File Information
There are 207 data files in GeoTIFF (*.tif) format included in this dataset: 162 files provide derived estimates of forest carbon stocks and fluxes (9 regions x 3 benchmark years x 6 variables) and 45 files provide model input data (9 regions x 5 input data files).
Table 1. File names and descriptions.
| File Name | Units | No Data Value | Description |
|---|---|---|---|
| Derived Data Products | |||
| region_abovewood_YYYY.tif | g C m-2 | 65535 | Aboveground biomass of wood (AGB) in grams of carbon per square meter in a region for years YYYY (i.e. 1990, 2000, 2010). |
| region_age_YYYY.tif | years | 65535 | Number of years since the most recent disturbance in a region relative to year YYYY (i.e. forest stand age in years 1990, 2000, 2010). |
| region_cwd_YYYY.tif | g C m-2 | 65535 | Aboveground coarse woody debris (CWD) in grams of carbon per square meter in a region for year YYYY (i.e. 1990, 2000, 2010). |
| region_livebio_YYYY.tif | g C m-2 | 65535 | Total ecosystem live biomass (including leaves and roots) in grams of carbon per square meter in a region for year YYYY (i.e. 1990, 2000, 2010). |
| region_nep_YYYY.tif | g C m-2 y-1 | -32768 | Net ecosystem productivity (NEP) in grams of carbon per square meter per year in a region for year YYYY (i.e. 1990, 2000, 2010). |
| region_totalc_YYYY.tif | g C m-2 | 4294967295 | Total ecosystem carbon (including debris and soil carbon) in grams of carbon per square meter in a region for year YYYY (i.e., 1990, 2000, 2010). |
| Input Data Products | |||
| region_Biomass.tif | 10 kg C m-2 | 65535 | Aboveground dry biomass in kilograms of carbon per square meter*10 according to the National Biomass and Carbon Dataset (NBCD). For example, a value of 6 means 6*(10 kg m-2)=60 kg m-2. |
| region_DisturbanceType.tif | 0,11–13 | 65535 | Category of disturbance (for the year 1986) according to the North American Forest Dynamics (NAFD) and the Monitoring Trends in Burn Severity (MTBS) composite. See Table 3. |
| region_DisturbanceYear.tif | 3,16–40 | 255 | Year of disturbance according to the North American Forest Dynamics (NAFD) and the Monitoring Trends in Burn Severity (MTBS) composite. See Table 4. |
| region_ForestProductivity.tif | percent | 127 | Percent, on a scale of 0–10, of high productivity forest according to the Forest Inventory and Analysis (FIA) data. See Table 5. |
| region_ForestType.tif | category | 65535 | Forest-type group category (for the year 2004) as defined in Ruefenacht (2008) resampled onto the NAFD forest map. See Table 6. |
Data File Details
The SRS is Albers Conic Equal Area projection and North American Datum 1983, EPSG:42303.
Table 2. The nine region codes and states.
| Region | Abbreviation | States |
|---|---|---|
| Northeast | NE | Connecticut, Delaware, Maine, Maryland, Massachusetts, New Hampshire, New Jersey, New York, Pennsylvania, Rhode Island, Vermont, West Virginia |
| Northern Lake States | NLS | Michigan, Minnesota, Wisconsin |
| Northern Prairie States | NPS | Illinois, Indiana, Iowa, Kansas, Missouri, Nebraska, North Dakota, Ohio, South Dakota |
| Pacific Northwest | PNW | Oregon, Washington |
| Pacific Southwest | PSW | California |
| Rocky Mountain North | RMN | Idaho, Montana |
| Rocky Mountain South | RMS | Arizona, Colorado, Nevada, New Mexico, Utah, Wyoming |
| South Central | SC | Alabama, Arkansas, Kentucky, Louisiana, Mississippi, Oklahoma, Tennessee, Texas |
| Southeast | SE | Florida, Georgia, North Carolina, South Carolina, Virginia |
Table 3. Disturbance type categories.
| Category | Disturbance Type |
|---|---|
| 0 | Harvest |
| 11 | Low-Intensity Fire |
| 12 | Medium-Intensity Fire |
| 13 | High-Intensity Fire |
Table 4. Year of disturbance code.
| Code | Description |
|---|---|
| 3 | Persistent forest (i.e., no known disturbance in the period 1986–2010) |
| 16–40 | 1970 plus the code provides the year of disturbance |
Table 5. Forest-type productivity categories that provide the percentage of high productivity forest (ranging from 0–10).
| Categories | Example |
|---|---|
| 0–4 | Values of 0 have 0% high productivity (100% low productivity) |
| 5 | Values of 5 have 50% high productivity (50% low productivity) |
| 6–10 | Values of 10 have 100% high productivity forests (0% low productivity) |
Table 6. Forest-type categories and associated regions derived for the year 2004.
| Category | Forest Type | Regions |
|---|---|---|
| 100 | White/Red/Jack Pine | NE, NLS, NPS, SC, SE |
| 120 | Spruce/Fir | NE, NLS, NPS, RMN, RMS, SE |
| 140 | Longleaf/Slash Pine | SC, SE |
| 160 | Loblolly/Shortleaf Pine | NE, NPS, SC, SE |
| 180 | Pinyon/Juniper | all regions |
| 200 | Douglas-fir | NE, NPS, PNW, PSW, RMS, RMS |
| 220 | Ponderosa Pine | NLS, NPS, PNW, PSW, RMN, RMS, SC |
| 240 | Western White Pine | PNW, PSW, RMS, RMS |
| 260 | Fir/Spruce/Mountain Hemlock | PNW, PSW, RMS, RMS, SC |
| 280 | Lodgepole Pine | NPS, PNW, PSW, RMS, RMS |
| 300 | Hemlock/Sitka Spruce | PNW, PSW, RMN |
| 320 | Western Larch | PNW, RMN |
| 340 | Redwood | PSW |
| 360 | Other Western Softwoods | PNW, PSW, RMN, RMS |
| 370 | California Mixed Conifer | PNW, PSW, RMN, RMS |
| 380 | Exotic Softwoods | NE, NLS, NPS |
| 400 | Oak/Pine | NE, NLS, NPS, RMS, SC, SE |
| 500 | Oak/Hickory | NE, NLS, NPS, RMN, RMS, SC, SE |
| 600 | Oak/Gum/Cypress | NE, NLS, NPS, SC, SE |
| 700 | Elm/Ash/Cottonwood | NE, NLS, NPS, PNW, RMN, RMS, SC, SE |
| 800 | Maple/Beech/Birch | NE, NLS, NPS, RMS, SC, SE |
| 900 | Aspen/Birch | NE, NLS, NPS, PNW, PSW, RMS, RMS, SC |
| 910 | Alder/Maple | PNW, PSW |
| 920 | Western Oak | PNW, PSW, RMN, RMS, SC |
| 940 | Tanoak/Laurel | PNW, PSW |
| 950 | Other Western Hardwood | PNW, PSW, RMN, RMS, SC |
| 980 | Tropical Hardwoods | SE |
| 990 | Exotic Hardwoods | NPS, PSW, SC, SE |
Application and Derivation
Fine-scale, accurate mapping of forest disturbances, forest carbon stocks, and forest carbon uptake or release is critical for forest resource assessments. The geospatially and temporally rich data provided here are useful for a wide range of applications including monitoring and reporting recent dynamics of forest carbon across the conterminous U.S., assessment of recent trends with attribution to disturbance and regrowth drivers, conservation planning, and assessment of climate change mitigation opportunities within the forest sector.
Quality Assessment
The methods used to generate this dataset allowed the authors to define a within-method random error to assess uncertainty at the pixel scale. This pixel-scale uncertainty does not translate to uncertainty at larger scales. It would be incorrect to assume that pixel-scale errors are fully additive because the spread in estimates is derived from region-wide samples whose largely random errors cancel out when aggregating to the regional level. Incorrectly assuming additive errors would significantly overestimate regional-scale uncertainty. See Gu et al. (2019) for more information.
Data Acquisition, Materials, and Methods
This dataset is a new national-scale version of the Southeast U.S. dataset (Gu et al., 2019a) as described in the related publication (Gu et al., 2019b). This version implemented modest improvements to methods where disturbances were attributed to harvest and fire only and the calculation of stand age for undisturbed forest pixels was slightly modified.
Three major steps were involved in deriving the estimates and maps:
- Determination of attributes for all forested pixels across the conterminous U.S. based primarily on the following attributes: forest type, disturbance type, year of the most recent forest disturbance (i.e., stand age), and site productivity. Disturbances were attributed to harvest and fire only.
- Defining forest carbon stocks and fluxes for each unique combination of attributes based on a forest carbon cycle model, constrained by Forest Inventory and Analysis Program (FIA; https://www.fia.fs.fed.us/tools-data/index.php) data specific to each of the nine regions.
- Assignment of forest carbon stocks and fluxes for each pixel’s combination of site-level attributes: aboveground biomass (AGB), aboveground coarse woody debris (CWD), ecosystem live biomass, and net ecosystem productivity (NEP).
These methods yield maps of forest carbon stocks and fluxes at a 30 m resolution with annual reporting of forest carbon dynamics for all nine regions of the conterminous U.S. for the period 1986–2010.
Forest Disturbance
For each pixel, the year of the most recent forest disturbance (1986–2010) and the type of disturbance were determined from the North American Forest Dynamics (NAFD; Goward et al., 2015, Zhao et al., 2018) and the Monitoring Trends in Burn Severity (MTBS; Eidenshink et al., 2007) satellite-derived data products. If a pixel did not experience a stand-clearing disturbance, the year of the most recent disturbance was inferred from satellite-derived biomass (compiled in 2000) available from the National Biomass and Carbon Dataset (NBCD; Kellndorfer et al., 2013), biomass accumulation curves derived from the FIA, and site productivity. Next, the number of years since the most recent disturbance was iterated back in time for each year of the 25-year time series, and the mean stand age for each pixel was inferred from the pre-disturbance biomass. Pre-disturbance biomass was estimated from the biomass of undisturbed pixels for a given forest type averaged over a local grid of 1 km, or 10 km if the forest type was undefined at the 1 km scale. For more information, see Gu et al. (2019b).
Annual Carbon Stocks and Fluxes
Carbon flux and carbon stock trajectories were estimated from an inventory-constrained version of the Carnegie-Ames-Stanford Approach (CASA) carbon cycle process model that accounts for disturbance processes. The model applied a light-use efficiency approach to estimate net primary productivity (NPP), and model parameters were adjusted uniquely for each combination of forest type group and site productivity class. For each combination of forest-type group, site-productivity class, and pre-disturbance biomass, the model simulated NPP, NEP, AGB, live biomass, and total ecosystem carbon as a function of the number of years since the most recent disturbance. The distribution of NEP, AGB, live biomass, total ecosystem carbon, and the number of years since the most recent disturbance (i.e., stand age) was mapped for the years 1990, 2000, and 2010.
Data Access
These data are available through the Oak Ridge National Laboratory (ORNL) Distributed Active Archive Center (DAAC).
Forest Carbon Stocks and Fluxes from the NFCMS, Conterminous USA, 1990-2010
Contact for Data Center Access Information:
- E-mail: uso@daac.ornl.gov
- Telephone: +1 (865) 241-3952
References
Eidenshink, J., B. Schwind, K. Brewer, Z.-L. Zhu, B. Quayle, and S. Howard. 2007. A Project for Monitoring Trends in Burn Severity. Fire Ecology 3:3–21. https://doi.org/10.4996/fireecology.0301003 (Also see Monitoring Trends in Burn Severity, https://www.mtbs.gov/.)
Goward, S.N., C. Huang, F. Zhao, K. Schleeweis, K. Rishmawi, M. Lindsey, J.L. Dungan, and A. Michaelis. 2015. NACP NAFD Project: Forest Disturbance History from Landsat, 1986-2010. ORNL DAAC, Oak Ridge, Tennessee, USA. https://doi.org/10.3334/ORNLDAAC/1290
Gu, H., C.A. Williams, N. Hasler, and Y. Zhou. 2019a. Forest Carbon Stocks and Fluxes After Disturbance, Southeastern USA, 1990-2010. ORNL DAAC, Oak Ridge, Tennessee, USA. https://doi.org/10.3334/ORNLDAAC/1728
Gu, H., C.A. Williams, N. Hasler, and Y. Zhou. 2019b. The Carbon Balance of the Southeastern U.S. Forest Sector as Driven by Recent Disturbance Trends. Journal of Geophysical Research: Biogeosciences 124:2786–2803. https://doi.org/10.1029/2018JG004841
Gu, H., C.A. Williams, B. Ghimire, F. Zhao, and C. Huang. 2016. High-resolution mapping of time since disturbance and forest carbon flux from remote sensing and inventory data to assess harvest, fire, and beetle disturbance legacies in the Pacific Northwest. Biogeosciences 13:6321–6337. https://doi.org/10.5194/bg-13-6321-2016
Kellndorfer, J., W. Walker, K. Kirsch, G. Fiske, J. Bishop, L. Lapoint, M. Hoppus, and J. Westfall. 2013. NACP Aboveground Biomass and Carbon Baseline Data, V.2 (NBCD 2000), U.S.A., 2000. ORNL DAAC, Oak Ridge, Tennessee, USA. https://doi.org/10.3334/ORNLDAAC/1161
Ruefenacht, B., M.V. Finco, M.D. Nelson, R. Czaplewski, E.H. Helmer, J.A. Blackard, G.R. Holden, A.J. Lister, D. Salajanu, D. Weyermann, and K. Winterberger. 2008. Conterminous U.S. and Alaska Forest Type Mapping Using Forest Inventory and Analysis Data. Photogrammetric Engineering & Remote Sensing 74:1379–1388. https://doi.org/10.14358/PERS.74.11.1379
Zhao, F., C. Huang, S.N. Goward, K. Schleeweis, K. Rishmawi, M.A. Lindsey, E. Denning, L. Keddell, W.B. Cohen, Z. Yang, J.L. Dungan, and A. Michaelis. 2018. Development of Landsat-based annual US forest disturbance history maps (1986–2010) in support of the North American Carbon Program (NACP). Remote Sensing of Environment 209:312–326. https://doi.org/10.1016/j.rse.2018.02.035
Zhou, Y., C.A. Williams, N. Hasler, H. Gu, and R.E. Kennedy. 2021. Beyond biomass to carbon fluxes: application and evaluation of a comprehensive Forest Carbon Monitoring System. Environmental Research Letters. https://iopscience.iop.org/article/10.1088/1748-9326/abf06d/meta
Dataset Revisions
| Version | Release Date | Revision Notes |
|---|---|---|
| 2.0 | 2021-05-18 | This dataset is a new national scale version of the previously archived Southeast USA dataset. The new version implemented modest improvements to methods where disturbances were attributed to harvest and fire only and the calculation of stand age for undisturbed forest pixels was slightly modified as described in Section 5 of this document. |
| 1.1 | 2020-07-20 | The data files were revised to use EPSG:42303 (NAD83 / Albers NorthAm) except for biomass_NBCD.tif which uses EPSG:5070 (NAD83 / Conus Albers). |
| 1.0 | 2019-09-12 | Initial data release for forest carbon stocks and fluxes after disturbance in Southeastern USA, 1990-2010 |