Documentation Revision Date: 2019-12-06
Dataset Version: 2
Summary
User note: These data were derived using the MODIS product MOD10A2 Version 6. The previous version used MODIS collection 5 data. Refer to Section 4 and the Data Revisions Section at the end of this document for additional details.
There are 39 data files with this data set in GeoTIFF (.tif) format for the period 2001 to 2018. This includes 36 yearly files of snowmelt timing and cloud interference data (18 files each), two files of means for all years combined, and one file with the count of snowmelt timing values (the number of years on record in the STMs from 2001-2018).

Figure 1. Mean snowmelt Day of Year (DOY) for the years 2001-2018 for North America. The DOY values for snowmelt timing were identified by observing the transition from snow-cover to no-snow for individual MODIS pixels throughout the annual melt period. Note: the projection of this image may not be the native projection of the data set.
Citation
O'Leary III, D., D.K. Hall, M. Medler, R. Matthews, and A. Flower. 2019. Snowmelt Timing Maps Derived from MODIS for North America, Version 2, 2001-2018. ORNL DAAC, Oak Ridge, Tennessee, USA. https://doi.org/10.3334/ORNLDAAC/1712
Table of Contents
- Dataset Overview
- Data Characteristics
- Application and Derivation
- Quality Assessment
- Data Acquisition, Materials, and Methods
- Data Access
- References
- Dataset Revisions
Dataset Overview
This data set provides snowmelt timing maps (STMs), cloud interference maps, and a map with the count of calculated snowmelt timing values for North America. The STMs are based on the Moderate Resolution Imaging Spectroradiometer (MODIS) standard 8-day composite snow-cover product MOD10A2 for the period 2001-01-01 to 2018-12-31. The STMs were created by conducting a time-series analysis of the MOD10A2 snow maps to identify the DOY of snowmelt on a per-pixel basis. Snowmelt timing (no-snow) was defined as a snow-free reading following two consecutive snow-present readings for a given 500-m pixel. The count of STM values is also reported, which represents the number of years on record in the STMs from 2001-2018.
Related Publications:
O’Leary, D.S., D. Hall, M. Medler, and A. Flower. Quantifying the Early Snowmelt Event of 2015 in the Cascade Mountains, USA by Developing and Validating MODIS-Based Snowmelt Timing Maps. Front. Earth Sci. (2018) 12: 693. https://doi.org/10.1007/s11707-018-0719-7
O’Leary, D.S., L. Kellermann, and C. Wayne. 2017. Snowmelt Timing, Phenology, and Growing Season Length in Conifer Forests of Crater Lake National Park, USA. International Journal of Biometeorology 62 (2). https://doi.org/ 10.1007/s00484-017-1449-3
Related Dataset: This related dataset, Version 1, was derived from MODIS collection 5 data. It is superseded by the current, Version 2, data, which are based on MODIS collection 6 data.
O'Leary III, D., D.K. Hall, M. Medler, R. Matthews, and A. Flower. 2017. Snowmelt Timing Maps Derived from MODIS for North America, 2001-2015. ORNL DAAC, Oak Ridge, Tennessee, USA. https://doi.org/10.3334/ORNLDAAC/1504
Acknowledgement:
This project was supported through the National Park Service and National Science Foundation.
Data Characteristics
Spatial Coverage: North America
Spatial Resolution: 500 m
Temporal Resolution: Annual
Temporal Coverage: 2001-01-01 to 2018-12-31. For the annual Geotiff files, the snowmelt period is defined as January 1 - September 9 of each year. Any snow-off events after September 9 are not captured.
Study Area (All latitude and longitude given in decimal degrees)
| Site | Westernmost Longitude | Easternmost Longitude | Northernmost Latitude | Southernmost Latitude |
|---|---|---|---|---|
| North America | -180 | 0 | 90 | 10 |
Data File Information
There are 39 data files with this data set in GeoTIFF (.tif) format for the period 2001 to 2018.
- 36 annual files of snowmelt timing and cloud interference data (18 files each)
- 2 files with mean snowmelt timing and cloud interference data per pixel for all years combined
- 1 file with the count of snowmelt timing values (the number of years on record in the STMs from 2001-2018)
Table 1. Data file names and descriptions
| File name | Data Units | Description |
|---|---|---|
| Snowmelt_Timing_North_America_XXXX_V2.tif | Day of year (DOY) in Julian days |
Eighteen files of snowmelt timing data, one file per year, where XXXX is the 4-digit year (2001 to 2018). Snowmelt timing was defined as a snow-free reading following two consecutive snow-present readings for a given pixel. The DOY reported for snowmelt is the first day in the 8-day composite image with no snow. All DOY values described are for the first day of the composite image. For instances where clouds interfere with this transition (e.g. a series of pixel readings such as snow, cloud, no-snow) the snowmelt DOY is given as the interpolated DOY between the first cloud reading (in the event of multiple cloud readings) and the first no-snow reading. See the explanation below related to cloud interference |
| Cloud_Interference_North_America_XXXX_V2.tif | Number of cloud-obscured scenes between snow and no-snow readings + 1 |
Eighteen files of cloud interference values from 2001-2018, one file per year, where XXXX is the 4-digit year (2001 to 2018). When there was cloud interference, the snowmelt DOY was interpolated. For example, if the MODIS snow-cover product MOD10A2 image for DOY 105 is snow, and 8 days later on DOY 113 and 121 are cloud, and again, 8 days later DOY 129 is no-snow, the resulting snowmelt DOY would be 121 (interpolating from 113 to 129) and the resulting Cloud Interference value is 2 cloud-obscured images +1 = 3 |
| Snowmelt_Timing_North_America_Mean_2001_2018_V2.tif | Day of year (DOY) in Julian days | One file with mean snowmelt timing data of all years combined. For locations with missing data values (i.e. Count < 18) the mean was calculated using only the available data |
| Cloud_Interference_North_America_Mean_2001_2018_V2.tif | Number of cloud-obscured scenes between snow and no-snow readings + 1 | One file with mean cloud interference data for all years combined. For locations with missing data values (i.e. Count < 18) the mean was calculated using only the available data |
| Snowmelt_Timing_North_America_Count_Values_2001_2018_V2.tif | Number of years on record where snowmelt values existed | One file for the count of snowmelts calculated identifying the number of years on record where the number of snowmelts had a value (i.e., snow was present at some point that year, and snowmelt timing was successfully calculated) |
GeoTIFF Properties
Note: The data are provided in the MODIS native 'Custom Sinusoidal' projection that is defined by the following:
“proj.4” string: +proj=sinu +lon_0=0 +x_0=0 +y_0=0 +a=6371007.181 +b=6371007.181 +units=m +no_defs”.
Table 2. Properties of the GeoTIFFs
| File name | Data type | File units | Fill value | Range of values |
|---|---|---|---|---|
| Snowmelt_Timing_North_America_XXXX_V2.tif | byte | meters | 255 | 1-249 |
| Cloud_Interference_North_America_XXXX_V2.tif | byte | meters | 255 | 1-5 |
| Snowmelt_Timing_North_America_Mean_2001_2018_V2.tif | float32 | meters | 255 | 1-249 |
| Cloud_Interference_North_America_Mean_2001_2018_V2.tif | float32 | meters | 255 | 1-5 |
| Snowmelt_Timing_North_America_Count_Values_2001_2018_V2.tif | float32 | meters | 255 | 1-18 |
Application and Derivation
These data may be of interest to researchers investigating questions of phenology, hydrology, climatology, land management, recreation, and other areas.
Quality Assessment
Validation
The STMs in Version 1 (O'Leary III, et al., 2017) were developed from the standard snow maps MOD10A2 Collection 5 and validated using in-situ observations and were compared with SNOTEL meteorological stations from across the western United States (NRCS, 2016). There was a high-level of agreement between the STMs and SNOTEL stations (n=854). For a detailed explanation, please see O’Leary et al. (2018) in ‘Related Publications’ or contact Donal O’Leary directly. This version (V2) was developed from MOD10A2 Collection 6 and often has slightly different snowmelt timing dates for years 2001-2015 when compared with the V1 STMs due to the changes in production methods for MODIS collection 6.
There are numerous limitations involved in the application of our STMs. Of primary concern is the 8-day resolution of this product. While the MOD10A2 does improve upon the MOD10A1 daily product in terms of cloud-free data, it is still limited by some cloud cover, its 8-day resolution, and inherent snow reporting biases. This 8-day resolution differs from the daily or hourly resolution available using meteorological stations (SNOTEL).
Data Acquisition, Materials, and Methods
MODIS Data
The STMs (V2) were developed using a time-series analysis of the MOD10A2 Version 6 data product, which is a MODIS-derived 8-day composite snow-cover data product from the Terra satellite, developed by NASA and archived and distributed by the National Snow and Ice Data Center (Hall et al., 2006). The MOD10A2 8-day composite product represents the maximum snow cover, per pixel, from DOY 001 to DOY 361 by 8-day intervals, at a 500-m spatial resolution. This product is derived from a Normalized Difference Snow Index (NDSI) using a 50% Snow Covered Area (SCA) as the snow/no-snow classification threshold. Also defined are water, land, ice, or cloud for a given 8-day composite.
The MOD10A2 data product begins Year 2000, DOY 057. Each snowmelt timing detection begins on DOY 001 and continues through the MOD10A2 image for DOY 249 (September 6) for years 2001-2018. These dates are configured for the Northern Hemisphere where DOY 001 will often already have snow present in seasonal snow zones, with snow melting through spring and into September. If snow is not present on DOY 001, subsequent snow events, defined by two consecutive MOD10A2 snow-covered pixels, are detected and their melt is recorded appropriately.
Snowmelt Timing
Snowmelt timing was defined as a snow-free reading following two consecutive snow-present readings for a given pixel. The DOY reported for snowmelt is the first day in the 8-day composite image with no snow. All DOY values described are for the first day of the composite image.
For instances where clouds interfere with this transition (e.g. a series of pixel readings such as snow, cloud, no-snow) the snowmelt DOY is given as the interpolated DOY between the first cloud reading (in the event of multiple cloud readings) and the first no-snow reading. Cloud interference values are the number of cloud-obscured scenes between snow and no-snow readings +1. For example, if the MOD10A2 image for DOY 105 is snow, DOY 113 and 121 are cloud, and DOY 129 is no-snow, the resulting snowmelt DOY would be 121 (interpolating from 113 to 129) and the resulting Cloud Interference value is 2 cloud-obscured images +1 = 3.
Pixels with more than four consecutive cloud-obscured images (32 days) between snow and no snow were omitted due to lack of confidence in the interpolated DOY. Other data exclusions included late-season ephemeral snow events as they were not the main snowpack melt, and snow events with fewer than two consecutive positive snow readings (or one snow followed by one cloud) preceding the no-snow reading.
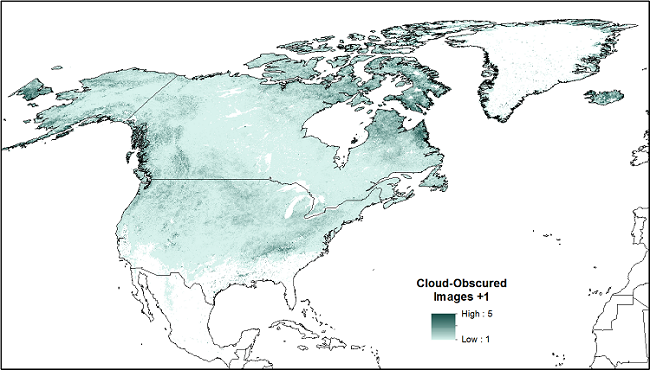
Figure 2. Mean cloud cover interference map showing values per pixel from 2001-2018. Note that mean cloud interference values disregard null values (years without STM values) and may therefore overestimate mean cloud interference for regions with low count values. White areas have no snow observations for the period of record (image provided by Donal S. O’Leary III).
The Count of STM values - values representing the number of years on record in the STMs from 2001-2018 - were also calculated (i.e., snow was present at some point that year, and snowmelt timing was successfully calculated. Note that the projection of this image may not be in the same projection native to the data set).
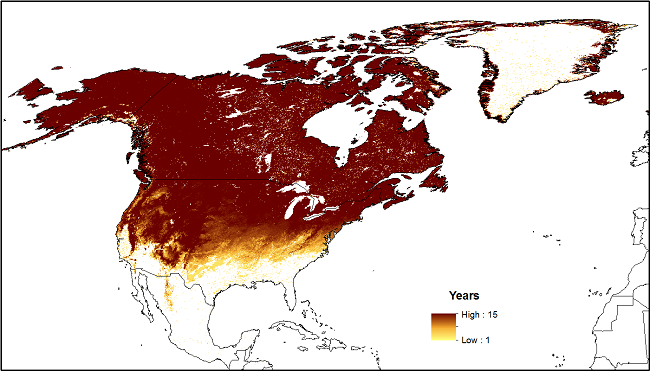
Figure 3. Count of STM values representing the number of years on record in the STMs from 2001-2018 (image provided by Donal S. O’Leary III. The projection of this image may not be in the same projection native to the data set).
Map Development
Snowmelt timing was calculated using custom python scripts controlling ArcMap 10.3. The SMT analysis was conducted in the data’s native custom sinusoidal projection, creating the annual snowmelt timing maps.
Data Access
These data are available through the Oak Ridge National Laboratory (ORNL) Distributed Active Archive Center (DAAC).
Snowmelt Timing Maps Derived from MODIS for North America, Version 2, 2001-2018
Contact for Data Center Access Information:
- E-mail: uso@daac.ornl.gov
- Telephone: +1 (865) 241-3952
References
Hall, Dorothy K., George A. Riggs, and Vincent V. Salomonson. 2006, updated weekly. MODIS/Terra Snow Cover 8-day L3 Global 500m Grid V005, [2001-01-01 to 2015-09-06]. Boulder, Colorado USA: National Snow and Ice Data Center. Digital media.
Natural Resources Conservation Service (NRCS) National Water and Climate Center. 2016. SNOTEL Data & Products. Available from: http://www.wcc.nrcs.usda.gov/snow/ (Accessed 3 September 2016).
O’Leary III, D., D. Hall, M. Medler, and A. Flower. Quantifying the Early Snowmelt Event of 2015 in the Cascade Mountains, USA by Developing and Validating MODIS-Based Snowmelt Timing Maps. Front. Earth Sci. (2018) 12: 693. https://doi.org/10.1007/s11707-018-0719-7
O’Leary III, D, L. Kellermann, and C. Wayne. 2017. Snowmelt Timing, Phenology, and Growing Season Length in Conifer Forests of Crater Lake National Park, USA. International Journal of Biometeorology 62 (2). https://doi.org/ 10.1007/s00484-017-1449-3
O'Leary III, D., D.K. Hall, M. Medler, R. Matthews, and A. Flower. 2017. Snowmelt Timing Maps Derived from MODIS for North America, 2001-2015. ORNL DAAC, Oak Ridge, Tennessee, USA. https://doi.org/10.3334/ORNLDAAC/1504
Dataset Revisions
| Version | Release Date | Description of Changes |
|---|---|---|
| V2 | December 2019 |
Multiple improvements and extending the period of record to include years 2016-2018. V2 is derived from the MOD10A2 collection 6 data. There are slight differences between MOD10A2 collection 5 and 6 which may lead to anomalies in the reported values of the STMs. Authors suggest that users do not combine versions of the STMs in their analysis. Users should transition completely to V2. |
| V1 | June 2017 | Initial release of snowmelt timing maps based on MOD10A2 collection 5. |