Documentation Revision Date: 2016-03-28
Summary
Data sources included published EPA emission factors, census population statistics, climate databases, environmental habitat inventories, source modeling, and directed surveys. The data represent annual emissions of methane per emission category for each New England county and state for a typical year in the early 1990s.
One text file (comma-separated-value format) is provided. The data represent annual emissions of methane per emission category for each New England county and state for a typical year in the early 1990s.
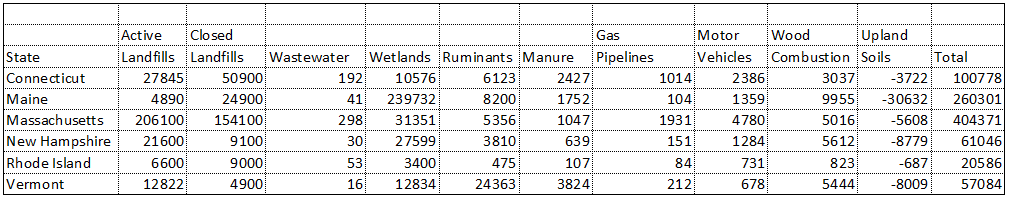
Table 1. Total annual emissions of methane per emission category for each state in New England for a typical year in the early 1990s.
Citation
Blaha, D.M., K.B. Barlett, P.M. Czepil, P.M. Crill, and R.C Harriss. 2016. Natural and Anthropogenic Methane Sources, New England, USA, 1990-1994. ORNL DAAC, Oak Ridge, Tennessee, USA. http://dx.doi.org/10.3334/ORNLDAAC/1311
Table of Contents
- Data Set Overview
- Data Characteristics
- Application and Derivation
- Quality Assessment
- Data Acquisition, Materials, and Methods
- Data Access
- References
Data Set Overview
Investigators: Blaha, D., K. Bartlett, P. Czepiel, R. Harriss, and P. Crill.
This data set contains an inventory of natural and anthropogenic methane emissions for all counties in the six New England states of Connecticut, Rhode Island, Massachusetts, Vermont, New Hampshire, and Maine. The inventory represents a snapshot in time (circa 1990-1994) and provides emission estimates for multiple sources including wetlands, landfills, ruminant animals, residential wood combustion, fossil fuel combustion and use, animal manure, wastewater treatment, and natural gas transmission pipelines. Also included is the uptake or sink of methane in relatively well-drained upland soils.
Data sources included published EPA emission factors, census population statistics, climate databases, environmental habitat inventories, source modeling, and directed surveys. The data represent annual emissions of methane per emission category for each New England county and state for a typical year in the early 1990s.
Acknowledgment(s): This data set was originally published by EOS-WEBSTER, a digital library of Earth Science Data and an Earth Science Information Partner, for the EOS-Earth Data website at the University of New Hampshire, Durham, NH. The source data were provided to EOS-WEBSTER by the Global Atmospheric Chemistry Group, Institute for the Study of Earth, Oceans, and Space, University of New Hampshire (UNH). Several EOS-WEBSTER data products have been transferred to the ORNL DAAC for permanent archival.
Data Characteristics
Spatial Coverage: This data set represents the entire land area of all counties in the six New England states of Connecticut, Rhode Island, Massachusetts, Vermont, New Hampshire, and Maine.
Spatial Resolution: State- and county-level (point). State and county spatial area statistics are not provided.
Temporal Coverage: The data cover the period 1990-01-01 to 1994-12-31.
Temporal Resolution: Single estimate.
Study Area (All latitudes and longitudes are given in decimal degrees.)
|
Site |
Westernmost Longitude |
Easternmost Longitude |
Northernmost Latitude |
Southernmost Latitude |
|
New England |
-73.3671 |
-67.6094 |
46.72708 |
41.22741 |
Data File Information
There is one file in comma-separated-value (*.csv) format: New_England_CH4.csv. The variable values are delimited by commas. All estimates are expressed as metric tons of CH4 per year. Missing numerical values are denoted by -9999 (=no emissions estimate or coordinate value). No emissions estimate means data were not available or the calculated emissions estimate was below one metric ton per year. Missing information (text format) is denoted by nr (not relevant).
Table 1. Data File Variables
|
Column |
Column Heading |
Units/Format |
Description |
|
1 |
FIPS code |
integer |
Federal Information Processing Standard (FIPS 6-4) which uniquely identifies counties and county equivalents in the United States, certain U.S. possessions, and certain freely associated states |
|
2 |
State |
text |
Name of state in which inventory was conducted |
|
3 |
County |
text |
Name of county in which inventory was conducted |
|
4 |
Latitude (centroid) |
decimal degrees |
Latitude centroid for county |
|
5 |
Longitude (centroid) |
decimal degrees |
Longitude centroid for county |
|
6 |
Active landfills |
metric tons of CH4 per year |
Methane emission estimate from the municipal solid waste landfills in operation in 1994 |
|
7 |
Closed landfills |
metric tons of CH4 per year |
Methane emission estimate from inactive landfills that were closed prior to 1992 |
|
8 |
Wastewater |
metric tons of CH4 per year |
Wastewater treatment plant emission estimates derived from a model developed by Czepiel et al. (1993) |
|
9 |
Wetlands |
metric tons of CH4 per year |
Methane emission estimates from natural wetlands calculated as a function of habitat-specific unit area flux, area, and emission season |
|
10 |
Ruminants |
metric tons of CH4 per year |
Ruminant animal emission estimates calculated based on animal populations (primarily dairy cows and replacement heifers) and published emission factors which include differences in age, sex, and type of animal as well as typical diets |
|
11 |
Manure |
metric tons of CH4 per year |
Methane emission estimates from animal manure based on animal population sizes (cattle and cows, swine, chickens and turkeys, horses, sheep and goats), their diets, manure management systems, and local climate |
|
12 |
Gas pipelines |
metric tons of CH4 per year |
Methane emission estimates from pipelines during the transmission of natural gas derived from EPA emission factors in combination with a pipeline atlas of transmission pipelines in the region |
|
13 |
Motor vehicles |
metric tons of CH4 per year |
Methane emission estimates from mobile combustion sources (passenger vehicles, light and heavy trucks, and motorcycles) based on number of registered vehicles, average vehicle miles traveled, and EPA emission factors by vehicle type |
|
14 |
Wood combustion |
metric tons of CH4 per year |
Methane emission estimates from residential heating wood combustion based on census data on household primary and secondary wood heating requirements and EPA emissions factors |
|
15 |
Upland soils |
metric tons of CH4 per year |
Methane uptake or sink from relatively dry upland areas in forests and under agricultural use (cropland, pasture, rangeland, and orchards) |
|
16 |
Total |
metric tons of CH4 per year |
Sum of emission estimates by source minus sink and update from relatively dry uplands |
Application and Derivation
Atmospheric methane is an important greenhouse gas with a high global warming potential. The relative importance of specific methane sources depends on an array of demographic, economic, and ecosystem variables. Identifying these variables and calculating source magnitudes at a sub-national scale is a useful tool for improving U.S. estimates of atmospheric methane emissions and contributes the quantitative data useful to developing mitigation strategies and achieving emissions reductions.
Quality Assessment
The results of the New England methane emission inventory were compared by the investigators to other inventories such as the U.S. Environmental Protection Agency’s state inventories of anthropogenic greenhouse gas emissions. Those inventories use a standardized protocol comparable to that of the national inventories required by the United Nations’ Framework Convention on Climate Change. While the methodology varied, overall, the New England methane emission inventory results compared reasonably well with state-level EPA data available at the time of this study.
While carbon dioxide emission from several sources, notably fossil fuel combustion, can generally be estimated with a relatively high degree of accuracy from commercial transaction statistics, methane emission estimates are more uncertain. Uncertainties stem from two sources: a lack of available, verifiable data on inputs to emissions (as is the case with wood combustion and waste going to landfills) and an imperfect understanding of the many controls that regulate emissions (as in landfills and wetlands). The investigators do not believe that these uncertainties significantly affect the results of this study.
Data Acquisition, Materials, and Methods
The descriptions below are largely from Blaha et al. (1999). Please see this publication for additional information. This data set provides the data that are described in that article.
Site Information
New England is a geocultural region that comprises six states of the northeastern United States: Connecticut, Rhode Island, Massachusetts, Vermont, New Hampshire, and Maine. The region, with its long rolling hills, mountains and jagged coastline, has an area of 71,991.8 sq mi (186,458 km2). At the time of this study, the population of New England was about 13.2 million with Massachusetts being the most populous state and Vermont the least.
New England is a relatively small region. Portions of the area are heavily wooded or agricultural while other areas are relatively densely populated and highly urbanized. The methane inventory considered both natural and anthropogenic sources of emissions. All major sources of methane, with the exception of coal mining and rice agriculture, are present in the region.
Methods
Methane emission estimates were calculated for multiple sources including wetlands, landfills, ruminant animals, residential wood combustion, fossil fuel combustion and use, animal manure, wastewater treatment, and natural gas transmission pipelines. Also included in the inventory is the uptake or sink of methane in relatively well-drained upland soils. Data sources included published EPA emission factors, census population statistics, climate databases, environmental habitat inventories, source modeling, and directed surveys. Detailed information on the methodologies used in this study is available in Blaha et al. (1999). A summary of those methods is presented below.
Wetlands: Methane emission from natural wetlands in the region were calculated as a function of habitat-specific unit area flux, area, and emission season and were calculated on a county scale, the smallest scale available for habitat area characterization. Literature flux values reported from wetlands in the northeastern U.S. were grouped and averaged by the wetland habitat classification types used for the National Wetlands Inventory. Estimates of wetland areas were obtained from the six New England states and emissions were calculated, adjusted by the seasonality of methane release observed by researchers at UNH at a long-term flux measurement site in New Hampshire (Frolking and Crill, 1994; Melloh and Crill, 1996).
Active Landfills: Operational parameters for the largest municipal solid waste landfills in each state were obtained from state environmental agencies and used as inputs to a landfill methane emission model developed at UNH. Ninety-two landfills in New England were surveyed, with a size distribution (in tons per year waste received) from 1,500 (Greenville, ME) to 711,000 (Plainville, MA) metric tons. Emission estimates from landfills with landfill gas recovery systems were modified to reflect the reduction in atmospheric emissions from these sites.
Closed Landfills: Emission estimates were calculated for those landfills in Connecticut and Massachusetts which were closed between 1960 through 1992. These estimates were then used to derive an average per capita emissions rate for these two states that was then extrapolated to the other New England states using census population statistics to obtain an annual emissions estimate for each of the states from inactive landfills that were closed prior to 1992. These state level estimates cannot be apportioned on a county basis.
Ruminant Animals: Ruminant animal emissions were calculated based on animal populations and published emission factors that include differences in age, sex, and type of animal as well as typical diets. Few cattle are raised in New England for beef, and ruminant populations are primarily dairy cows and replacement heifers. Cattle population data from the 1992 Census of Agriculture were used to map populations and emissions to a county basis.
Residential Wood Combustion: Although wood combustion is a relatively minor methane source in the United States, it is of much greater significance in rural states like Maine and Vermont where it provides an average of 15% of residential heating requirements. In New England, roughly 200,000 homes use wood as the primary heat source and an additional 900,000 homes rely on wood for supplemental heating (EIA, 1995). Using emission factors from the U.S. Environmental Protection Agency (EPA, 1993) and residential energy consumption data from the Energy Information Administration (EIA, 1995), an emissions estimates per household unit for both primary and secondary wood combustion was derived and applied to county data on residential wood use.
Motor Vehicles: Department of Motor Vehicle registration records from each state were obtained to estimate the number of passenger vehicles, light and heavy trucks, and motorcycles in each county. Department of Transportation highway statistics were used to calculate the average annual vehicle miles traveled by vehicle type in each of the six New England states (DOT, 1994). Methane emissions were then calculated using emission factors, by vehicle type, from EPA (1993).
Animal Manure: Methane production and release from animal manure is dependent on animal population sizes, their diets, manure management systems, and local climate. Emissions estimates for the New England region are based largely on the waste management systems and emission factors reported by Safley et al. (1992) and then updated by the U.S. EPA (EPA, 1993) in conjunction with 1992 Census of Agriculture data on cattle and cow population.
Natural Gas Transmission Pipelines: Methane is the major constituent of natural gas. Emissions estimates were derived using published EPA emission factors (EPA, 1993) in combination with a pipeline atlas of transmission pipelines in the region.
Wastewater Treatment: Two hundred of the largest wastewater treatment plants in New England were surveyed to obtain their operating values that were then used as inputs to a wastewater treatment emissions model developed by UNH (Czepiel et al. (1993). Methane emissions were estimated from both liquid treatment processes and the anaerobic digestion of sludge. Fugitive emissions of biogas from anaerobic digestors were not considered.
Soil Uptake from Upland Forests: Data on county-level forest areas were obtained from the U.S. Forestry Service Forest Inventory and Analysis (FIA) project. To address concern about including areas of forested swamp as both sources and sinks, the areas of forest growing on very poorly drained land was subtracted from total forested areas. This should not be problematic since methane consumption occurs only in relatively well-drained soils. Agricultural land use data (cropland, pasture, rangeland, orchards) were obtained from the 1992 Census of Agriculture. Consumption rates from these soils are reduced due to the effects of soil compaction and fertilizer application: it was assumed that rates were only 20% (cropland) or 30% (pasture, rangeland, and orchards) of that of undisturbed forests. Since it does not appear that forest type (deciduous, evergreen) significantly affects uptake rates, a simple average for data reported in New England was obtained and applied to all forests.
Although soil methane consumption occurs during the warm season, it appears to be largely controlled by rates of methane diffusion into the soil rather than temperature, except during a relatively brief period in the spring (Crill, 1991). Using a multi-year data set from New Hampshire reported in Crill (1991) to determine the period over which uptake takes place, it was assumed that methane consumption occurred at a "warm season" constant rate over this period. This season, the time when the NOAA air temperature network 30-year monthly average temperature rises above freezing through the time when the average monthly minimum falls below freezing, varied from 214 days (northern Vermont, New Hampshire, and Maine) to 306 days (Barnstable, Dukes, and Nantucket counties, MA).
Data Access
This data is available through the Oak Ridge National Laboratory (ORNL) Distributed Active Archive Center (DAAC).
Natural and Anthropogenic Methane Sources, New England, USA, 1990-1994
Contact for Data Center Access Information:
- E-mail: uso@daac.ornl.gov
- Telephone: +1 (865) 241-3952
References
Blaha, D., K. Bartlett, P. Czepiel, R. Harriss, and P. Crill. 1999. Natural and anthropogenic methane sources in New England. Atmospheric Environment 33: 243-255.
Crill, P.M. 1991. Seasonal patterns of methane uptake and carbon dioxide release by a temperate woodland soil. Global Biogeochemical Cycles 5: 319-334.
Czepiel, P. P.M. Crill, and R.C. Harriss. 1993. Methane emissions from the Durham, New Hampshire wastewater treatment plant. Environmental Science and Technology 27: 2472-2477.
DOT. 1994. 1993 Highway Statistics. Federal Highway Administration, U.S. Department of Transportation.
EIA. 1995. Household Energy Consumption and Expenditures, 1993. Energy Information Administration, U.S. Department of Energy.
EPA, 1993. Anthropogenic methane emissions in the United States, estimates for 1990. Office of Air & Radiation, U.S. Environmental Protection Agency. EPA 430-R-93-003.
Frolking, S., and P.M. Crill. 1994. Climate controls on temperate variability of methane flux from a poor fen in Southeastern New Hampshire, Measurements and Modeling. Global Biogeochemical Cycles 8: 385-397.
Melloh, R.A., and P.M. Crill. 1996. Winter methane dynamics in a temperate peatland. Global Biogeochemical Cycles 10: 247-254.
Safley, L.M., M.E. Casada, J.W. Woodbury, and K.F. Roos. 1992. Global Methane Emissions from Livestock and Poultry Manures. Office of Air & Radiation, U.S. Environmental Protection Agency. EPA 400/1-91/048.