Documentation Revision Date: 2023-01-25
Dataset Version: 1
Summary
There are four data files in NetCDF (*.nc) format included in this dataset.
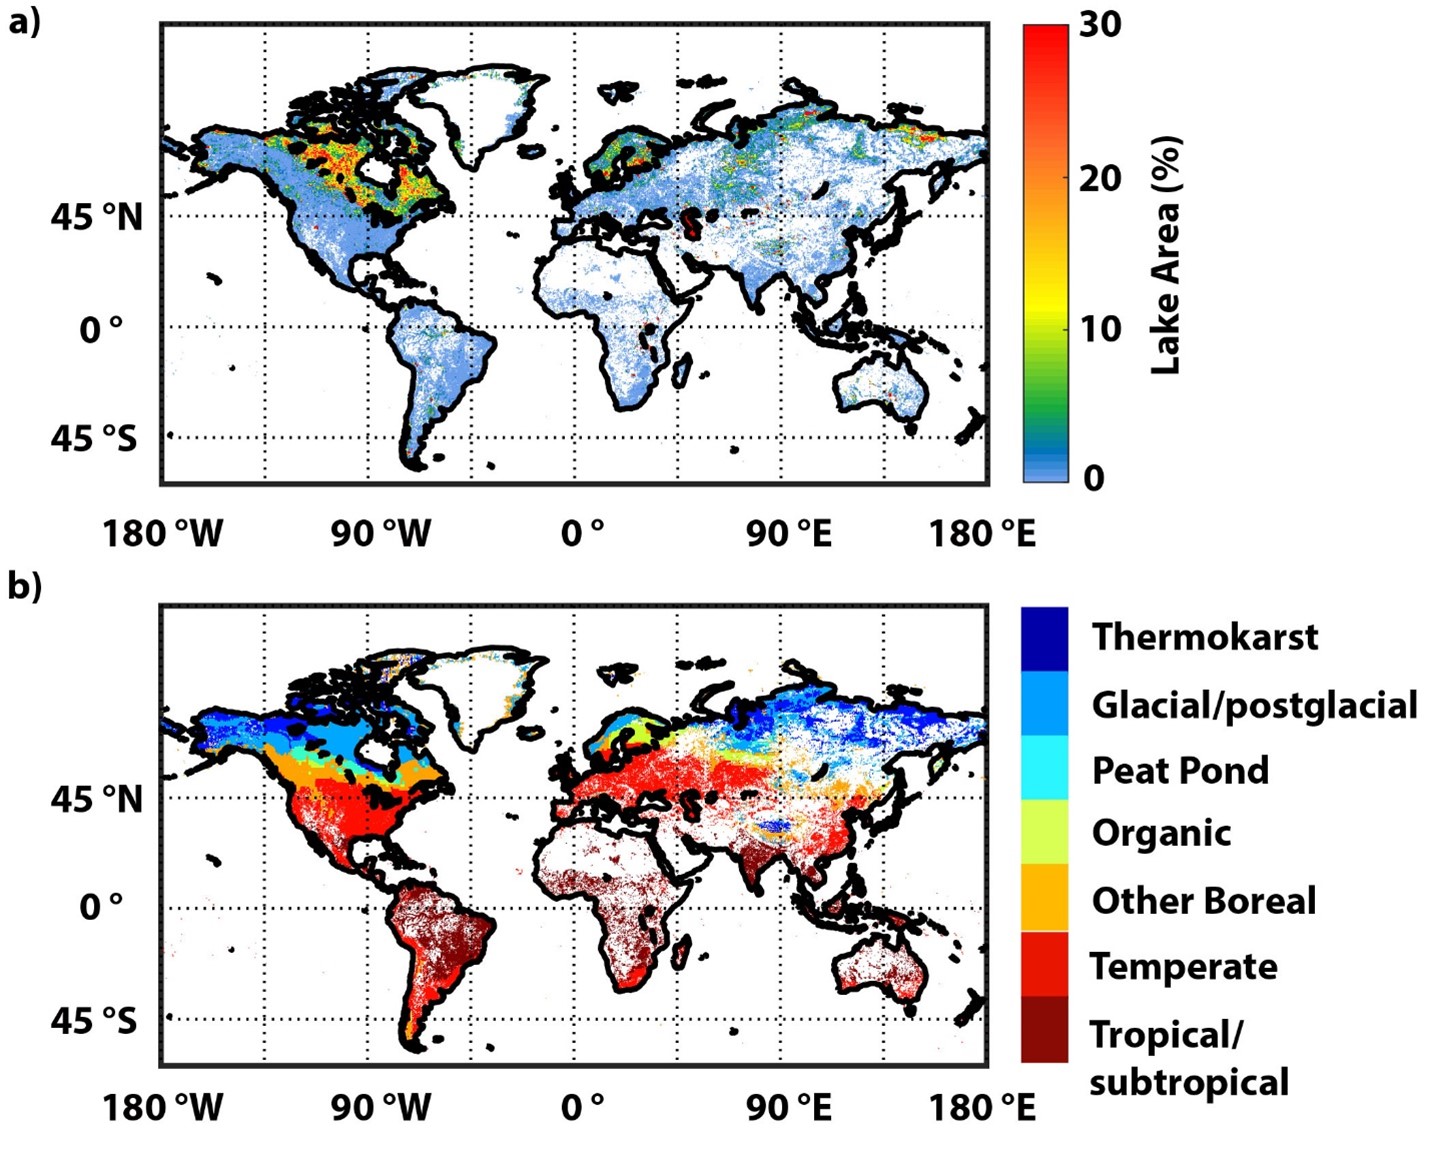
Figure 1. a) Lake area density (fraction of cell area) and b) ecoclimatic lake type classification. White space indicates cells with no lakes present.
Citation
Johnson, M.S., E. Matthews, D. Bastviken, J. Du, and V. Genovese. 2022. Global-Gridded Daily Methane Emissions Climatology from Lake Systems, 2003-2015. ORNL DAAC, Oak Ridge, Tennessee, USA. https://doi.org/10.3334/ORNLDAAC/2008
Table of Contents
- Dataset Overview
- Data Characteristics
- Application and Derivation
- Quality Assessment
- Data Acquisition, Materials, and Methods
- Data Access
- References
Dataset Overview
This dataset provides global gridded information on lake surface area and open water CH4 emissions at a resolution of 0.25-degree x 0.25-degree for an annual climatology representative of the average conditions from 2003 to 2015. A compilation of flux data from 575 individual lake systems and 893 aggregated flux values were used, and each flux measurement was classified into one of seven ecoclimatic types. Ice-cover-regulated emission seasonality was derived from satellite microwave observations of ice cover phenology and freeze-thaw dynamics. Global lake area was determined from the merger of HydroLAKES and Climate Change Initiative Inland-Water (CCI-IW) remote-sensing data, and lakes were classified into ecoclimatic regions to facilitate linking these types with ecosystem-specific CH4 measurements in the flux compilation. Exploratory estimates of fluxes associated with ice melt and with spring and fall water-column turnover are also included.
Related Publication
Johnson, M.S., E. Matthews, J. Du, V. Genovese, and D. Bastviken. 2022. Methane Emission From Global Lakes: New Spatiotemporal Data and Observation-Driven Modeling of Methane Dynamics Indicates Lower Emissions. Journal of Geophysical Research: Biogeosciences 127(7), e2022JG006793 https://doi.org/10.1029/2022JG006793
Related Datasets
Johnson, M.S. 2021. Global-Gridded Daily Methane Emissions from Inland Dam-Reservoir Systems. ORNL DAAC, Oak Ridge, Tennessee, USA. https://doi.org/10.3334/ORNLDAAC/1918
Acknowledgments
Matthew Johnson, Elaine Matthews, and Vanessa Genovese were funded for this work by NASA’s Interdisciplinary Research in Earth Science (IDS) Program (proposal 16-IDS16-0089) and the NASA Terrestrial Ecology and Tropospheric Composition Programs. David Bastviken was funded by the European Research Council (ERC; H2020 grant 25546, METLAKE). Jinyang Du was a collaborator on the IDS project which funded the majority of this work. Jinyang Du’s contribution to this study was through in-kind efforts. Resources supporting this work were provided by the NASA High-End Computing (HEC) Program through the NASA Advanced Supercomputing (NAS) Division at NASA Ames Research Center.
Data Characteristics
Spatial Coverage: Global
Spatial Resolution: 0.25° × 0.25° (~750 km2 at the equator)
Temporal Coverage: Climatological. The emissions data products cover an entire year (365 days) of emissions but it is representative of the average conditions from 2003 to 2015.
Temporal Resolution: Daily
Study Area: Latitude and longitude are given in decimal degrees.
| Site | Northernmost Latitude | Southernmost Latitude | Easternmost Longitude | Westernmost Longitude |
|---|---|---|---|---|
| Global | 90 | -90 | 180 | -180 |
Data File Information
There are four data files in NetCDF (*.nc) format included in this dataset.
Table 1. File names and descriptions.
| File Names | Description |
|---|---|
| Lake_Area.nc | Global lake surface areas |
| Lake_CH4_Diff_Ebul_Emiss.nc | Global daily lake diffusion/ebullition emissions |
| Lake_CH4_Fall_Turnover_Emiss.nc | Global daily lake fall water column turnover emissions |
| Lake_CH4_Ice_out_Emiss.nc | Global daily lake ice-out emissions |
Data File Details
Missing values are represented by -9999. The Coordinate Reference System is "WGS84" (EPSG:4326).
Table 2. Variable names and descriptions for Lake_Area.nc.
| Variable Name | Units | Description |
|---|---|---|
| crs | coordinate reference system | |
| lat | degrees_north | latitude coordinate |
| lon | degrees_east | longitude coordinate |
| LakeArea_Glacial | m2 | glacial/postglacial lake area |
| LakeArea_Organic | m2 | organic lake area |
| LakeArea_OtherBoreal | m2 | other boreal lake area |
| LakeArea_PeatPond | m2 | peat pond area |
| LakeArea_Temperate | m2 | temperate lake area |
| LakeArea_Thermokarst | m2 | thermokarst lake area |
| LakeArea_Total | m2 | all/total lake area |
| LakeArea_Tropical | m2 | tropical/subtropical lake area |
| LakeFraction_Total | fraction of each cell that contains all/total lake area |
Table 3. Variable names and descriptions for Lake_CH4_Diff_Ebul_Emiss.nc.
| Variable Name | Units | Description |
|---|---|---|
| crs | coordinate reference system | |
| lat | degrees_north | latitude coordinate |
| lon | degrees_east | longitude coordinate |
| time | days since 2012-01-01 00:00:00 | climatological day of year |
| climatology_bounds | start and end points of each time step | |
| DiffusionEbullition_Glacial | g m-2 day-1 | diffusion and ebullition methane emission rate from glacial/postglacial lakes |
| DiffusionEbullition_Organic | g m-2 day-1 | diffusion and ebullition methane emission rate from organic lakes |
| DiffusionEbullition_OtherBoreal | g m-2 day-1 | diffusion and ebullition methane emission rate from other boreal lakes |
| DiffusionEbullition_PeatPond | g m-2 day-1 | diffusion and ebullition methane emission rate from peat ponds |
| DiffusionEbullition_Temperate | g m-2 day-1 | diffusion and ebullition methane emission rate from temperate lakes |
| DiffusionEbullition_Thermokarst | g m-2 day-1 | diffusion and ebullition methane emission rate from thermokarst lakes |
| DiffusionEbullition_TotalLakes | g m-2 day-1 | diffusion and ebullition methane emission rate from total/all lakes |
| DiffusionEbullition_Tropical | g m-2 day-1 | diffusion and ebullition methane emission rate from tropical/subtropical |
| EmissionSeason | length of the methane emission season (thaw season) for total/all lakes |
Table 4. Variable names and descriptions for Lake_CH4_Fall_Turnover_Emiss.nc.
| Variable Name | Units | Description |
|---|---|---|
| crs | coordinate reference system | |
| lat | degrees_north | latitude coordinate |
| lon | degrees_east | longitude coordinate |
| time | days since 2012-01-01 00:00:00 | climatological day of year |
| climatology_bounds | start and end points of each time step | |
| FallTurnover_TotalLakes | g m-2 day-1 | fall water column turnover methane emission rate from total/all lakes |
Table 5. Variable names and descriptions for Lake_CH4_Ice_out_Emiss.nc.
| Variable Name | Units | Description |
|---|---|---|
| crs | coordinate reference system | |
| lat | degrees_north | latitude coordinate |
| lon | degrees_east | longitude coordinate |
| time | days since 2012-01-01 00:00:00 | climatological day of year |
| climatology_bounds | start and end points of each time step | |
| IceOut_TotalLakes | g m-2 day-1 | ice out and spring water column turnover methane emission rate from total/all lakes |
Application and Derivation
The data was developed in a manner (e.g., spatial and temporal resolution) to facilitate use in bottom-up biogeochemical models, top-down atmospheric inverse models, and climate models and Earth System Models.
Quality Assessment
Uncertainty (ε) in global lake CH4 emission estimate was calculated using Eq. (1) and by propagating the individual uncorrelated uncertainties from the coefficient of variation in the time- and temperature-corrected diffusive and ebullitive emission measurements (εv), soil temperature threshold between temperate and tropical/subtropical lakes (εt), CH4 accumulation lag time for ice-out (εai) and fall water-column turnover flux (εaf), and the oxidation fraction considered for accumulated CH4 (εox) through Eq. (1).
ε= √(εv^2+εt^2+εai^2+εaf^2+εox^2 ) (1)
The coefficient of variation in the time- and temperature-corrected diffusive and ebullitive emission measurements was calculated directly from the variability in the flux measurement compilation data. The uncertainty in the soil temperature threshold separating temperate and tropical/subtropical lakes was assumed to vary by 2.5°C around the mean of 20.0°C. The lag time for CH4 accumulation for calculating ice-out and fall turnover fluxes was assumed to vary by 15 days around the mean lag times of 60 days, respectively. Finally, to quantify the uncertainty owing to the oxidation fraction used to calculate ice-out and fall turnover fluxes, the value was varied from 0.5 to 0.99. Using each uncertainty component in Eq. (1) allowed for the quantification of the overall uncertainty in the global emission estimate.
Data Acquisition, Materials, and Methods
For consistency, these global data are provided at 0.25° latitude × 0.25° longitude spatial resolution. For reference, a 0.25° × 0.25° grid cell is ~750 km2 at the equator and ~500 km2 at 50°N.
Flux Data
The compilation of flux measurements was derived from published datasets (Bastviken et al., 2011; Wik et al., 2016; Rinta et al., 2017; Li et al., 2020). The approach to processing lake measurements is described in Johnson et al. (2021, 2022). After literature reassessment and filtering, data from 575 individual lake systems and 893 aggregated flux values (683 diffusion; 210 ebullition) were used, and each flux measurement was classified into one of seven ecoclimatic types.
Ice-Free Emission Season
Ice-cover-regulated emission seasonality was derived from satellite microwave observations of ice-cover phenology (Du et al., 2017; Du and Kimball, 2018) and freeze-thaw dynamics (Kim et al., 2017a,b; version 4 (FTv04)) as described in Matthews et al. (2020) and Johnson et al. (2021). The lake ice phenology dataset used (Du and Kimball, 2018) recorded daily ice-cover conditions for Northern Hemisphere lakes with area ≥50 km2 using direct satellite observations and has 95% temporal accuracy relative to ground-based observations (Du et al., 2017). The ice conditions were derived based on the high sensitivity of microwave remote-sensing to the different dielectric properties of water and ice (Du et al., 2017). For relatively small lakes (surface area <50 km2) which are not represented in the ice-phenology dataset, the daily landscape freeze/thaw dynamics of Kim et al. (2017a,b; FTv04) were applied to obtaining ice conditions. Climatological conditions were calculated from both time series (lake-ice phenology 2002–2015, freeze-thaw 2003–2015). Local daily climatological thaw and freeze dates were derived by calculating mean thaw and freeze dates for each year and then averaged over the length of each source dataset. The two satellite datasets were combined to develop a complete year of global daily data that describes the timing and duration of ice-free periods which define the seasonality of CH4 emissions. Emissions commence on local thaw dates and end on local freeze dates; the difference between them defines the emission-season length.
Lake Area, Distribution, and Ecoclimatic Type
Global lake area and spatial distribution were extracted from HydroLAKES (Messager et al., 2016). The HydroLAKES data were augmented with small lakes between 0.002–0.1 km2 extracted from the European Space Agency’s Climate Change Initiative Inland-Water remote-sensing dataset (CCI-IW; Lamarche et al., 2017) after removing non-lake water bodies in order to isolate lakes. River areas were removed from CCI-IW using the Global River Widths data derived from Landsat (GRWL; Allen and Pavlevsky, 2018); reservoirs were removed using our new reservoir dataset (Johnson et al., 2021). Global lake area, from the merger of HydroLAKES (2640×103 km2) and added small lake area from CCI-IW (166×103 km2), was estimated to be 2806×103 km2 (1747×103 for lakes <5000 km2 and 1059×103 km2 for lakes ≥5000 km2). The distribution of global lake area is shown in Fig. 1a and lake ecoclimatic types in Fig. 1b.
Lakes were classified into ecoclimatic regions to facilitate linking these types with ecosystem-specific CH4 measurements in the flux compilation. Ecoclimatic regions were defined using spatially-explicit data on controlling conditions and variables: permafrost and ground-ice state, soil carbon, and annually-averaged soil temperature from the Modern-Era Retrospective analysis for Research and Applications, Version 2 (MERRA-2; Gelaro et al., 2017) and lake classification methods described in Matthews et al. (2020). Annual soil temperature thresholds were employed for the final classification of types similar to Johnson et al. (2021).
Lake Methane Fluxes
The majority of flux measurements were made from late spring to early fall. To correct this observational bias, the seasonal distribution of monthly fluxes was calculated for each measurement using methods similar to Prairie et al. (2017) and Harrison et al. (2021) and described in Johnson et al. (2021). To correct for diel fluctuations in CH4 fluxes, information on the time of day was extracted for each measurement in the compilation. To derive true 24-hour CH4 flux rates, the diel scaling factor of Sieczko et al. (2020) was applied to all daytime observations. Specifically, daytime-only measurements (i.e., between 7:00 am and 8:00 pm local time) were multiplied by 0.7, and measurements made over 24-hour intervals were used as reported. Exploratory estimates of fluxes associated with ice melt and with spring and fall water-column turnover are also included. Fluxes of ice-out and fall water were estimated by defining several assumptions described in Johnson et al. (2022). It was also assumed that lakes with surface areas ≥5000 km2 have CH4 emission rates that are 10% of the fluxes observed from lakes <5000 km2 in comparable ecoclimatic regions.
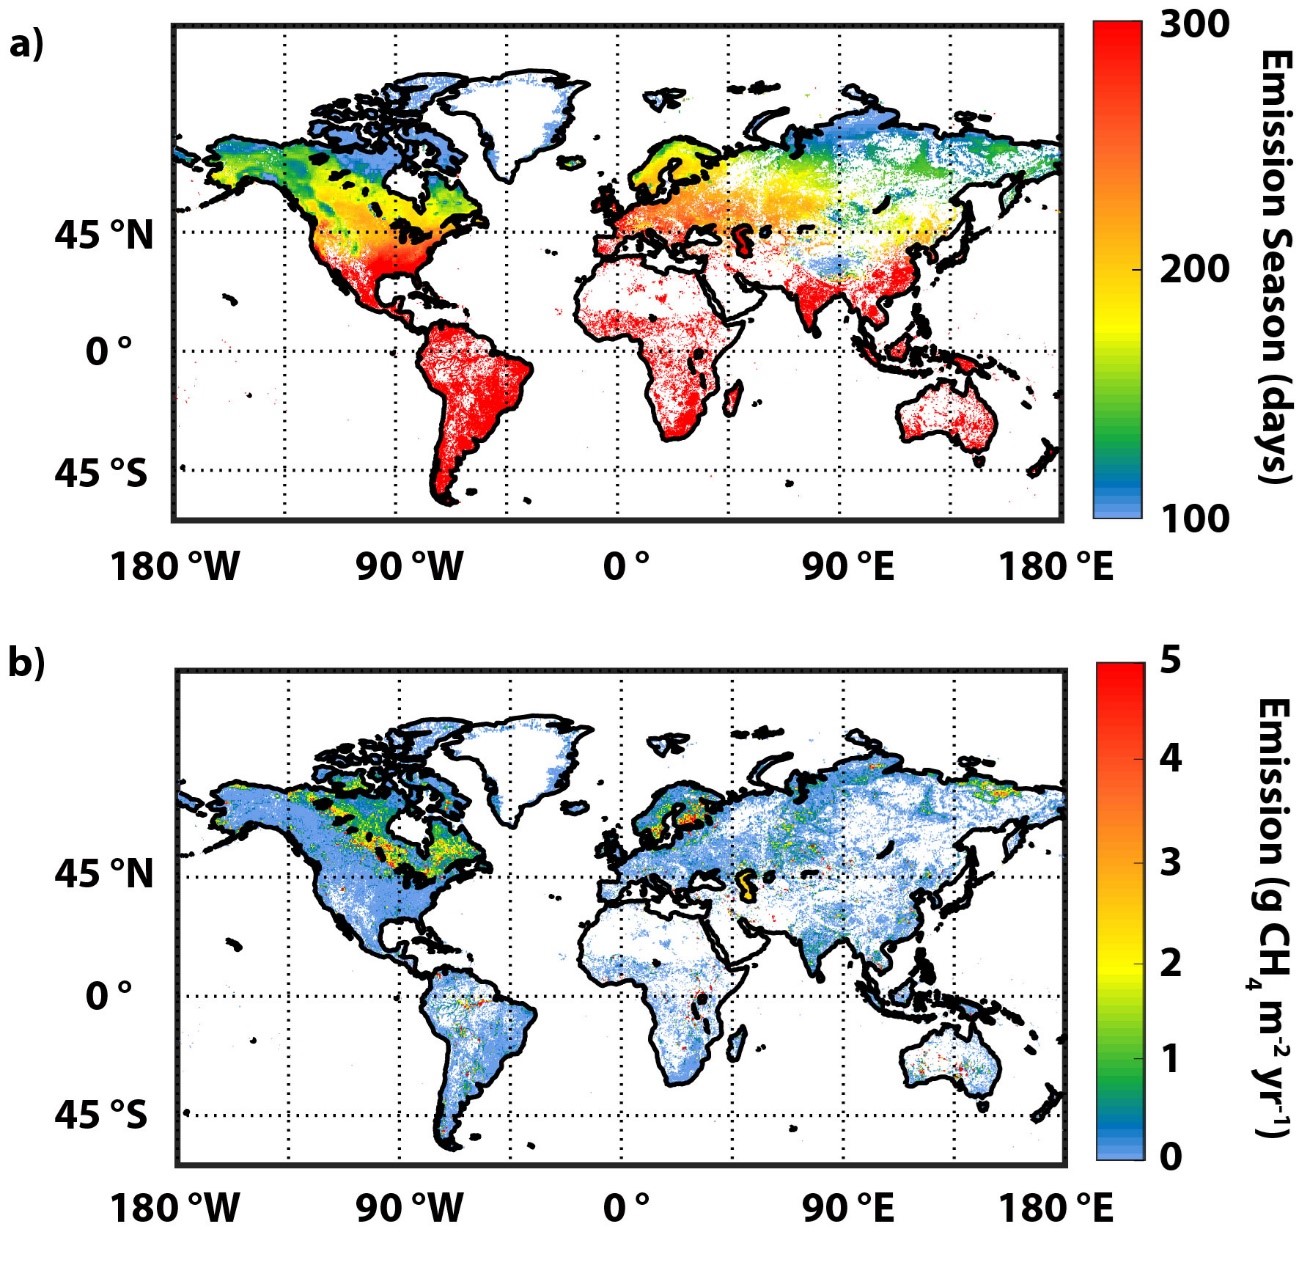
Figure 2. Global distribution of a) emission-season length (days) and b) annual lake CH4 emission (g m-2 yr-1) via diffusive and ebullitive emission pathways. Note that Fig. 2b shows annual lake emission as g CH4 per m2.
Data Access
These data are available through the Oak Ridge National Laboratory (ORNL) Distributed Active Archive Center (DAAC).
Global-Gridded Daily Methane Emissions Climatology from Lake Systems, 2003-2015
Contact for Data Center Access Information:
- E-mail: uso@daac.ornl.gov
- Telephone: +1 (865) 241-3952
References
Allen, G.H., and T.M. Pavelsky. 2018. Global extent of rivers and streams. Science 361(6402). https://doi.org/10.1126/science.aat0636
Bastviken, D., L.J. Tranvik, J. A. Downing, P. M. Crill, and A. Enrich-Prast. 2011. Freshwater methane emissions offset the continental carbon sink. Science 331:50-51. https://doi.org/10.1126/science.1196808
Du, J. and J.S. Kimball. 2018. Daily Lake Ice Phenology Time Series Derived from AMSR-E and AMSR2, Version 1. Global, 2002-2015. Boulder, Colorado USA. NASA National Snow and Ice Data Center Distributed Active Archive Center. https://doi.org/10.5067/HT4NQO7ZJF7M
Du, J., J.S. Kimball, C. Duguay, Y. Kim, and J.D. Watts. 2017. Satellite microwave assessment of Northern Hemisphere lake ice phenology from 2002 to 2015. The Cryosphere, 11:47–63. https://doi.org/10.5194/tc-11-47-2017
Gelaro, R., W. McCarty, M.J. Suarez, R. Todling, A. Molod, L. Takacs, C.A. Randles, et al. 2017. The modern-era retrospective analysis for research and applications, version 2 (MERRA-2). Journal of Climate 30(14):5419–5454. https://doi.org/10.1175/JCLI-D-16-0758.1
Harrison, J.A., Y.T. Prairie, S. Mercier-Blais, and C. Soued. 2021. Year-2020 global distribution and pathways of reservoir methane and carbon dioxide emissions according to the greenhouse gas from reservoirs (G-res) model. Global Biogeochemical Cycles. https://doi.org/10.1029/2020GB006888
Kim, Y., J.S. Kimball, J.M. Glassy, and J. Du. 2017a. An extended global Earth system data record on daily landscape freeze–thaw status determined from satellite passive microwave remote sensing. Earth System Science Data 9:133–147. https://doi.org/10.5194/essd-9-133-2017
Kim, Y., J.S. Kimball, J. Glassy, and K.C. McDonald. 2017b. MEaSUREs Global Record of Daily Landscape Freeze/Thaw Status, Version 4. Global, 2003-2015. Boulder, Colorado USA. NASA National Snow and Ice Data Center Distributed Active Archive Center. https://doi.org/10.5067/MEASURES/CRYOSPHERE/nsidc-0477.004.
Johnson, M.S., E. Matthews, J. Du, V. Genovese, and D. Bastviken. 2022. Methane emission from global lakes: new spatiotemporal data and observation-driven modeling of methane dynamics indicates lower emissions. Journal of Geophysical Research: Biogeosciences 128:17433566. https://doi.org/10.1029/2022JG006793
Johnson, M.S., E. Matthews, D. Bastviken, B. Deemer, J. Du, and V. Genovese. 2021. Spatiotemporal methane emission from global reservoirs, Journal of Geophysical Research Biogeosciences 126(8):e2021JG006305. https://doi.org/10.1029/2021JG006305
Johnson, M.S. 2021. Global-Gridded Daily Methane Emissions from Inland Dam-Reservoir Systems. ORNL DAAC, Oak Ridge, Tennessee, USA. https://doi.org/10.3334/ORNLDAAC/1918
Lamarche, C., Santoro, M., Bontemps, S., d’Andrimont, R., Radoux, J., Giustarini, L., Brockmann, 618 C., Wevers, J., Defourny, P., & Arino, O. (2017). Compilation and validation of SAR and 619 optical data products for a complete and global map of inland/ocean water tailored to the 620 climate modeling community. Remote Sensing, 9. https://doi.org/10.3390/rs9010036
Li, M., C. Peng, Q. Zhu, X. Zhou, G. Yang, X. Song, and K. Zhang. 2020. The significant contribution of lake depth in regulating global lake diffusive methane emissions. Water Research 172:115465. https://doi.org/10.1016/j.watres.2020.115465
Matthews, E., M.S. Johnson, V. Genovese, J. Du, and D. Bastviken. 2020. Methane emission from high latitude lakes: Methane-centric lake classification and satellite-driven annual cycle of emissions. Scientific Reports 10:12465. https://doi.org/10.1038/s41598-020-68246-1
Messager, M.L., B. Lehner, G. Grill, I. Nedeva, and O. Schmitt. 2016. Estimating the volume and age of water stored in global lakes using a geo-statistical approach. Nature Communications 7:13603. https://doi.org/10.1038/ncomms13603
Prairie Y.T., J. Alm, A. Harby, S. Mercier-Blais, and R. Nahas. 2017. The GHG Reservoir Tool (Gres) Technical documentation v2.1 (2019-08-21). UNESCO/IHA research project on the GHG status of freshwater reservoirs. Joint publication of the UNESCO Chair in Global Environmental Change and the International Hydropower Association. 76 pages.
Rinta, P., D. Bastviken, J. Schilder, M. Van Hardenbroek, T. Stötter, and O. Heiri. 2017. Higher late summer methane emission from central than northern European lakes. Journal of Limnology 76:52–67. https://doi.org/10.4081/jlimnol.2016.1475
Sieczko, A.K., N.T. Duc, J. Schenk, G. Pajala, D. Rudberg, H.O. Sawakuchi, and D. Bastviken. 2020. Diel variability of methane emissions from lakes. Proceedings of the National Academy of Sciences 117:21488–21494. https://doi.org/10.1073/pnas.2006024117
Wik, M., R.K. Varner, K.W. Anthony, S. MacIntyre, and D. Bastviken. 2016. Climate-sensitive northern lakes and ponds are critical components of methane release. Nature Geoscience 9:99-105. https://doi.org/10.1038/ngeo2578