Documentation Revision Date: 2019-11-14
Dataset Version: 1
Summary
These climate normal data products were used to evaluate changes in climate across Alaska over the two time periods and to assess how results might depend on the spatial resolution of the input data products.
There are 416 data files in GeoTIFF (.tif) format with this dataset -- 240 monthly average files and 176 annual average files.
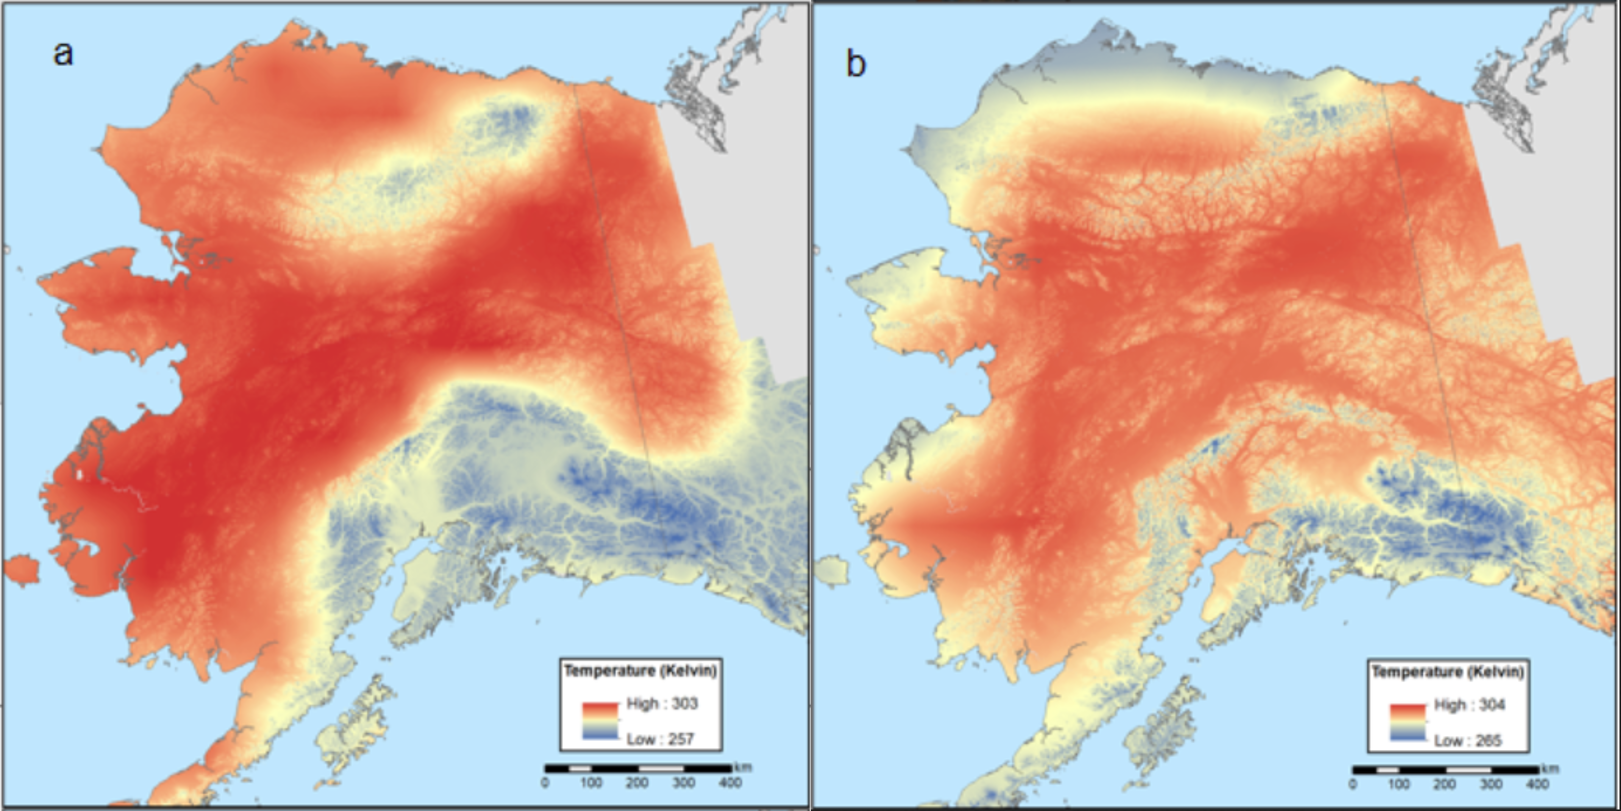
Figure 1. 30-year climate normal annual average maximum temperature for Alaska at 60-m resolution: (a) the last glacial maximum period ~18,000 years ago, and (b) the modern period 1975-2005. (Sources: max_temp_annual_lgm_60m.tif and max_temp_annual_1975-2005_60m.tif)
Citation
Morrison, B.D., and J.A. Greenberg. 2019. Climate Normals for Last Glacial Maximum and Modern (1975-2005), Alaska. ORNL DAAC, Oak Ridge, Tennessee, USA. https://doi.org/10.3334/ORNLDAAC/1663
Table of Contents
- Dataset Overview
- Data Characteristics
- Application and Derivation
- Quality Assessment
- Data Acquisition, Materials, and Methods
- Data Access
- References
Dataset Overview
This dataset provides two 30-year climate normal data products for conditions during the last glacial maximum (LGM; ~18,000 years ago) and a modern time period (1975-2005) for the entire state of Alaska. The first set of products are monthly climate variable averages at 60 m resolution, including: minimum, maximum, and average temperatures, total precipitation, total surface radiation, rain, snow, potential evapotranspiration (PET), actual evapotranspiration (AET), and water deficit. The second set of products are annual summary climate variable averages for the same variables (excepting average temperature and rain) at 60m, 120m, 240m, 800m, 1km, 2km, 3km, 4km, 5km, 10km and 12km resolutions. The 30-year climate normal monthly averages were derived by topographically downscaling climate variables from existing coarse-resolution general circulation model outputs combined with local weather station data and digital surface models for Alaska for both the LGM and modern time periods at 60 m resolution. From this baseline, monthly averages for total surface radiation, rain, snow, potential evapotranspiration, actual evapotranspiration, and water deficit were also modeled. The annual averages are coarser resolution upsampled versions of the 60 m resolution monthly average data.
These climate normal data products were used to evaluate changes in climate across Alaska over the two time periods and to assess how results might depend on the spatial resolution of the input data products.
Related Publication:
Morrison, B.D., B. Li, K. Heath, and J.A. Greenberg. 2019. Spatial Scale Affects Novel and Disappeared Climate Change Projections in Alaska. Ecology and Evolution (2019). https://doi.org/10.1002/ece3.5511
Acknowledgements:
This research was funded by a NASA Earth and Space Science Fellowship, grant number NNX15AN09H.
Data Characteristics
Spatial Coverage: Alaska
ABoVE Reference Locations:
Domain: Core ABoVE
State/territory: Alaska
Grid Cells: Ah000v000, Ah001v000, Ah000v001, Ah001v001
Spatial Resolution: Monthly data are provided at 60 m resolution; annual data are at provided at 60m, 120m, 240m, 800m, 1km, 2km, 3km, 4km, 5km, 10km or 12km resolutions.
Temporal Coverage: Last Glacial Maximum (LGM): ~18,000 years ago. Modern period: 1975-01-01 to 2005-12-31
Temporal Resolution: monthly and annual 30-yr climatologies
Study Areas (All latitude and longitude given in decimal degrees)
|
Site |
Westernmost Longitude |
Easternmost Longitude |
Northernmost Latitude |
Southernmost Latitude |
|---|---|---|---|---|
|
Alaska |
-178.23549 |
-106.93342 |
67.88439 |
47.7384 |
Data File Information
There are 416 data files in GeoTIFF (.tif) format. The files provide derived monthly and annual climate averages for selected variables for two time periods: LGM ~18,000 years ago and modern for the period 1975-2005.
Monthly: 240 files (10 variables x 12 months x 2 time periods)
Annual: 176 files (8 variables x 11 resolutions x 2 time periods)
GeoTIFF properties: Number of bands in each file = 1, No data value = -9999, Projection = EPSG: 3338 (Alaska Albers).
Table 1. File names and descriptions
| File names | Descriptions |
|---|---|
| Monthly Data | |
|
var_month_time_60m.tif (e.g., snow_2_lgm_60m.tif) |
Monthly files for each variable (10 variables) for two time periods are provided at 60-m resolution. The variables, units, and descriptions are listed in Table 1. Each month is identified by number (1 to 12) and time period is either '1975-2005' or 'lgm' for the Last Glacial Maximum. |
| Annual Data | |
|
var_annual_time_resolution.tif (e.g., snow_annual_lgm_1km.tif) |
Annual average files for each variable (8 variables) for two time periods are provided at 11 different resolutions. The variables, their units, and descriptions are listed in Table 1. Note, however, that there are no annual files for “precip” or “avg_temp”. Time period is either '1975-2005' or 'lgm' for the Last Glacial Maximum. Resolutions: 60m, 120m, 240m, 800m, 1km, 2km, 3km, 4km, 5km, 10km or 12km.
|
Table 1. Variables in the data files
| Variable name | Units | File "var" prefix |
|---|---|---|
| Minimum air temperature | Degrees Kelvin | min_temp |
| Maximum air temperature | Degrees Kelvin | max_temp |
| Average air temperature (Note: Monthly files only) | Degrees Kelvin | avg_temp |
| Total Precipitation (Note: Monthly files only) | mm | precip |
| Total Surface Radiation (Cloud Corrected Shortwave Irradiance ) | W | radiation |
| Rain | mm | rain |
| Snow | mm | snow |
| Actual Evapotranspiration (AET) | mm | actual_evapotrans |
| Potential Evapotranspiration (PET) | mm | potential_evapotrans |
| Climatic Water Deficit | mm | deficit |
Application and Derivation
These data could be useful for climate change studies. The research could help clarify the effect of climate grid resolution on estimations of novel and disappeared climates. See Morrison et al., 2019.
Quality Assessment
Downscaled temperature and precipitation model uncertainties were evaluated by creating calibration and validation datasets using observed monthly weather station data from NOAA's Global Historical Climatology Network dataset. The models were evaluated by computing the Pearson's correlation, root-mean square error (RMSE), and percent bias for each model based on observed vs. predicted temperature/precipitation values. See Morrison et al., 2019.
Data Acquisition, Materials, and Methods
A topographically mediated downscaling of coarse scale climate data to a resolution of 60-m was performed for the modern and LGM periods. Climate variables commonly used in climate change and ecological analyses were selected to identify and determine where novel, disappeared, and shared climates are distributed across the state of Alaska from the LGM to modern era. See Morrison et al., 2019 for data acquisition and modeling details. Below is a brief synopsis.
Downscaling Input Data:
General circulation model climate data
Coarse scale (1°) general circulation model (GCM) climate grids were collected from the NCAR CCSM4 for near surface (2 m) Tmin, Tmax, Tave, precipitation, short wave radiation (Icloud) and wind (U, V) (Gent et al., 2011, Kluzek, 2011). All climate surfaces were pooled into two 30-year averages, ~18,000-18,030 ya (years ago) for the LGM and 1975-2005 for modern climate.
Weather station data
Spatially explicit monthly weather station data were collected from the National Oceanic and Atmospheric Administration’s (NOAA) Global Historical Climatology Network (GHCND) (Menne et al., 2012). Records were compiled from stations across the period of 1975-2005, although the period of record for each station varies. Missing data fields as well as extreme outliers were removed from the weather dataset by identifying observations > 3 standard deviations from the means of all observations across time for minimum temperature (Tmin), maximum temperature (Tmax), mean temperature (Tave), and total monthly precipitation (P) (Aggarwal, 2016). The dataset consisted of 54,711 observations.
Alaska DEM
An elevation surface was assembled for the entire state of Alaska using United States Geologic Surveys (USGS) 1 arc-second (~60 m) digital elevation maps (DEM) (USGS, 2016). The DEM was resampled and reprojected to Alaska Albers Equal Area Conic, ensuring grid cells of exactly 60 m. From this dataset, slope, aspect, and the topographic convergence index (TCI) for Alaska were calculated.
Variable Downscaling Models:
Downscaled modeled variable outputs are monthly values at 60 m resolution.
Air Temperatures, monthly Tmin, Tmax, and Tave were modeled as functions of elevation, mean monthly daily clear sky irradiance, and topographic convergence index (TCI) which is a proxy for local convective forcing’s such as cold-air pooling, at a given location.
The coldest Tmin month (December for LGM, and January for modern) was used to represent the coldest annual temperatures. Likewise, the hottest month for Tmax (July for both LGM and modern) was used to represent the hottest annual temperatures.
Total Surface Radiation (Cloud Corrected) was derived from a merging of 60 m “clear-sky” shortwave irradiance derived using topographic elevation, slope, aspect, and geographic latitude as inputs referenced against solar angles and “true sky” clouded irradiance from coarse modeled surface downwelling shortwave radiation (100 km). The ratio of true-sky to clear-sky irradiance for each month was then applied to each monthly high resolution clear-sky irradiance for both the LGM and today.
Total Precipitation was modeled with topographic predictors at a variety of scales, not just the high resolution 60 m predictors.
Rain and Snow were derived from downscaled precipitation, mean temperature, and radiation that were used to estimate the fraction of precipitation arising as either rainfall, snowfall, snowpack, or snowmelt during a given month at 60 m resolution for both the LGM and modern eras.
Actual Evapotranspiration (AET) is the evaporative water loss given the actual water availability at a site, and therefore represents the biologically usable energy and water in the environment. AET and water deficit were calculated using a snow hydrology model that models additional water and energy parameters that influence available water at a site.
Potential Evapotranspiration (PET) reflects plants use of energy and water to grow and reproduce, therefore the primary effects of climate on plants is regulated by the interactions of energy and water. Through water balance equations utilizing downscaled temperature, elevation, wind speed, and cloud-corrected irradiance data as inputs, energy is represented by PET and available water.
Water deficit refers to climatic water deficit, not soil water deficit, and represents the amount of evaporative demand that was not met by available water in other words: WD = PET - AET.
Annual Data Aggregation and Upsampling:
In general, monthly climate variables at 60 m resolution were averaged to annual values, also at 60-m resolution. Note Tmin and Tmax exceptions mentioned above. Then annual averages were aggregated to coarser resolutions of 120m, 240m, 800m, 1km, 2km, 3km, 4km, 5km, 10km and 12km.
Data Access
These data are available through the Oak Ridge National Laboratory (ORNL) Distributed Active Archive Center (DAAC).
Climate Normals for Last Glacial Maximum and Modern (1975-2005), Alaska
Contact for Data Center Access Information:
- E-mail: uso@daac.ornl.gov
- Telephone: +1 (865) 241-3952
References
Aggarwal, C.C., (2017). Outlier analysis. Springer. https://doi.org/10.1007/978-3-319-47578-3
Gent, P.R., G. Danabasoglu, L.J. Donner, M.M. Holland, E.C. Hunke, S.R. Jayne, D.M. Lawrence, R.B. Neale, P.J. Rasch, M. Vertenstein, P.H. Worley, Z.L. Yang, and M.H. Zhang. 2011. The Community Climate System Model Version 4. Journal of Climate, 24(19), 4973-4991. http://doi.org/10.1175/2011jcli4083.1
Kluzek, E. 2011. CCSM research tools: CLM 4.0 user’s guide documentation. http://www.cesm.ucar.edu/models/ccsm4.0/clm/
Menne, M.J., I. Durre, R.S. Vose, B.E. Gleason, and T.G. Houston. 2012. An Overview of the Global Historical Climatology Network-Daily Database. Journal of Atmospheric and Oceanic Technology, 29(7), 897-910. http://doi.org/10.1175/Jtech-D-11-00103.1
Morrison, B.D., B. Li, K. Heath, and J.A. Greenberg. 2019. Spatial Scale Affects Novel and Disappeared Climate Change Projections in Alaska. Ecology and Evolution. https://doi.org/10.1002/ece3.5511
USGS. (2016). The National Map. Retrieved from: http://nationalmap.gov/3DEP/3dep_prodserv.html