Documentation Revision Date: 2017-01-17
Data Set Version: V1
Summary
A total of 36 NetCDF version 3 (.nc) files are contained in this data set, one per month for the period between 1 January, 2012 and 31 December, 2014.
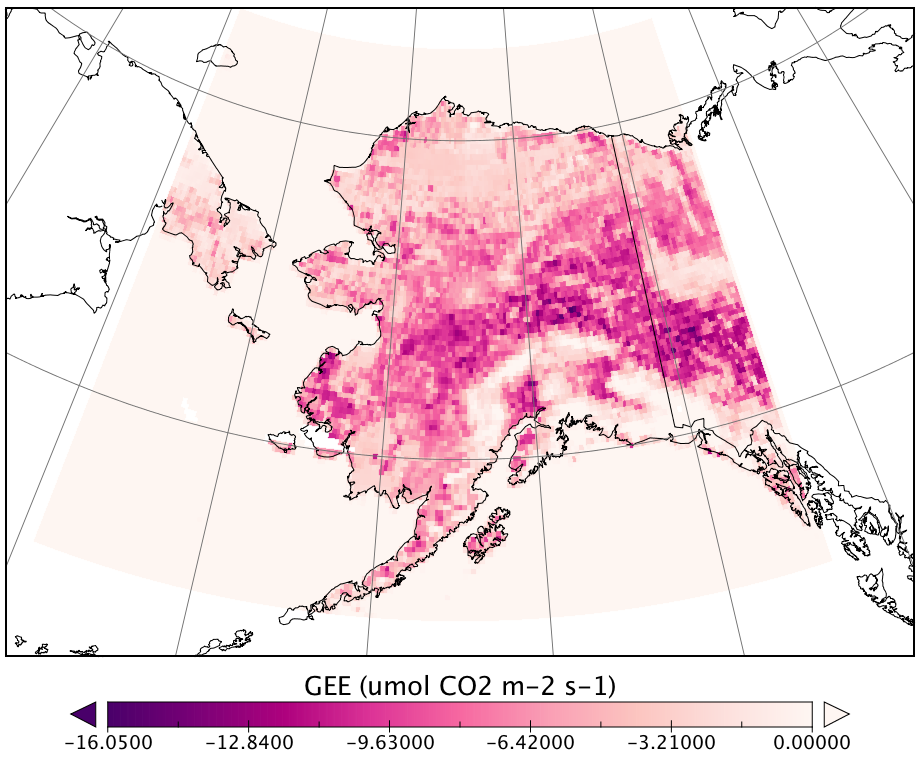
Figure 1. Gross ecosystem CO2 exchange (GEE) calculated using MODIS Enhanced Vegetation Index for 21:00 UTC, August 2, 2013. GEE typical of a mid-summer day.
Citation
Luus, K.A., and J.C. Lin. 2017. CARVE Modeled Gross Ecosystem CO2 Exchange and Respiration, Alaska, 2012-2014. ORNL DAAC, Oak Ridge, Tennessee, USA. http://dx.doi.org/10.3334/ORNLDAAC/1314
Table of Contents
- Data Set Overview
- Data Characteristics
- Application and Derivation
- Quality Assessment
- Data Acquisition, Materials, and Methods
- Data Access
- References
Data Set Overview
This data set includes 3-hourly estimates of gross ecosystem CO2 exchange (GEE) and respiration (autotrophic and heterotrophic) at 1/4-degree (longitude) by 1/6-degree (latitude) pixel resolution (~1 km2; latitude dependent) for the state of Alaska from 2012 to 2014. The data were generated using the Polar Vegetation Photosynthesis and Respiration Model (PolarVPRM), a formulation of the Vegetation Photosynthesis and Respiration Model (VPRM; Mahadevan et al., 2008) that uses polar-specific vegetation classes to account for high-latitude influences on GEE.
Meteorological inputs are taken from the North American regional re-analysis (NARR), and inputs of fractional snow cover and land surface water index (LSWI) from the Moderate Resolution Imaging Spectroradiometer (MODIS). Land surface greenness is factored into the model from one of three sources: 1) Enhanced Vegetation Index (EVI) from MODIS; 2) Solar Induced Florescence (SIF) from the Orbiting Carbon Observatory 2 (OCO-2); or, 3) SIF from the Global Ozone Monitoring Experiment 2 (GOME-2). Three different estimates of GEE are included in the data set, one for each source of greenness observations.
This project was partially funded by the National Science and Engineering Research Council (NSERC) through the Vanier Canada Graduate Scholarship.
Project: Carbon in Arctic Reservoirs Vulnerability Experiment (CARVE)
Carbon in Arctic Reservoirs Vulnerability Experiment (CARVE) is collecting detailed measurements of important greenhouse gases on local to regional scales in the Alaskan Arctic and demonstrating new remote sensing and improved modeling capabilities to quantify Arctic carbon fluxes and carbon cycle-climate processes. Ultimately, CARVE will provide an integrated set of data that will provide unprecedented experimental insights into Arctic carbon cycling.
Related Publication:
Luus, K.A., R. Commane, N.C. Parazoo, J. S. Benmergui, S. E. Euskirchen, C. Frankenberg, J. Joiner, J. Lindaas, C.E. Miller, W.C. Oechel, D. Zona, S. Wofsy, and J.C. Lin. 2017. Tundra photosynthesis captured by satellite-observed solar-induced chlorophyll fluorescence. Geophysical Research Letters. http://dx.doi.org/10.1002/2016GL070842
Acknowledgements:
This project was partially funded by the National Science and Engineering Research Council (NSERC) through the Vanier Canada Graduate Scholarship.
Data Characteristics
Spatial Coverage: Alaska
Spatial Resolution: 1/4-degree longitude by 1/6-degree latitude pixel resolution
Temporal Coverage: The data covers the period 20120101 to 20141231.
Temporal Resolution: 3-hourly
Spatial Extent: All latitudes and longitudes given in decimal degrees
|
Site (Region) |
Westernmost Longitude |
Easternmost Longitude |
Northernmost Latitude |
Southernmost Latitude |
|
Alaska |
-179 |
-134 |
73 |
55 |
Data File Information:
There are 36 data files in NetCDF v3 format (.nc), each containing the 3-hourly GEE and respiration estimates for a single month between 2012 and 2014. The number of days in the month represented by a given NetCDF determines the number of timestamps contained within the file [e.g. January has 31 days; (31 days x 24 hours) / 3-hourly_timestamp_interval = 248 timestamps].
File naming convention:
PolarVPRM-AlaskanNEE-3hrly-YYYY-MM.nc
Where: YYYY-MM indicates the year and month represented by the data.
Variable names and decsription:
All GEE and respiration CO2 quantities are in micromoles per square meter per second (µmol/m2/second).
|
Variable Name |
Units |
Description |
|
dayOfMonth |
|
Day of month |
|
dayOfYearFrac |
|
Fractional day of year |
|
GEE_GOME2_SIF |
µmol/m2/second |
Gross Ecosystem CO2 Exchange= -1*GPP, calculated using GOME-2 SIF. Negative GEE indicates carbon uptake by vegetation. |
|
GEE_MODIS_EVI |
µmol/m2/second |
Gross Ecosystem CO2 Exchange= -1*GPP, calculated using MODIS EVI. Negative GEE indicates carbon uptake by vegetation. |
|
GEE_OCO2_SIF |
µmol/m2/second |
Gross Ecosystem CO2 Exchange= -1*GPP, calculated using OCO-2 SIF. Negative GEE indicates carbon uptake by vegetation. |
|
hour |
|
Starting time of the timestep (3-hourly, UTC) |
|
latitude |
decimal degrees |
Latitude |
|
longitude |
decimal degrees |
Longitude |
|
RESP |
umol/m2/second |
Respiration CO2= Autotrophic + Heterotrophic respitration |
|
tstep |
|
Timestep |
|
vegclasses |
|
Eight (8) vegetation classes: 1) evergreen forest; 2) deciduous forest; 3) mixed forest; 4) shrubs; 5) graminoid tundra; 6) shrub tundra; 7) wetland; and 8) water. Aggregated from the Circumpolar Arctic Vegetation Map (CAVM; Walker et al., 2005; 2016) & Synergistic Land Cover Product (SYNMAP; Jung et al., 2006): |
|
VEGF |
% |
Fractional cover by 8 vegetation classes as aggregated from the Circumpolar Arctic Vegetation Map (CAVM; Walker et al., 2016) & Synergistic Land Cover Product (SYNMAP; Jung et al., 2006) |
Application and Derivation
The data can be used to calculate 3-hourly estimates of net ecosystem exchange (NEE) of CO2 as the sum of respiration and GEE. Examining trends in NEE and its drivers may provide insights into how the North American high-latitude carbon cycle responds to changing environmental conditions. For example, analysis of model output by PolarVPRM for the period from 2001-2012 indicated that warming air temperatures and drought stress in forests increased growing season rates of respiration, and decreased rates of net carbon uptake by vegetation when air temperatures exceeded optimal temperatures for photosynthesis. Concurrent increases in growing season length at Arctic tundra sites allowed for increases in photosynthetic uptake over time by tundra vegetation. PolarVPRM estimated that the North American high-latitude region changed from a carbon source (2001-2004) to a carbon sink (2005-2010) and again to a source (2011-2012) in response to changing environmental conditions (Luus et al, 2017).
Data produced by the PolarVPRM is also currently being used to scale up circumpolar eddy co-variance observations of NEE, and as a priori estimates of Alaskan NEE for Lagrangian modeling of aircraft CO2 concentration observations as part of the CARVE project.
Quality Assessment
A comprehensive error analysis of PolarVPRM was conducted using a first-order Taylor expansion based approach (Lin et al., 2011). The model was validated against eddy co-variance (EC) observations from nine North American sites, of which three were used in model calibration. Comparison of NEE from PolarVPRM and three other models to NEE from EC observations indicated that PolarVPRM displayed the strongest statistical agreement. Details of the uncertainty analysis are presented in Luus et al. (2017).
Data Acquisition, Materials, and Methods
The PolarVPRM presents a high-latitude formulation of the Vegetation Photosynthesis and Respiration Model (VPRM; Mahadevan et al., 2008) that uses remote sensing observations to calculate terrestrial biospheric carbon exchange, net ecosystem exchange (NEE), as the sum of respiration (R) and gross ecosystem exchange (GEE):
NEE = GEE + R
Gross ecosystem exchange
GEE, the photosynthetic uptake of carbon by vegetation, is calculated according to remote sensing-based estimates of incoming shortwave radiation (SW), air temperature (Tair), land surface water index (LSWI), and estimates of the fraction of photosynthetically active radiation absorbed by photosynthetically active vegetation (FAPARPAV). SW is expressed as photosynthetically active radiation (PAR), where PAR = 1.98 x SW (Lin et al., 2011). LSWI is derived from the Moderate Resolution Imaging Spectroradiometer (MODIS) surface reflectance product (MOD09). FAPARPAV is estimated from the MODIS Enhanced Vegetation Index (EVI; MOD13).
GEE is limited during snow season when EVI is decreased and when air temperatures are sub-optimal. These limits are implemented through the use of dimensionless scaling variables Tscale and Pscale. LSWI is also implemented as a limitation on GEE (Wscale) for forested regions north of 55°N.
Pscale = (1 + LSWI) / 2
Wscale = (1 + LSWI) / (1 + LSWImax)
Tscale = (Tair – Tmin)(Tair – Tmax) / ((Tair – Tmin)(Tair – Tmax) – (Tair – Topt)2)
GEE = -1 * (λ * Tscale * Wscale * Pscale) * FAPARPAV * (1 / (1 + (PAR / PAR0))) * PAR
- λ refers to the theoretical maximum light-use efficiency at low-light levels, but functions in practice as a combined light-use efficiency and scaling parameter.
- PAR0 is the half-saturation value of PAR.
- For all vegetation classes, Tmax = 40°C and Tmin = 0°C. For non-arctic vegetation classes, Topt = 20°C. For barren/wetland regions, Topt = 10°C; and over shrub tundra and graminoid tundra, Topt = 15°C.
- LSWImax refers to the maximum annual pixel-specific LSWI.
Respiration
During growing season, respiration (R) is more heavily influenced by above-ground than below-ground temperatures. So, PolarVPRM simulates R as a function of air temperature.
The snow and growing seasons are defined according to MODIS observations of fractional snow cover area (SCA). Snow season (SCA ≥ 50%) respiration is calculated as linear function of soil temperature, and growing season respiration (SCA < 50%) is calculated as a piecewise linear function of air temperature:
When SCA < 50%, R = α * Tair + β, and, when SCA ≥ 50%, R = α * Tsoil + β.
Regression coefficients α and β describe the linear association between growing season respiration and air temperature.
For more information and detailed model description see Luus et al. (2017).
Data Access
These data are available through the Oak Ridge National Laboratory (ORNL) Distributed Active Archive Center (DAAC).
CARVE Modeled Gross Ecosystem CO2 Exchange and Respiration, Alaska, 2012-2014
Contact for Data Center Access Information:
- E-mail: uso@daac.ornl.gov
- Telephone: +1 (865) 241-3952
References
Jung, M., K. Henkel, M. Herold, and G. Churkina (2006). Exploiting synergies of global land cover products for carbon cycle modeling. Remote Sens. Environ., 101: 534–553.
Lin, J., M. Pejam, E. Chan, S. Wofsy, E. Gottlieb, H. Margolis, and J. McCaughey (2011). Attributing uncertainties in simulated biospheric carbon fluxes to different error sources. Global Biogeochem. Cy., 25, GB2018.
Luus, K. A. and Lin, J. C. (2015) The Polar Vegetation Photosynthesis and Respiration Model: a parsimonious, satellite-data-driven model of high-latitude CO2exchange, Geosci. Model Dev., 8, 2655-2674. http://dx.doi.org/10.5194/gmd-8-2655-2015
Luus, K.A., R. Commane, N.C. Parazoo, J. S. Benmergui, S. E. Euskirchen, C. Frankenberg, J. Joiner, J. Lindaas, C.E. Miller, W.C. Oechel, D. Zona, S. Wofsy, and J.C. Lin. 2017. Tundra photosynthesis captured by satellite-observed solar-induced chlorophyll fluorescence. Geophys. Res. Lett. http://dx.doi.org/10.1002/2016GL070842 .
Mahadevan, P., S. Wofsy, D. Matross, X. Xiao, A. Dunn, J. Lin, C. Gerbig, J. Munger, V. Chow, and E. Gottlieb (2008). A satellite-based biosphere parameterization for net ecosystem CO2 exchange: Vegetation Photosynthesis and Respiration Model (VPRM). Global Biogeochem. Cy., 22, GB2005.
Walker, D.A., and M.K. Raynolds. 2016. Pre-ABoVE: Circumpolar Arctic Vegetation, Geobotanical, Physiographic Data, 1982-2003. ORNL DAAC, Oak Ridge, Tennessee, USA. http://dx.doi.org/10.3334/ORNLDAAC/1323
Walker, D.A., Raynolds, M.K., Daniels, F.J.A., Einarsson, E., Elvebakk, A., Gould, W.A., Katenin, A.E., Kholod, S.S., Markon, C.J., Melnikov, E.S., Moskalenko, N.G., Talbot, S.S., Yurtsev, B.A. and the other members of the CAVM Team. (2005). The circumpolar Arctic vegetation map. J. Veg. Sci., 16: 267–282.