Documentation Revision Date: 2022-05-06
Dataset Version: 1.1
Summary
There are 87 TAR/GZIP files included in this data set containing a total of 666,433 WRF-STILT Footprint files in NetCDF format.
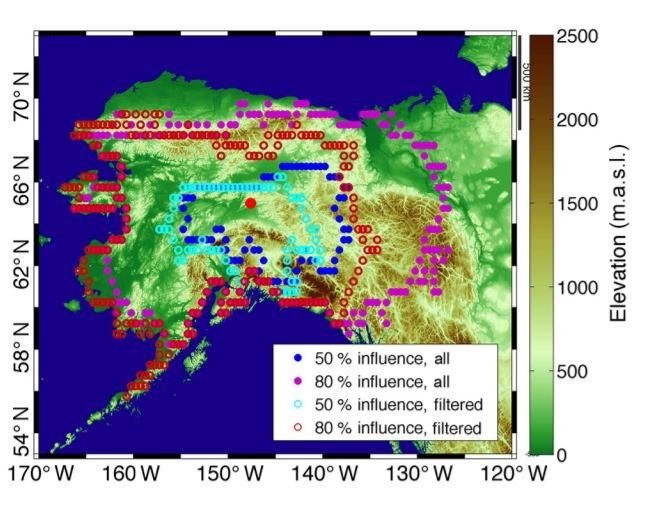
Figure 1. Surface contours (50% --- blue; 80% --- purple) for the average WRF-STILT influence functions (mid-afternoon averages 2012-2014) show CO2 and CH4 measurements from the CARVE tower have a high sensitivity to the boreal forests and lowlands of interior Alaska. Cyan and red circles are shown for the footprints after filtering (from Karion et al., 2016).
Citation
Henderson, J., J.B. Miller, T. Nehrkorn, R.Y-W. Chang, C. Sweeney, N. Steiner, S.C. Wofsy, and C.E. Miller. 2017. CARVE: L4 Gridded Footprints from WRF-STILT model, 2012-2016. ORNL DAAC, Oak Ridge, Tennessee, USA. https://doi.org/10.3334/ORNLDAAC/1431
Table of Contents
- Dataset Overview
- Data Characteristics
- Application and Derivation
- Quality Assessment
- Data Acquisition, Materials, and Methods
- Data Access
- References
- Dataset Revisions
Dataset Overview
Project: Carbon in Arctic Reservoirs Vulnerability Experiment (CARVE)
The Carbon in Arctic Reservoirs Vulnerability Experiment (CARVE) is a NASA Earth Ventures (EV-1) investigation designed to quantify correlations between atmospheric and surface state variables for Alaskan terrestrial ecosystems through intensive seasonal aircraft campaigns, ground-based observations, and analysis sustained over a 5-year mission. CARVE collected detailed measurements of greenhouse gases on local to regional scales in the Alaskan Arctic and demonstrated new remote sensing and improved modeling capabilities to quantify Arctic carbon fluxes and carbon cycle-climate processes.
Related Data:
These modeled footprint data were based on input from the CARVE: L4 Gridded Particle Trajectories for WRF-STILT model, 2012-2016 data available from ORNL DAAC. The relationship between particle files and footprint files is outlined in the companion file 'carve_wrf-stilt_inventory.csv'.
A full list of CARVE data products is available at: https://carve.ornl.gov/dataproducts.html
Data Characteristics
Spatial Coverage: Campaign flights and station observations within the CARVE domain
Spatial Resolution: 0.25-degree for foot1 data; 0.1-degree for footnearfield1 data
Temporal Coverage: 20120523 - 20160428
Temporal Resolution: Hourly
Study Area (coordinates in decimal degrees)
|
Site |
Westernmost Longitude |
Easternmost Longitude |
Northernmost Latitude |
Southernmost Latitude |
| CARVE Domain | -180 | 180 | 90 | 30 |
Data File Information
The TAR/GZIP files (*.tar.gz) contain NetCDF files representing gridded footprints from WRF-STILT simulations for one particle receptor location. Each file aggregates particle footprints on a lat/lon/time grid starting at the STILT simulation start time.
Notes about TAR/GZIP files
- If convect is present in the filename, STILT was run with convective fluxes active. If noconvect is present, or if there is no label, then fluxes are not active (standard for simulations through 2015).
- Simulations for 2012 were run with WRF v3.4.1. Simulations for 2013 were run with both v3.4.1 and v3.5.1. Subsequent years used only v3.5.1.
- CARVE-CAN refers to use of the WRF CARVE-CAN domain that was available after 2014.
- Filenames containing freum* were generated going back 15 days instead of the usual 10.
The first surface influence field, represented by the foot1 variable in the NetCDF files, provides 10 days of surface influence representing the response of the receptor to a unit surface emission (ppm/nmol m-2 s-1) of CO2 in each 0.25- x 0.25-degree grid cell within the whole area of coverage (30N to 90N, 180E to 180W) at hourly temporal resolution.
The second surface influence field, represented by the footnearfield1 variable in the NetCDF files, provides 24 hours of surface influence representing the response of the receptor to a unit surface emission (ppm/nmol m-2 s-1) of CO2 in each 0.1- x 0.1-degree grid cell within a small region close to the measurement location at hourly temporal resolution.
The WRF-STILT model as run for this project is described further in Henderson et al. (2015). File naming convention for WRF-STILT footprint files is described in Table 1.
Table 1. Naming convention for NetCDF files generated by WRF-STILT.
Example file name: foot2013x06x25x04x00x65.1330Nx147.4539Wx00003.nc
| Name element | Example value | Units |
| Year | 2013 | YYYY |
| Month | 06 | MM |
| Day | 25 | DD |
| Hour | 04 | hh (UTC) |
| Minute | 00 | mm (UTC) |
| Latitude | 65.1330N | decimal degrees |
| Longitude | 127.4539W | decimal degrees |
| Height A.G.L. | 00003 | m |
For example, the above file contains the modeled particle footprints for June 25, 2013 at 4:00 UTC. The observation was taken at 65.1330N, 127.4539W at 3 m above ground level.
Data Variables
Table 2. Data variables in each NetCDF file. Fill values or missing data were set to -1.0E34 for all variables.
| Variable name | Units | Description |
| foot1 | ppm per (umol m-2 s-1) | gridded STILT footprint |
| foot1date | days | days since 2000-01-01 00:00:00 UTC |
| foot1hr | hours | hours back from STILT start time |
| foot1lat | degrees_north | degrees latitude of center of grid cells |
| foot1lon | degrees_east | degrees longitude of center of grid cells |
| footnearfield1 | ppm per (umol m-2 s-1) | gridded STILT footprint |
| footnearfield1date | days | days since 2000-01-01 00:00:00 UTC |
| footnearfield1hr | hours | hours back from STILT start time |
| footnearfield1lat | degrees_north | degrees latitude of center of grid cells |
| footnearfield1lon | degrees_east | degrees longitude of center of grid cells |
| nchar | identifier string |
Application and Derivation
WRF-STILT footprints support accurate estimates of CO2 and CH4 surface-atmosphere fluxes using CARVE flight and tower observations. Simulated CO2 mole fractions from the PolarVPRM model based on WRF-STILT footprints show strong agreement with tower observations, suggesting that the WRF-STILT model does a good job representing the meteorology of the region (Karion et al., 2016).
Quality Assessment
Preliminary analysis in support of CARVE showed good overall agreement between WRF outputs and quality-controlled surface and radiosonde observations.
Analysis of STILT footprints showed realistic seasonal variability and good agreement with tower observations, indicating that WRF-STILT footprints are of high quality and support accurate estimates of CO2 and CH4 surface-atmosphere fluxes using CARVE observations (Henderson et al. 2015).
Data Acquisition, Materials, and Methods
CARVE Flights
These data represent one part of the data collected by the Carbon in Arctic Reservoirs Vulnerability Experiment (Miller et al, 2012). A C-23 Sherpa aircraft made frequent flights out of Fairbanks, Alaska between March and November over multiple years, observing the spring thaw, summer draw-down, and fall refreeze of the Arctic growing season. Flights concentrate observations on three study domains: the North Slope, the interior, and the Yukon River valley. North Slope flights cover regions of tundra and continuous permafrost and were anchored by flux towers in Barrow, Atqasuk, and Ivotuk. Flights to Prudhoe Bay characterize the CO2 and CH4 emissions from oil and natural gas processing plants. Flights over interior Alaska sample discontinuous permafrost, boreal forests, and wetlands. A complete list of CARVE flights can be found at: https://carve.ornl.gov/flights.html. Flight paths and atmospheric gas concentrations for CARVE surveys can be visualized through the CARVE Flight Data Visualization Tool (http://carve.ornl.gov/visualize).
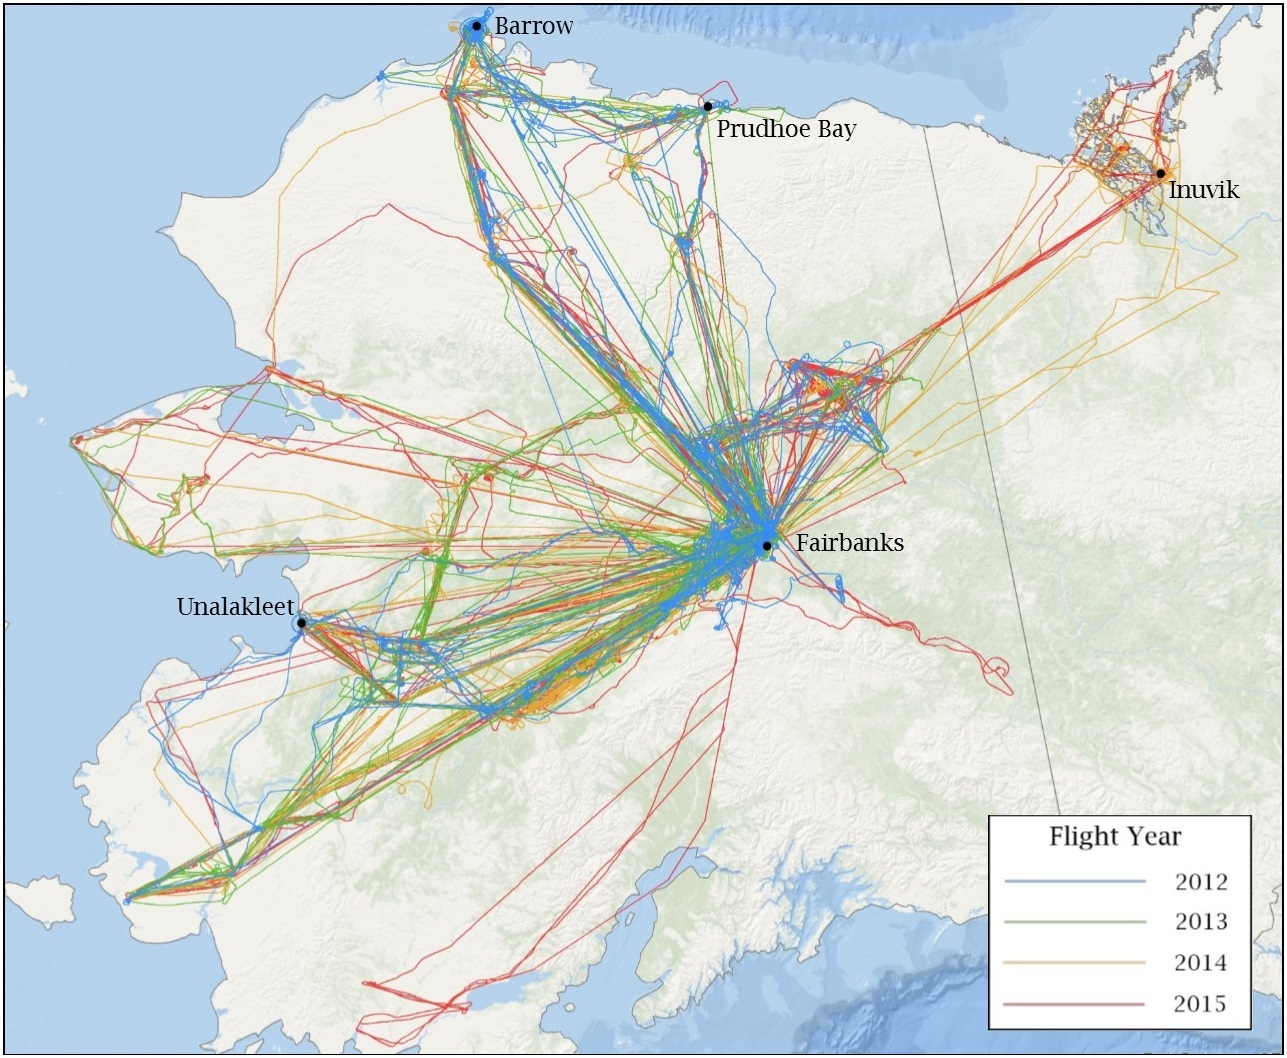
Figure 2. CARVE flights during 2012-2015 delivered measurements over continuous and discontinuous permafrost regimes.
The CARVE aircraft carried a remote sensing and atmospheric sampling payload consisting of the following instruments: a Fourier transform spectrometer (FTS), and an in situ gas analyzer suite (ISGAS) with a gas analyzer and flask sampling system (see https://carve.ornl.gov/documentation.html). All instruments were controlled by a master computer system (Data Acquisition and Distribution System, DADS). DADS also recorded GPS data (Lat, Lon, altitude), aircraft pitch, roll, and yaw, as well as basic meteorological data from onboard instruments.
WRF-STILT Simulations
CARVE aircraft positions and various flux tower locations were treated as receptors in a Stochastic Time-Inverted Lagrangian Transport (STILT) model coupled with meteorology fields from the polar variant of the Weather and Research Forecasting (WRF; Skamarock et al., 2008) model, in order to model the land surface influence on observed atmospheric constituents. The atmospheric model was configured to generate high-quality, high-resolution meteorological fields over Arctic and boreal Alaska.
The WRF-STILT coupled model is described in Nehrkorn et al. (2010).
STILT applies a Lagrangian particle dispersion model backwards in time from a measurement location (the "receptor" location), to create the adjoint of the transport model in the form of a "footprint" field (Nehrkorn et al., 2010; Henderson et al., 2015). The footprint, with units of mixing ratio (ppm --- CO2; ppb --- CH4) per (umol m-2 s-1), quantifies the influence of upwind surface fluxes on concentrations measured at the receptor and is computed by counting the number of particles in a surface-influenced volume and the time spent in that volume. Gridded footprints are provided as NetCDF files.
Data Access
These data are available through the Oak Ridge National Laboratory (ORNL) Distributed Active Archive Center (DAAC).
CARVE: L4 Gridded Footprints from WRF-STILT model, 2012-2016
Contact for Data Center Access Information:
- E-mail: uso@daac.ornl.gov
- Telephone: +1 (865) 241-3952
References
Henderson, J.M., J. Eluszkiewicz, M.E. Mountain, T. Nehrkorn, R.Y.-W. Chang, A. Karion, J.B. Miller, C. Sweeney, N. Steiner, S.C. Wofsy, and C.E. Miller. 2015. Atmospheric transport simulations in support of the Carbon in Arctic Reservoirs Vulnerability Experiment (CARVE). Atmos. Chem. Phys. 15:4093-4116.
Karion, A., C. Sweeney, J.B. Miller, A.E. Andrews, R. Commane, S. Dinardo, J.M. Henderson, J. Lindaas, J.C. Lin, K.A. Luus, T. Newberger, P. Tans, S.C. Wofsy, S. Wolter, and C.E. Miller. 2016. Investigating Alaskan methane and carbon dioxide fluxes using measurements from the CARVE tower. Atmos. Chem. Phys. 16:5383-5398.
Miller, C.E., Dinardo, S.J. et al. (2012). CARVE: The Carbon in Arctic Reservoirs Vulnerability Experiment., 2012 IEEE Aerospace Conference. http://dx.doi.org/10.1109/AERO.2012.6187026
Nehrkorn, T., J. Eluszkiewicz, S.C. Wofsy, J.C. Lin, C. Gerbig, M. Longo, and S. Freitas. 2010. Coupled weather research and forecasting-stochastic time-inverted lagrangian transport (WRF-STILT) model. Meteorol. Atmos. Phys. 107:51-64. doi:10.1007/s00703-010-0068-x
Skamarock, W.C. and J.B. Klemp. 2008. A time-split nonhydrostatic atmospheric model for weather research and forecasting applications. Journal of Computational Physics, 227(7): 3465-3485.
Dataset Revisions
This dataset was revised on May 6, 2022 to rename 10 data files that contained the plus sign in their filenames. The plus sign in each file was replaced with an underscore. No data vales in the files were changed.