Documentation Revision Date: 2016-12-09
Data Set Version: V1
Summary
There are 14 data files in comma-separated (*.csv) text format with this data set, one per year of data collected at each of the towers.
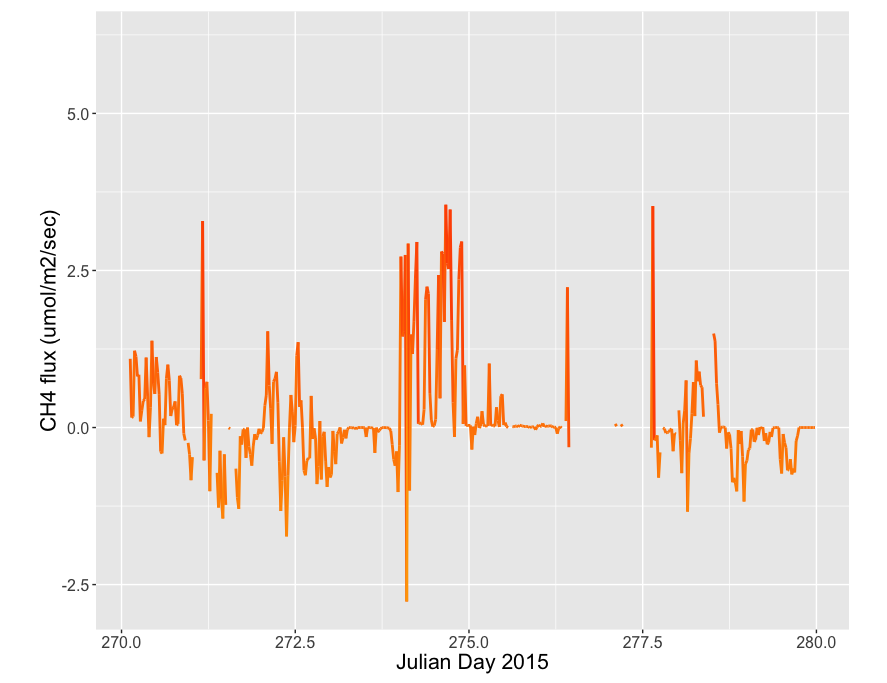
Micromols of methane per square meter per second observed at the Ivotuk site between Oct. 2-7, 2015.
Citation
Oechel, W., J. Verfaillie, G. Vourlitis, and R. Zulueta. 2016. CARVE: L1 In-situ Carbon and CH4 Flux and Meteorology at EC Towers, Alaska, 2011-2015. ORNL DAAC, Oak Ridge, Tennessee, USA. http://dx.doi.org/10.3334/ORNLDAAC/1424
Table of Contents
- Data Set Overview
- Data Characteristics
- Application and Derivation
- Quality Assessment
- Data Acquisition, Materials, and Methods
- Data Access
- References
Data Set Overview
Project: Carbon in Arctic Reservoirs Vulnerability Experiment (CARVE)
The Carbon in Arctic Reservoirs Vulnerability Experiment (CARVE) is a NASA Earth Ventures (EV-1) investigation designed to quantify correlations between atmospheric and surface state variables for Alaskan terrestrial ecosystems through intensive seasonal aircraft campaigns, ground-based observations, and analysis sustained over a 5-year mission. CARVE collected detailed measurements of greenhouse gases on local to regional scales in the Alaskan Arctic and demonstrated new remote sensing and improved modeling capabilities to quantify Arctic carbon fluxes and carbon cycle-climate processes. CARVE science fills a critical gap in Earth science knowledge and satisfies high priority objectives across NASA’s Carbon Cycle and Ecosystems, Atmospheric Composition, and Climate Variability & Change focus areas as well as the Air Quality and Ecosystems elements of the Applied Sciences program. CARVE data also complements and enhances the science return from current NASA and non-NASA sensors.
Related Data:
A full list of CARVE data products is available at: https://carve.ornl.gov/dataproducts.html
Data Characteristics
Spatial Coverage: Atqasuk, Barrow, and Ivotuk eddy covariance towers, North Slope, Alaska
Spatial Resolution: Point resolution
Temporal Coverage: 20110530 - 20160107
Temporal Resolution: half-hourly
Study Area (coordinates in decimal degrees)
|
Site |
Westernmost Longitude |
Easternmost Longitude |
Northernmost Latitude |
Southernmost Latitude |
|
Atqasuk (ATQ) |
-157.409 |
-157.409 |
70.470 |
70.470 |
|
Barrow (BRW) |
-156.597 |
-156.597 |
71.323 |
71.323 |
|
Ivotuk (IVO) |
-155.748 |
-155.748 |
68.486 |
68.486 |
Data File Information
All data are stored in comma separated value (*.csv) text files. The value -9999 is used to denote missing values. Filenames contain the indicate the tower operator (San Diego State University), 3-letter tower code, and year of observations. Ex: SDSU_IVO_2012.csv
Table 1. Column headers, description, units, and instrument from Atqasuk (ATQ), Barrow (BRW), and Ivotuk (IVO) eddy covariance towers.
Note: Quality flags are: 0 = observation value; 1 = interpolated value
| Column Header | Description | Units | Instrument |
| BP | Barometric pressure | mbar/10 | CS106 |
| CH4_Flux_7700 | CH4 flux | umol m-2 s-1 | LI-7700 |
| CH4_Flux_gf_7700 | Gap-filled CH4 flux | umol m-2 s-1 | LI-7700 |
| CH4_q_7700 | Quality flag | * | |
| CH4_Flux_LGR | CH4 flux | umol m-2 s-1 | LGR FGGA |
| CH4_Flux_gf_LGR | Gap-filled CH4 flux | umol m-2 s-1 | LGR FGGA |
| CH4_q_LGR | Quality flag | * | |
| CO2_Flux_7200 | CO2 flux | umol m-2 s-1 | LI-7200 |
| CO2_Flux_gf_7200 | Gap-filled CO2 flux | umol m-2 s-1 | LI-7200 |
| CO2_q_7200 | Quality flag | ** | |
| CO2_Flux_LGR | CO2 flux | umol m-2 s-1 | LGR FGGA |
| CO2_Flux_gf_LGR | Gap-filled CO2 flux | umol m-2 s-1 | LGR FGGA |
| CO2_q_LGR | Quality flag | ** | |
| Date | Date | yyyy-mm-dd HH:MM | |
| Day | Day of year and decimal hour | DOY.H | |
| Dsnow | Snow depth | m | SR50a |
| ER_7200 | Ecosystem respiration | umol m-2 s-1 | LI-7200 |
| ER_LGR | Ecosystem respiration | umol m-2 s-1 | LGR FGGA |
| G_1 | Ground heat flux profile 1 | Wm-2 | HFT3 |
| G_2 | Ground heat flux profile 2 | Wm-2 | HFT3 |
| G_3 | Ground heat flux profile 3 | Wm-2 | HFT3 |
| G_4 | Ground heat flux profile 4 | Wm-2 | HFT3 |
| Global_radiation | Solar radiation | Wm-2 | Delta T v3 |
| GPP_7200 | Gross primary production | umol m-2 s-1 | LI-7200 |
| GPP_LGR | Gross primary production | umol m-2 s-1 | LGR FGGA |
| H_7200 | Sensible heat flux | Wm-2 | CSAT-3 |
| H_LGR | Sensible heat flux | Wm-2 | CSAT-3 |
| H2O_Flux_7200 | H2O flux | umol m-2 s-1 | LI-7200 |
| H2O_Flux_LGR | H2O flux | umol m-2 s-1 | LGR FGGA |
| H2O_Flux_gf_LGR | Gap-filled H2O flux | umol m-2 s-1 | LGR FGGA |
| H2O_q_LGR | Quality flag | ** | |
| LE_Flux_7200 | Latent energy flux | Wm-2 | LI-7200 |
| LE_Flux_gf_7200 | Gap-filled latent energy flux | Wm-2 | LI-7200 |
| LE_Flux_q_7200 | Quality flag | ** | |
| LE_LGR | Latent energy flux | Wm-2 | LGR FGGA |
| LE_Flux_gf_LGR | Gap-filled latent energy flux | Wm-2 | LGR FGGA |
| LE_q_LGR | Quality flag | ** | |
| NEE_7200 | Net ecosystem exchange | g m-2 s-1 | LI-7200 |
| NEE_LGR | Net ecosystem exchange | g m-2 s-1 | LGR FGGA |
| P1_SWC_5 | Soil moisture at -5cm, profile 1 | VWC | CS616 |
| P1_SWC_10 | Soil moisture at -10cm, profile 1 | VWC | CS616 |
| P1_SWC_15 | Soil moisture at -15cm, profile 1 | VWC | CS616 |
| P1_SWC_20 | Soil moisture at -20cm, profile 1 | VWC | CS616 |
| P1_SWC_30 | Soil moisture at -30cm, profile 1 | VWC | CS616 |
| P2_SWC_5 | Soil moisture at -5cm, profile 2 | VWC | CS616 |
| P2_SWC_10 | Soil moisture at -10cm, profile 2 | VWC | CS616 |
| P2_SWC_15 | Soil moisture at -15cm, profile 2 | VWC | CS616 |
| P2_SWC_20 | Soil moisture at -20cm, profile 2 | VWC | CS616 |
| P2_SWC_30 | Soil moisture at -30cm, profile 2 | VWC | CS616 |
| P3_SWC_5 | Soil moisture at -5cm, profile 3 | VWC | CS616 |
| P3_SWC_15 | Soil moisture at -15cm, profile 3 | VWC | CS616 |
| P3_SWC_30 | Soil moisture at -30cm, profile 3 | VWC | CS616 |
| PARdown | Photosynthetically active radiation incoming | µmols-1m-2 | LI-190SB |
| PARup | Photosynthetically active radiation outgoing | µmols-1m-2 | LI-190SB |
| PPT | Precipitation | mm | TE525WS |
| RH | Relative humidity | % | HMP-45c |
| Rnet | Net radiation | Wm-2 | REBS Q7 |
| Rsolar | Solar radiation | Wm-2 | CMP3 |
| SoilT1_Surf | Soil temperature at surface, profile 1 | C | Type E thermocouple |
| SoilT1_5 | Soil temperature at -5cm, profile 1 | C | Type E thermocouple |
| SoilT1_15 | Soil temperature at -15cm, profile 1 | C | Type E thermocouple |
| SoilT1_30 | Soil temperature at -30cm, profile 1 | C | Type E thermocouple |
| SoilT1_40 | Soil temperature at -40cm, profile 1 | C | Type E thermocouple |
| SoilT2_Surf | Soil temperature at surface, profile 2 | C | Type E thermocouple |
| SoilT2_5 | Soil temperature at -5cm, profile 2 | C | Type E thermocouple |
| SoilT2_15 | Soil temperature at -15cm, profile 2 | C | Type E thermocouple |
| SoilT2_30 | Soil temperature at -30cm, profile 2 | C | Type E thermocouple |
| SoilT2_40 | Soil temperature at -40cm, profile2 | C | Type E thermocouple |
| SoilT3_Surf | Soil temperature at surface, profile 3 | C | Type E thermocouple |
| SoilT3_5 | Soil temperature at -5cm, profile 3 | C | Type E thermocouple |
| SoilT3_15 | Soil temperature at -15cm, profile 3 | C | Type E thermocouple |
| SoilT3_30 | Soil temperature at -30cm, profile 3 | C | Type E thermocouple |
| SoilT3_40 | Soil temperature at -40cm, profile 3 | C | Type E thermocouple |
| SoilT4_Surf | Soil temperature at surface, profile 3 | C | Type E thermocouple |
| SoilT4_5 | Soil temperature at -5cm, profile 4 | C | Type E thermocouple |
| SoilT4_15 | Soil temperature at -15cm, profile 4 | C | Type E thermocouple |
| SoilT4_30 | Soil temperature at -30cm, profile 4 | C | Type E thermocouple |
| SoilT4_40 | Soil temperature at -40cm, profile 4 | C | Type E thermocouple |
| Tair | Air temperature | C | HMP-155A |
| Tsurf | Ground surface temperature | C | SI-111 |
| u*_7200 | Friction velocity | ms-1 | LI-7200 |
| u*_LGR | Friction velocity | ms-1 | LGR FGGA |
| WD | Wind direction, degrees from north | ° | Young 05103 |
| WS | Wind speed | ms-1 | Young 05103 |
* Gap filling done using methods described in Watts et al, 2014
** Gap filling done with http://www.bgc-jena.mpg.de/~MDIwork/eddyproc/method.php
Application and Derivation
These data are used to monitor seasonal variation of CO2, H2O, and CH4 fluxes and the inter-annual differences in Arctic landscapes. The data may also be used to identify patterns in Arctic-boreal CO2 and CH4 fluxes to determine environmental drivers of GPP v. ecosystem respiration and changes in landscape carbon sink and source activity. Measurements from eddy covariance towers are also necessary to calibrate and validate ecosystem models.
Quality Assessment
Gap-filling of the observations from the three towers was performed using a satellite data driven modeling approach described in Watts et al. (2014). Gap-filled data are susceptible to model inaccuracies. CH4 gap-filling used a method devised by the Max Planck Institute for Biogeochemistry (http://www.bgc-jena.mpg.de/~MDIwork/eddyproc/method.php). Gap-filled data points are denoted by a value of 1 in the quality flag columns of the data files.
Data Acquisition, Materials, and Methods
Flux data at each of the sites were calculated at half-hourly intervals following standard eddy covariance data processing procedures (Baldocchi et al., 1988). Carbon dioxide, methane, water vapor, sensible heat and latent energy fluxes were estimated using measurements from LI-7200 infrared open-path gas analyzers (LI-COR Biosciences) and Fast Greenhouse Gas Analyzers (Los Gatos Research) instruments. Environmental measurements include temperature and relative humidity (HMP45c; Vaisala), photosynthetically active radiation (LI-190SB; LI-COR Biosciences) soil temperature (Type-E thermocouples; Omega), net radiation (Q7; Radiation Energy Balance Systems), ground heat fluxes (HFT3; Radiation Energy Balance Systems), wind speed and direction (03001 Wind Sentry Set; R.M. Young), and precipitation (TE525WS; Texas Electronics).
Eddy covariance sites
Atqasuk
The Atqasuk tower site is located 100 km south of Barrow. Site elevation is 25 meters ASL and instrument heights are at 2 meters. Vegetation at the site is a variety of moist-wet coastal sedge tundra and moist-tussock tundra surfaces in the more well-drained upland. The International Geosphere-Biosphere Programme (IGBP) land cover is classified as permanent wetlands.
Barrow
The Barrow tower site is located 10 km east of the town of Barrow, AK, adjacent to the NOAA CMDL Laboratory. Site elevation is 4 meters ASL and instrument heights are at 5 meters. The vegetation is mature in an unmanaged and undisturbed Arctic tundra environment and consist of wet sedges, grasses, moss, and assorted lichens. The IGBP land cover is classified as permanent wetlands. The local landscape surrounding the site has a history absent of any disturbances and the terrain was not heavily glaciated during the last period of glaciation. The Barrow tower is pictured in Figure 2 below.
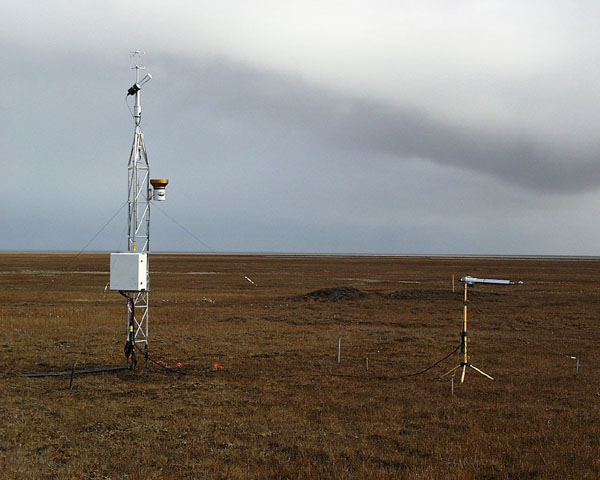
Figure 2. The eddy covariance site at Barrow, Alaska
Ivotuk
The Ivotuk tower site is located 300 km south of Barrow, Alaska, in polar tundra at the foothills of the Brooks Range. Site elevation is 579 meters ASL and instrument height is at 4 meters. The IGBP land cover is classified as permanent wetlands and vegetation of the area is comprised of tussock sedge, dwarf-shrub, and moss tundra.
Data Access
These data are available through the Oak Ridge National Laboratory (ORNL) Distributed Active Archive Center (DAAC).
CARVE: L1 In-situ Carbon and CH4 Flux and Meteorology at EC Towers, Alaska, 2011-2015
Contact for Data Center Access Information:
- E-mail: uso@daac.ornl.gov
- Telephone: +1 (865) 241-3952
References
Baldocchi, D.D., B. B. Hicks, and T. P. Meyers. 1988. Measuring biosphere-atmosphere exchanges of biologically related gases with micrometeorological methods. Ecology 69, 1331–1340.
Watts, J.D., J.S. Kimball, F.J.W. Parmentier, T. Sachs, J. Rinne, D. Zona, W. Oechel, T. Tagesson, M. Jackowicz-Korczynski, and M. Aurela. 2014. A satellite data driven biophysical modeling approach for estimating northern peatland and tundra CO2 and CH4 fluxes. Biogeosciences 11:1961-1980.