Documentation Revision Date: 2018-03-21
Data Set Version: 1
Summary
This dataset includes three files in CSV format and two files in NetCDF format.
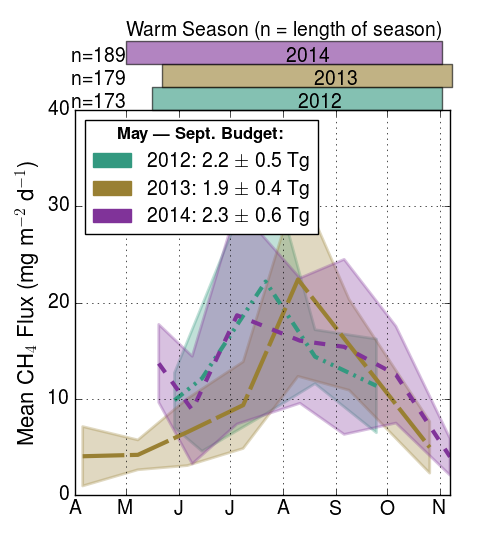
Figure 1. Monthly mean CH4 flux estimates. Values are centered on the mean measurement date for a given month and the shaded regions are the standard error of the mean. The bar plot above the graph marks the days when average soil temperatures from NARR were above zero (from Hartery et al. 2018).
Citation
Hartery, S., R. Commane, J.O.W. Lindaas, C. Sweeney, J. Henderson, M. Mountain, N. Steiner, K.C. McDonald, S.J. Dinardo, C.E. Miller, S.C. Wofsy, and R.Y-W. Chang. 2018. CARVE: Ecosystem Scale CH4 Emission Derived from Aircraft Observations 2012-2014. ORNL DAAC, Oak Ridge, Tennessee, USA. https://doi.org/10.3334/ORNLDAAC/1558
Table of Contents
- Data Set Overview
- Data Characteristics
- Application and Derivation
- Quality Assessment
- Data Acquisition, Materials, and Methods
- Data Access
- References
Data Set Overview
This dataset provides methane flux estimates derived from airborne measurements collected over Alaska and the western Yukon Territory during the Carbon in Arctic Reservoirs Vulnerability Experiment (CARVE) between 2012 and 2014. Methane fluxes were calculated using a combination of atmospheric profiles and lagrangian transport modeling. The methane flux estimates were used in a simple linear regression model to estimate the fluxes from the tundra and boreal ecosystems. Methane fluxes were also used with a combination of environmental variables to derive a statistical relationship between domain-wide flux and soil temperature. Soil temperature products from North American Regional Reanalysis and derived parameters from a Boltmann-Arrhenius model were used to model methane flux and related uncertainties within the domain at monthly and daily frequencies.
Project: Carbon in Arctic Reservoirs Vulnerability Experiment (CARVE)
The Carbon in Arctic Reservoirs Vulnerability Experiment (CARVE) is a NASA Earth Ventures (EV-1) investigation designed to quantify correlations between atmospheric and surface state variables for Alaskan terrestrial ecosystems through intensive seasonal aircraft campaigns, ground-based observations, and analysis sustained over a 5-year mission. CARVE collected detailed measurements of greenhouse gases on local to regional scales in the Alaskan Arctic and demonstrated new remote sensing and improved modeling capabilities to quantify Arctic carbon fluxes and carbon cycle-climate processes. CARVE science fills a critical gap in Earth science knowledge and satisfies high priority objectives across NASA’s Carbon Cycle and Ecosystems, Atmospheric Composition, and Climate Variability & Change focus areas as well as the Air Quality and Ecosystems elements of the Applied Sciences program. CARVE data also complements and enhances the science return from current NASA and non-NASA sensors.
Related Publication:
Hartery, S., Commane, R., Lindaas, J., Sweeney, C., Henderson, J., Mountain, M., Steiner, N., McDonald, K., Dinardo, S. J., Miller, C. E., Wofsy, S. C., and Chang, R. Y.-W. 2018. Estimating regional-scale methane flux and budgets using CARVE aircraft measurements over Alaska, Atmos. Chem. Phys., 18, 185-202, https://doi.org/10.5194/acp-18-185-2018
Related Data:
A full list of data products from the CARVE campaign is available at: https://carve.ornl.gov/dataproducts.html
Budney, J.W., R.Y-W. Chang, R. Commane, B.C. Daube, A. Dayalu, S.J. Dinardo, E.W. Gottlieb, A. Karion, J.O.W. Lindaas, C.E. Miller, J.B. Miller, S. Miller, M. Pender, J.V. Pittman, J. Samra, C. Sweeney, S.C. Wofsy, and B. Xiang. 2016. CARVE: L2 Merged Atmospheric CO2, CO, O3 and CH4 Concentrations, Alaska, 2012-2015. ORNL DAAC, Oak Ridge, Tennessee, USA. https://doi.org/10.3334/ORNLDAAC/1402
Data Characteristics
Spatial Coverage: Alaska and western Yukon Territory
Spatial Resolution: 0.5-degree
Temporal Coverage: 20120501 - 20141130
Temporal Resolution: Daily to monthly
Study Area (These coordinates are the approximate locations of the study sites and may not match the extent of the data files. All latitude and longitude are given in decimal degrees.)
| Site | Northern Extent | Western Extent | Eastern Extent | Southern Extent |
|---|---|---|---|---|
| Alaska and Yukon Territory | 74.75 | -169.75 | -130.25 | 50.25 |
Date File Information
There are three files in CSV format and two files in NetCDF format (*.nc) included in this dataset. The two NetCDF files contain 0.5-degree gridded monthly and daily methane flux estimates. The three CSV files provide these monthly and daily methane flux estimates for the entire study area and divided between boreal and tundra ecosystems.
NetCDF Data Files
- CARVE-CH4.model.daily.nc --- 0.5-degree gridded daily CH4 emissions estimates calculated from atmospheric profiles and lagrangian transport modeling (Boltzmann-Arrhenius model)
- CARVE-CH4.model.monthly.nc --- 0.5-degree gridded monthly CH4 emissions estimates calculated from atmospheric profiles and lagrangian transport modeling (Boltzmann-Arrhenius model)
Table 1. Variables in each of the NetCDF files
| Variable name | Units | Description |
|---|---|---|
| area | m2 | Land surface area of domain |
| ch4_flux | kg per m2 | Total CH4 emitted during time interval |
| ch4_flux_u | kg per m2 | Uncertainty of total CH4 emitted during time interval. See Section 4 for details. |
| boreal | Flag: 0 or 1 | Boreal ecoregion (Boreal = 1, other = 0) |
| latitude | degrees_north | Latitude coordinate |
| longitude | degrees_east | Longitude coordinate |
| time | days since 1990-01-01 | Time in days since 1990-01-01 00:00:00 UTC |
| tundra | Flag: 0 or 1 | Tundra ecoregion (Tundra = 1, other = 0) |
Tabular Data Files
- CARVE-CH4.aircraft.csv
Estimates of CH4 from atmospheric profiles for the boreal and tundra ecosystems of Alaska and the Yukon.
| Column name | Units | Description |
|---|---|---|
| profile_date | YYYY-MM-DD | Profile date |
| profile_number | Profile number | |
| start_datetime | YYYY-MM-DD HH:MM:SS UTC | Start date and time |
| end_datetime | YYYY-MM-DD HH:MM:SS UTC | End date and time |
| ch4_flux | mg m-2 d-1 | CH4 flux |
| total_column_footprint_influence | ppm (nmol-1 m-2 s-1)-1 | Total column footprint influence |
| ch4_background | ppb | CH4 background |
| boundary_layer_height | m | Boundary layer height |
| flag1 * | Flag: 0 or 1 | 1 = Large variability in free tropospheric CH4 |
| flag2 ** | Flag: 0 or 1 | 1 = Difficulty estimating boundary layer height |
| flag3 *** | Flag: 0 or 1 | 1 = Boundary layer influence anomalously low |
* Refers to an observed problem in constraining the background value of CH4 in the free troposphere which is used to calculate the mixed layer enhancement.
** Reported when the refractivity method for determining the mixed layer height significantly differed from observations of the profiles of water vapor, potential temperature and other trace gases.
*** Indicates when the average domain integrated footprint influence throughout the mixed layer was less than 5% of the campaign average (~ 1 ppm nmol-1 m-2 s-1). This indicates that the air was likely of foreign origin (i.e. not within the domain of study).
- CARVE-CH4.aircraft.monthly.csv
Monthly regional average flux of CH4 for the boreal and tundra ecosystems of Alaska and the Yukon.
| Column name | Units | Description |
|---|---|---|
| month | YYYY-MM | Month number (MM; Jan = 01, Feb = 02, etc.), recorded for growing season only. |
| weighted_average_ch4_flux | mg m-2 d-1 | Weighted average CH4 flux |
| weighted_average_uncertainty | mg m-2 d-1 | Weighted average uncertainty of CH4 flux. See Section 4 for details. |
| average_uncertainty | mg m-2 d-1 | Average uncertainty of CH4 flux. See Section 4 for details. |
| weighted_standard_deviation | mg m-2 d-1 | Weighted standard deviation of CH4 flux. See Section 4 for details. |
| standard_deviation | mg m-2 d-1 | Standard deviation of CH4 flux. See Section 4 for details. |
| flag | Flag: 0 or 1 | Flag = 1 whenever there were consistent differences between observed CH4 background used to estimate CH4 enhancements and the CH4 background observed at in situ sites within Alaska |
- CARVE-CH4.ecosystem.csv
Monthly average flux of CH4 for each of the domain ecosystems, tundra and boreal.
| Column name | Units | Description |
|---|---|---|
| month | Month number (Jan = 1, Feb = 2, etc.), recorded for growing season only. | |
| tundra_ch4_flux | mg m-2 d-1 | Tundra CH4 flux |
| uncertainty_in_tundra_ch4_flux | mg m-2 d-1 | Uncertainty in tundra CH4 flux. See Section 4 for details. |
| boreal_ch4_flux | mg m-2 d-1 | Boreal CH4 flux |
| uncertainty_in_boreal_ch4_flux | mg m-2 d-1 | Uncertainty in boreal CH4 flux. See Section 4 for details. |
Application and Derivation
The estimates of regional scale CH4 budget included in this dataset can be used to investigate the relationship between land surface properties and atmospheric CH4 observations.
Quality Assessment
Uncertainties in the estimated CH4 flux from individual profiles were determined through bootstrapping both observational measurements and the integrated model footprints involved in their calculation by sampling each variable with replacement 500 times. Explicit variables included were as follows:
- matching observations of CH4, T, P, and Pw at each 250-m altitude bin to estimate uncertainties associated with the observations and spatial variability;
- the footprint sensitivity at each 250-m altitude bin, approximating the uncertainty of releasing particles within neighboring grid cells - it should be emphasized that this is not a true posterior variability and may underestimate full modelling uncertainties, although it is still a useful approximation of a type of model uncertainty;
- the mixed layer height, which was varied by +/- 250 m and propagated through the calculations of flux by either adding or removing another 250-m bin to the integration of the column enhancement of CH4, but without varying the CH4 background, representing the uncertainty due to height;
- same as above but changing the CH4 background; and
- all of the above propagated through the entire calculation, representing the total methodological uncertainty in our calculations of CH4 flux.
The 95 % confidence interval (CI) of the last step was used to estimate the uncertainty associated with the estimated CH4 flux from individual profiles. The mean, minimum, and maximum 95% CI for each of these steps reveal that the largest methodological uncertainty associated with the results is the combined uncertainty in identifying both the mixed layer height and the CH4 background.
Uncertainties in the monthly-mean CH 4 flux were estimated in four ways:
- average uncertainty, the 95% CI for each individual estimate is averaged for each month with no weighting;
- weighted average uncertainty, the 95%CI for each individual estimate is averaged for each month and weighted by the column-integrated total surface influence;
- standard deviation, the normal standard deviation is calculated from the residuals of the weighted monthly mean;
- and weighted standard deviation, the standard deviation of all CH4 flux estimates within a given month is calculated, weighting each residual by the total surface influence and the inverse of the square of the 95% CI.
Uncertainties calculated using the weighted standard deviation are given because they account for both monthly variability and the uncertainty in the flux estimated from each profile.
For the ecosystem and regression analysis, uncertainties in the net ecosystem emissions and monthly average fluxes were propagated using the uncertainties in regression parameters.
Data Acquisition, Materials, and Methods
This dataset contains methane fluxes derived from in-situ gas measurements collected at ~2.5-second intervals by two ring-down spectrometers (Budney et al. 2016) using lagrangian transport modeling. The primary product of this dataset is the domain average fluxes in units of mg CH4 m-2 d-1. They were calculated on a profile-by-profile basis and are listed in CARVE-CH4.aircraft.csv.
Monthly average CH4 fluxes for the Alaska were estimated from the modeled methane fluxes. These are listed in CARVE-CH4.aircraft.monthly.csv. Monthly fluxes were translated into gridded monthly emissions in units of kg CH4 m-2 (CARVE-CH4.aircraft.flux.nc) on a 0.5-degree lat/lon grid. Grid cells falling outside of the CARVE domain were masked from the map using a fill value of -999.
The CH4 flux estimates were also used in a simple linear regression model to estimate the fluxes from the tundra and boreal ecosystems (conglomerates of EPA Level III ecosystems) described in Hartery et al. (2018). The monthly ecosystem fluxes are listed in CARVE-CH4.ecosystem.csv. The 0.5-degree gridded boreal and tundra ecosystems are depicted on the map in Figure 2.
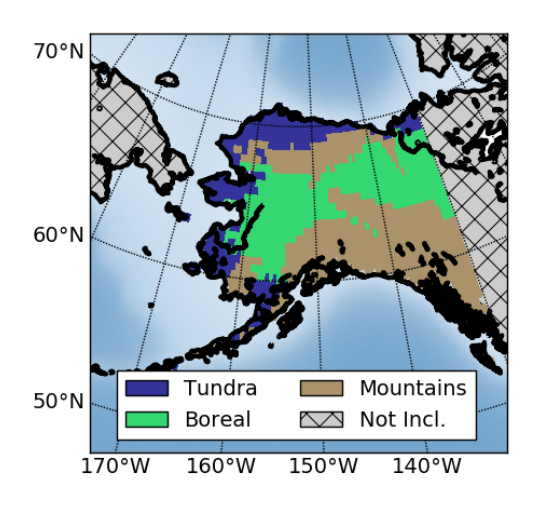
Figure 2. Ecoregions derived from the Commission for Environmental Cooperation Level II Terrestrial Ecoregions. The study region is defined by the coastline and filled ecoregions (Hartery et al. 2018).
The methane fluxes were used with a combination of environmental variables to derive a statistical relationship between domain-wide flux and soil temperature. These calculations use the soil temperature products from NARR and derived parameters from a Boltzmann-Arrhenius model to model CH4 flux within the domain. These calculations and related uncertainties are available in CARVE-CH4.model.monthly.nc and CARVE-CH4.model.daily.nc and are on the same 0.5-degree lat/lon grid. The monthly calculations were calculated using monthly averaged temperatures from NARR and daily temperatures from the daily files.
Data Access
These data are available through the Oak Ridge National Laboratory (ORNL) Distributed Active Archive Center (DAAC).
CARVE: Ecosystem Scale CH4 Emission Derived from Aircraft Observations 2012-2014
Contact for Data Center Access Information:
- E-mail: uso@daac.ornl.gov
- Telephone: +1 (865) 241-3952
References
Budney, J.W., R.Y-W. Chang, R. Commane, B.C. Daube, A. Dayalu, S.J. Dinardo, E.W. Gottlieb, A. Karion, J.O.W. Lindaas, C.E. Miller, J.B. Miller, S. Miller, M. Pender, J.V. Pittman, J. Samra, C. Sweeney, S.C. Wofsy, and B. Xiang. 2016. CARVE: L2 Merged Atmospheric CO2, CO, O3 and CH4 Concentrations, Alaska, 2012-2015. ORNL DAAC, Oak Ridge, Tennessee, USA. https://doi.org/10.3334/ORNLDAAC/1402
Hartery, S., Commane, R., Lindaas, J., Sweeney, C., Henderson, J., Mountain, M., Steiner, N., McDonald, K., Dinardo, S. J., Miller, C. E., Wofsy, S. C., and Chang, R. Y.-W. 2018. Estimating regional-scale methane flux and budgets using CARVE aircraft measurements over Alaska, Atmos. Chem. Phys., 18, 185-202, https://doi.org/10.5194/acp-18-185-2018