Documentation Revision Date: 2017-05-05
Data Set Version: V1
Summary
This data set includes 9 files in total. The 3-hourly net ecosystem exchange (NEE) is in netCDF (*.nc) format. There are four tabular data files in comma-separated (*.csv) format containing daily mean NEE, carbon budgets, and CO2 column profiles from CARVE flights. Four maps of the regional landcover types are provided in geotiff (*.tif) format.
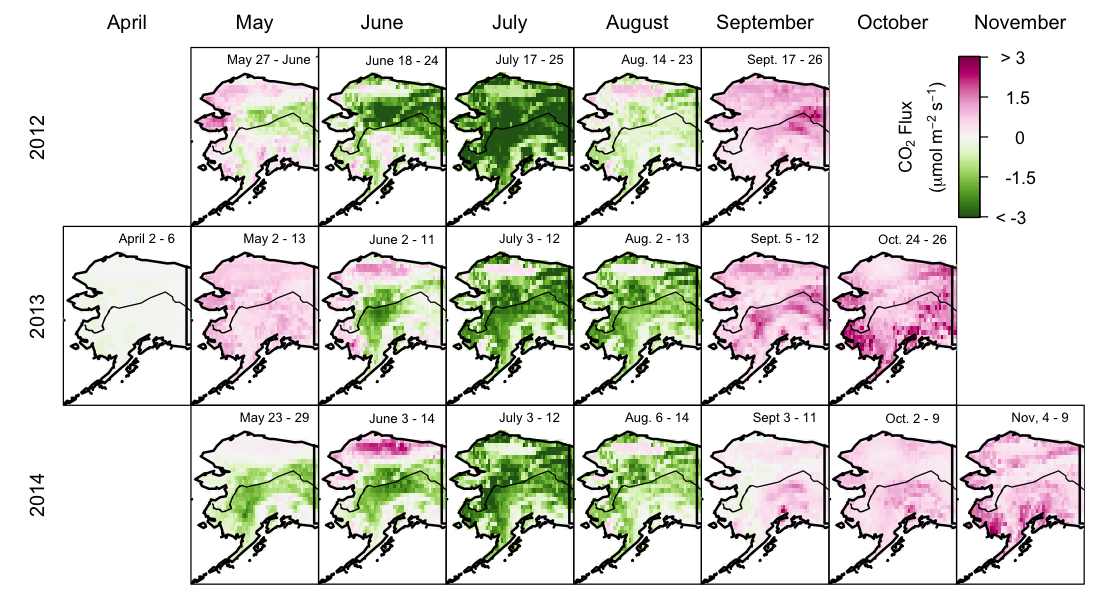
Figure 1. Optimized biogenic net CO2 flux for Alaska 2012-2014. The date of each measurement period is shown at the top of each map. From Commane et al. (2017)
Citation
Commane, R., J. Benmergui, J.O.W. Lindaas, S. Miller, K.A. Luus, R.Y-W. Chang, B.C. Daube, S. Euskirchen, J. Henderson, A. Karion, J.B. Miller, N.C. Parazoo, J.T. Randerson, C. Sweeney, P. Tans, K. Thoning, S. Veraverbeke, C.E. Miller, and S.C. Wofsy. 2017. CARVE: Net Ecosystem CO2 Exchange and Regional Carbon Budgets for Alaska, 2012-2014. ORNL DAAC, Oak Ridge, Tennessee, USA. https://doi.org/10.3334/ORNLDAAC/1389
Table of Contents
- Data Set Overview
- Data Characteristics
- Application and Derivation
- Quality Assessment
- Data Acquisition, Materials, and Methods
- Data Access
- References
Data Set Overview
This data set provides estimates of 3-hourly net ecosystem CO2 exchange (NEE) at 0.5-degree resolution over the state of Alaska for 2012-2014. The NEE estimates are the output are from Geostatistical Inverse Modeling of a subset of CARVE aircraft CO2 data, WRF-STILT footprints, and PVPRM-SIF data from flux towers (CRV: located in Fox, AK and BRW: located just outside Barrow, AK). Daily mean NEE is also provided as calculated for all of Alaska and for four sub-regions (0.5-degree resolution) that were defined across Alaska, based on general landcover type: North Slope Tundra, South and West Tundra, Boreal Forests, and Mixed (all other). Also provided are derived annual carbon budgets for (1) all of Alaska with defined contributions from biogenic, fossil fuel, and biomass burning sources and (2) annual biogenic carbon budgets for the four landcover-type regions of Alaska. Provide for completeness are the CARVE aircraft atmospheric measurement data used in estimating NEE.
Project: Carbon in Arctic Reservoirs Vulnerability Experiment (CARVE)
Carbon in Arctic Reservoirs Vulnerability Experiment (CARVE) is collecting detailed measurements of important greenhouse gases on local to regional scales in the Alaskan Arctic and demonstrating new remote sensing and improved modeling capabilities to quantify Arctic carbon fluxes and carbon cycle-climate processes. Ultimately, CARVE will provide an integrated set of data that will provide unprecedented experimental insights into Arctic carbon cycling.
Related Data Set:
Luus, K.A., and J.C. Lin. 2017. CARVE Modeled Gross Ecosystem CO2 Exchange and Respiration, Alaska, 2012-2014. ORNL DAAC, Oak Ridge, Tennessee, USA. http://dx.doi.org/10.3334/ORNLDAAC/1314
Related Publication:
Commane, R., Lindaas, J.O.W., Benmergui, J., Luus, K.A., Chang, R.Y-W. , Daube, B.C., Euskirchen, S., Henderson, J., Karion, A., Miller, J.B., Miller, S., Parazoo, N.C., Randerson, J.T., Sweeney, C., Tans, P., Thoning, K., Veraverbeke, S., Miller, C.E., and Wofsy, S.C., 2017. Carbon dioxide sources from Alaska driven by increasing early winter respiration from Arctic tundra. Proceedings of the National Academy of Sciences.
Acknowledgements:
This project was funded by the National Oceanic and Atmospheric Administration (NOAA), NASA Grants
NNX13AK83G, NNXNNX15AG91G and 1444889 (through JPL), the NSF AON program (#1503912) and the USGS Climate Research and Development Program.
Data Characteristics
Spatial Coverage: Alaska
Spatial Resolution: 0.5- x 0.5-degree
Temporal Coverage: 20120101-20141231
Temporal Resolution: 3-hourly
Study Area (All latitudes and longitudes are given in decimal degrees)
|
Site |
Westernmost Longitude |
Easternmost Longitude |
Northernmost Latitude |
Southernmost Latitude |
|
Alaska |
-169 |
-120 |
74.5 |
50 |
Data File Information
This data set includes one file in netCDF (*.nc) format containing 3-hourly net ecosystem exchange (NEE), four binary maps of land cover in geotiff (*.tif) format, and four tabular data files in comma-separated (*.csv) format containing mean daily NEE, carbon budgets, and CO2 column profiles from CARVE flights.
Table 1. File names and descriptions
|
File name |
Description |
|
oNEE.nc |
3-hourly aircraft-optimized CO2 flux (net ecosystem exchange) for the Alaska domain |
|
Daily_Mean_Aircraft_Optimized_NEE_AK.csv |
daily mean aircraft-optimized CO2 flux for the Alaska domain |
|
Annual_Carbon_Budget_Region.csv |
annual biogenic carbon budget by region |
|
Annual_Total_Carbon_Budget_AK.csv |
annual carbon budget by source |
|
CO2_Data_Profiles_CARVE_Flights.csv |
CO2 air column profiles from CARVE flights |
|
Forest_Interior_AK.tif |
forested land coverage map of interior Alaska |
|
Tundra_Cover_North_Slope.tif |
tundra coverage map of the North Slope |
|
Tundra_Cover_Yukon_Kuskokwim.tif |
tundra coverage map of the Yukon-Kuskokwim Delta |
|
Mixed_Landcover_AK.tif |
mixed land cover map of the Alaska domain |
Spatial Data Files
The netCDF (oNEE.nc) provides aircraft-optimized CO2 flux (net ecosystem exchange) data in 3-hourly intervals. Data fields within the netCDF file are described in Table 2.
Table 2. Data fields in oNEE.nc
|
Data field |
Units |
Description |
|
oNEE |
umol (micromole) m-2 s-1 |
aircraft-optimized CO2 flux (net ecosystem exchange) |
|
latitude |
degrees_north |
latitude of grid cell |
|
longitude |
degrees_east |
longitude of grid cell |
|
time |
days since 2012-01-01 00:00:00.0 UTC |
3-hourly time steps measured in days since 2012-01-01 |
GeoTIFF Files
The four geotiff files included in this data set provided the spatial coverage for which net biogenic carbon budgets were calculated: Forest_Interior_AK.tif – boreal forests of interior Alaska; Tundra_Cover_North_Slope.tif – North Slope tundra; Tundra_Cover_Yukon_Kuskokwim.tif – Yukon-Kuskokwim Delta of south-west Alaska and the Seward Peninsula; and Mixed_Landcover_AK.tif – mixed areas or areas of Alaska not included in other regions. Biogenic carbon budgets were calculated from the aircraft-optimized CO2 fluxes for 2012, 2013, and 2014. Spatial data properties for the geotiff files are described below.
Spatial Data Properties
Spatial Representation Type: Raster
Number of Bands: 1
Raster Format: GeoTIFF
Projection: Geographic (WGS 1984)
Angular Unit: Degree (0.0174532925199433)
Prime Meridian: Greenwich (0.0)
Datum: D_WGS_1984
Spheroid: WGS_1984
Semimajor Axis: 6378137.0
Semiminor Axis: 6356752.314245179
Inverse Flattening: 298.257223563
Tabular Data Files
Annual_Carbon_Budget_Region.csv and Annual_Total_Carbon_Budget_AK.csv provide the annual carbon budget by region and source, respectively. Rows in Annual_Carbon_Budget_Region.csv give the carbon budget in TgC yr-1 for the area of coverage provided in the corresponding geotiff: “NS” – Tundra_Cover_North_Slope.tif; “YK” – Tundra_Cover_Yukon_Kuskokwim; “IA” – Forest_Interior_AK.tif; and “Other” – Mixed_Landcover_AK.tif. Rows in Annual_Total_Carbon_Budget_AK.csv give the carbon budget in TgC yr-1 for three sources influencing CO2 concentrations: biogenic, biomass burning, and fossil fuel. Each file contains one column per year for the years 2012, 2013, and 2014.
Tabular data file structure for the remaining files are described in Tables 3 and 4.
Table 3. Column names, units, and descriptions in Daily_Mean_Aircraft_Optimized_NEE_AK.csv
| Column Name | Units | Description |
| Date | YYYYMMDD | Date |
| DOY | Day of Year (Jan 1 = Day 0) | |
| days_since_1Jan2012 | days since January 1 2012 | |
| oNEE_mean | umol m-2 s-1 | Mean aircraft optimized NEE for Alaska domain with interpolation between aircraft measurement periods |
| sd | umol m-2 s-1 | Standard deviation of aircraft optimized NEE within the Alaska domain |
| CI975 | umol m-2 s-1 | 95% confidence interval (upper limit) of aircraft optimized NEE within the Alaska domain |
| CI025 | umol m-2 s-1 | 95% confidence interval (lower limit) of aircraft optimized NEE within the Alaska domain |
| PVPRMv9 | umol m-2 s-1 | Mean NEE calculated from Polar-Vegetative Photosynthesis and Respiration Model |
| oNEE_raw | umol m-2 s-1 | Mean aircraft optimized NEE for Alaska domain for airborne measurement periods only |
| oNEE_mean_NS | umol m-2 s-1 | Mean aircraft optimized NEE for Alaska domain with interpolation between aircraft measurement periods for Alaskan North Slope |
| sd_NS | umol m-2 s-1 | Standard deviation of aircraft optimized NEE within the Alaska domain for Alaskan North Slope |
| CI975_NS | umol m-2 s-1 | 95% confidence interval (upper limit) of aircraft optimized NEE within the Alaska domain for Alaskan North Slope |
| CI025_NS | umol m-2 s-1 | 95% confidence interval (lower limit) of aircraft optimized NEE within the Alaska domain for Alaskan North Slope |
| PVPRMv9_NS | umol m-2 s-1 | Mean NEE calculated from Polar-Vegetative Photosynthesis and Respiration Model for Alaskan North Slope |
| oNEE_raw_NS | umol m-2 s-1 | Mean aircraft optimized NEE for Alaska domain for airborne measurement periods only for Alaskan North Slope |
| oNEE_mean_YK | umol m-2 s-1 | Mean aircraft optimized NEE for Alaska domain with interpolation between aircraft measurement periods for Alaskan Yukon-Kuskokwim Delta and Seward Penninsula |
| sd_YK | umol m-2 s-1 | Standard deviation of aircraft optimized NEE within the Alaska domain for Alaskan Yukon-Kuskokwim Delta and Seward Penninsula |
| CI975_YK | umol m-2 s-1 | 95% confidence interval (upper limit) of aircraft optimized NEE within the Alaska domain for Alaskan Yukon-Kuskokwim Delta and Seward Penninsula |
| CI025_YK | umol m-2 s-1 | 95% confidence interval (lower limit) of aircraft optimized NEE within the Alaska domain for Alaskan Yukon-Kuskokwim Delta and Seward Penninsula |
| PVPRMv9_YK | umol m-2 s-1 | Mean NEE calculated from Polar-Vegetative Photosynthesis and Respiration Model for Alaskan Yukon-Kuskokwim Delta and Seward Penninsula |
| oNEE_raw_YK | umol m-2 s-1 | Mean aircraft optimized NEE for Alaska domain for airborne measurement periods only for Alaskan Yukon-Kuskokwim Delta and Seward Penninsula |
| oNEE_mean_IA | umol m-2 s-1 | Mean aircraft optimized NEE for Alaska domain with interpolation between aircraft measurement periods for interior Alaska |
| sd_IA | umol m-2 s-1 | Standard deviation of aircraft optimized NEE within the Alaska domain for interior Alaska |
| CI975_IA | umol m-2 s-1 | 95% confidence interval (upper limit) of aircraft optimized NEE within the Alaska domain for interior Alaska |
| CI025_IA | umol m-2 s-1 | 95% confidence interval (lower limit) of aircraft optimized NEE within the Alaska domain for interior Alaska |
| PVPRMv9_IA | umol m-2 s-1 | Mean NEE calculated from Polar-Vegetative Photosynthesis and Respiration Model for interior Alaska |
| oNEE_raw_IA | umol m-2 s-1 | Mean aircraft optimized NEE for Alaska domain for airborne measurement periods only for interior Alaska |
Table 4. Column names, units, and descriptions in CO2_Data_Profiles_CARVE_Flights.csv
| Column Name | Units | Description |
| Year | Year | |
| Date | Date in yyyymmdd | |
| Time | Time in hh:mm:ss | |
| DOY | Day of Year (Jan 1 = Day 0) | |
| Lat | Latitude | |
| Lon | Longitude | |
| Altitude_magl | meters | Mean Altitude above ground level |
| CO2_mean | ppm | Mean CO2 concentration |
| CO2_sd | ppm | Standard deviation of carbon dioxide |
| CO_mean | ppb | Mean carbon monoxide |
| CO_sd | ppb | Standard deviation of carbon monoxide |
| Temperature | DegC | Temperature |
| Pressure | mbar | Pressure |
| Altitude_GPS_masl | meters | Altitude above mean seal level |
| H2O | % | Water vapor |
| O3_mean | ppb | Mean Ozone |
| O3_sd | ppb | Standard deviation of Ozone |
| prfl_number | Profile number | |
| STILT_FP | umol m-2 s-1 | Total footprint |
| STILT | Stilt File name |
Application and Derivation
This data set has been used to assess carbon fluxes and carbon-climate feedbacks in arctic and boreal Alaska by combining and comparing several complementary approaches which in turn will help to gain a more complete understanding of the Alaskan carbon budget and new insight into how arctic carbon fluxes may respond to future climate change (Commane et al., 2017).
Quality Assessment
Calculation of the additive flux correction was required to match the modeled to observed column enhancements, within a given measurement period. The "column difference" calculated for each flight period is defined as the difference between the modeled and observed integrated CO2 columns.To represent the spatial distribution of the additive flux correction an inverse model was applied to the column difference for each two week flight period. The column differences vary between -0.25 to +0.45 mol m-2. The goal of the inverse framework is to find an optimal model of the additive flux correction that accounts for the spatial variations of the column differences for each flight period, leading to a spatially explicit, optimal estimate for the CO2 fluxes and annual budget for Alaska (Commane et al., 2017).
Data Acquisition, Materials, and Methods
NEE Derivation
According to Commane et. al., 2017, mean CO2 mole fractions were calculated from altitude profiles of CO2 concentration measured across Alaska during the Carbon in Arctic Reservoirs Vulnerability Experiment (CARVE) flights, spanning April-November in 2012-2014. For each aircraft integrated CO2 column, a high resolution transport model was coupled with a data-driven CO2 flux estimate to predict atmospheric CO2 enhancements associated with Alaskan land surface biogenic fluxes, and then the modeled integrated CO2 column was calculated. Profiles with carbon monoxide mole fractions exceeding 150 ppb were removed to exclude the influence of biomass burning and fossil fuel combustion.
The influence of land surface fluxes for each of the 231 vertical profiles was calculated using the high-resolution WRF-STILT transport model. The proportion of particles located in the lower half of the planetary boundary layer determined the influence of surface fluxes on the measured mole fractions. The two-dimensional WRF-STILT footprint was calculated for each particle at 3-hour intervals on a 0.5- by 0.5-degree grid over the 10-day travel period of the particles. Ecosystem fluxes of CO2 were calculated using the Polar Vegetation Photosynthesis and Respiration Model (PVPRM) and enhanced by convolution with the land surface influence functions calculated from WRF-STILT.
Additive corrections to PVPRM CO2 fluxes were obtained for each two-week aircraft measurement period using a geostatistical inverse model (GIM) to minimize the differences between modeled and observed column CO2 enhancements. PVPRM fluxes and additive flux corrections (interpolated between two-week flight periods) were used to calculate regional-scale CO2 fluxes for Alaska during 2012-2014. The time-series of aircraft-optimized biogenic CO2 flux after additive correction is depicted in Figure 1.
Definition of Regions
Biogenic carbon budgets were calculated for four Alaska sub-regions: North Slope Tundra (Tundra_Cover_North_Slope.tif), South and West Tundra (Tundra_Cover_Yukon_Kuskokwim.tif), Boreal Forests (Forest_Interior_AK.tif), and Mixed (Mixed_Landcover_AK.tif). North Slope Tundra included grid cells with 60% or more tundra north of 67°N. South & West Tundra included grid cells with 60% or more tundra south of 67°N. Forests represented areas of at least 40% Alaska’s forest cover. "Mixed" represents everything else not classified in the other regions. North Slope Tundra, South and West Tundra and Forests represent ~80% of the total area of Alaska.
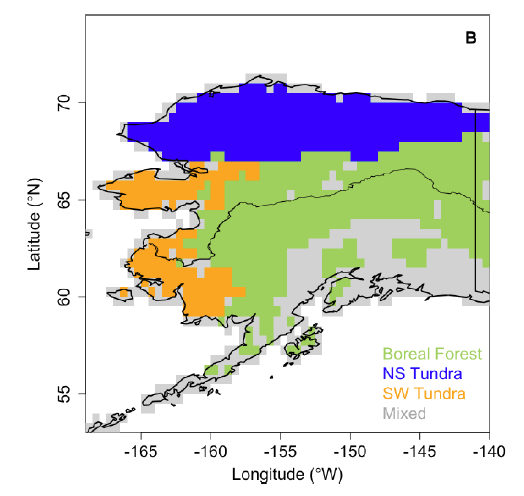
Figure 2: Map of the regional areas within Alaska
Data Access
These data are available through the Oak Ridge National Laboratory (ORNL) Distributed Active Archive Center (DAAC).
CARVE: Net Ecosystem CO2 Exchange and Regional Carbon Budgets for Alaska, 2012-2014
Contact for Data Center Access Information:
- E-mail: uso@daac.ornl.gov
- Telephone: +1 (865) 241-3952
References
Commane, R., Lindaas, J.O.W., Benmergui, J., Luus, K.A., Chang, R.Y-W. , Daube, B.C., Euskirchen, S., Henderson, J., Karion, A., Miller, J.B., Miller, S., Parazoo, N.C., Randerson, J.T., Sweeney, C., Tans, P., Thoning, K., Veraverbeke, S., Miller, C.E., and Wofsy, S.C., 2017. Carbon dioxide sources from Alaska driven by increasing early winter respiration from Arctic tundra. Proceedings of the National Academy of Sciences.