Documentation Revision Date: 2016-09-21
Data Set Version: R1
Summary
The SLICER data are provided in a combination of ASCII and binary data files. There are 244 data files; 175 are *.dat files and 69 are *.txt files.
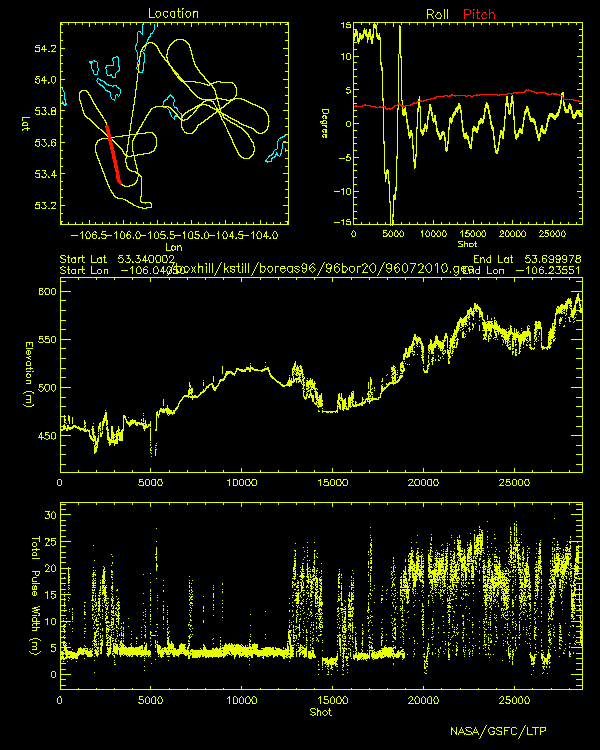
Figure 1. Typical aircraft flight line, aircraft position, and pulse characteristics for Lidar shots during a flight across the Southern Study Area.
Citation
Harding, D. 2016. BOREAS Scanning Lidar Imager of Canopies by Echo Recovery (SLICER): Level-3 Data. ORNL DAAC, Oak Ridge, Tennessee, USA. https://doi.org/10.3334/ORNLDAAC/508
Table of Contents
- Data Set Overview
- Data Characteristics
- Application and Derivation
- Quality Assessment
- Data Acquisition, Materials, and Methods
- Data Access
- References
- Data Set Revisions
Data Set Overview
SLICER data were acquired in support of BOREAS at all of the TF sites in the SSA and NSA, and along transects between the study areas. Data were acquired on 5 days between 18-Jul and 30-Jul-1996. Each coverage of a tower site is typically 40 km in length, with a minimum of 3 and a maximum of 10 lines across each tower oriented in a variety of azimuths. The SLICER data were acquired simultaneously with ASAS hyperspectral, multiview angle images. The SLICER Level 3 products consist of binary files for each flight line with a data record for each laser shot composed of 13 parameters and a 600-byte waveform that is the raw record of the back scatter laser energy reflected from Earth's surface.
Project: BOREAS
The Boreal Ecosystem-Atmosphere Study was a large-scale international interdisciplinary experiment in the boreal forests of central Canada. Its focus was improving our understanding of the exchanges of radiative energy, sensible heat, water, CO2 and trace gases between the boreal forest and the lower atmosphere. A primary objective of BOREAS was to collect the data needed to improve computer simulation models of the important processes controlling these exchanges so that scientists can anticipate the effects of global change, principally altered temperature and precipitation patterns, on the biome.
Related Data Sets:
Irons, J. R., and M. Bur. 1999. BOREAS RSS-02 Extracted Reflectance Factors Derived from ASAS Imagery. Data set. Available on-line [http://www.daac.ornl.gov] from Oak Ridge National Laboratory Distributed Active Archive Center, Oak Ridge, Tennessee, U.S.A. https://doi.org/10.3334/ORNLDAAC/287
Irons, J. R., and P. W. Dabney. 2000. BOREAS RSS-02 Level-1b ASAS Image Data: At-sensor Radiance in BSQ Format. Data set. Available on-line [http://www.daac.ornl.gov] from Oak Ridge National Laboratory Distributed Active Archive Center, Oak Ridge, Tennessee, U.S.A. https://doi.org/10.3334/ORNLDAAC/562
Data Characteristics
Spatial Coverage: Flight lines across all TF sites in the SSA and NSA. A SLICER flight line typically consists of a 45-m-wide swath composed of five cross-track laser footprints.
Spatial Resolution: For BOREAS acquisitions, the length of each flight line varies, but is typically about 40 km. Flight lines across all TF sites in the SSA and NSA were acquired, with a minimum of 3 lines and a maximum of 10 lines per site.
Temporal Coverage: 19960718 to 19960730
Temporal Resolution: Data were acquired for NSA sites on 18-Jul and 24-Jul; for the SSA sites on 20-Jul, 29-Jul, and 30-Jul; and on transects between the study areas on 18-Jul and 24-Jul-1996. The time between flight lines across a tower site on a flight day varied between tens of minutes and several hours.
Site boundaries: (All latitude and longitude given in decimal degrees)
|
Site (Region) |
Westernmost Longitude |
Easternmost Longitude |
Northernmost Latitude |
Southernmost Latitude |
|
Tower Flux (TF) sites in the Southern and Northern Study Areas of the BOReal Ecosystem-Atmosphere Study (BOREAS) region |
-106.19779 |
-98.02747 |
55.92842 |
53.62889 |
Study Area: The North American Datum of 1983 (NAD83) coordinates for the tower sites are:
|
Site |
Western Longitude |
Eastern Longitude |
Northern Latitude |
Southern Latitude |
|
NSA-BVP |
-98.02747 |
-98.02747 |
55.84225 |
55.84225 |
|
NSA-FEN |
-98.42072 |
-98.42072 |
55.91481 |
55.91481 |
|
NSA-OBS |
-98.48139 |
-98.48139 |
55.88007 |
55.88007 |
|
NSA-OJP |
-98.62396 |
-98.62396 |
55.92842 |
55.92842 |
|
NSA-YJP |
-98.28706 |
-98.28706 |
55.89575 |
55.89575 |
|
SSA-FEN |
-104.61798 |
-104.61798 |
53.80206 |
53.80206 |
|
SSA-OBS |
-105.11779 |
-105.11779 |
53.98717 |
53.98717 |
|
SSA-OJP |
-104.69203 |
-104.69203 |
53.91634 |
53.91634 |
|
SSA-YJP |
-104.64529 |
-104.64529 |
53.87581 |
53.87581 |
|
SSA-9OA |
-106.19779 |
-106.19779 |
53.62889 |
53.62889 |
|
SSA-9YA |
-105.32314 |
-105.32314 |
53.65601 |
53.65601 |
Data File Information:
This data set is distributed in 244 data files -- 175 are *.dat files and 69 are *.txt files. The* .dat files are comprised of both level 3a and level 3b data. The *.txt files are only associated with the level 3a data.
The Level 3a data consist of all valid laser returns along a flight line.
The naming convention for these files consists of an eight-character name and a *.dat suffix e.g., NSA_960718_02.DAT.
The eight characters consist of YYMMDDLL, where
YY is the last two digits of the year in which the data were collected,
MM is the month of the year,
DD is the day of the month, and
LL is the flight line number on that day. Flight lines are numbered in sequence in the order in which they were collected.
The Level 3b data consist of segments of laser shots copied from the Level 3a flight lines.
These files each contain 1,001 laser shots centered near a BOREAS flux tower, extending approximately 1 km outward from the tower. The file format is the same as that of the Level 3a data.
The naming convention consists of an eight-character name.
The eight characters consist of a four-letter designation of the tower site followed by DDLL (day and line number).
The four-letter designation follows the BOREAS site abbreviation conventions (i.e., NOBS, SOBS, SOJP).
Some of the level 3b files have been edited and have the word ‘EDIT’ in the filename.
|
Data File Type |
Site |
Number of Data Files |
|
Level 3a.dat |
|
|
|
|
NSA |
27 |
|
|
NSA_Transit |
10 |
|
|
SSA |
37 |
|
Level 3a.txt |
|
|
|
|
NSA |
27 |
|
|
NSA_Transit |
10 |
|
|
SSA |
37 |
|
Level 3b.dat |
|
|
|
|
NSA |
24 |
|
|
SSA |
29 |
|
Level 3b edit.dat |
|
|
|
|
NSA |
24 |
|
|
SSA |
29 |
Companion File Information:
|
Companion File Name |
Description |
|
BOREAS_SLICER_NASA-LAPF_Instrument_and_DataDescription.pdf |
This document describes the Scanning Lidar Imager of Canopies by Echo Recovery (SLICER), an airborne laser altimeter and surface lidar instrument and data product description. |
|
BOREAS_SLICER_NASA-LAPG_TechnicalOverview.pdf |
Technical Overview of Boreas Slicer. Legacy guide format with 20 detailed sections. |
|
SLICER_inventory.csv |
Slicer inventory file. See the descriptions of the parameters contained in the SLICER inventory file in the table below. |
|
ELEVDIFF_readme.txt |
Script used to Measure the Elevation Difference |
|
FLUXTOWR_SUMMARY.txt |
Summary that lists, for each SLICER flight line, the BOREAS TF site(s) crossed by that flight line, and the approximate laser shot number in the data record closest to the tower. |
|
Code_PRO.zip |
Programs for use in IDL for interactively viewing and editing the data |
|
Flight_Line_Plots.zip |
gif plots of location map, roll & pitch on the line, and profiles of elevation and total pulse width for each flight line |
|
Flight_Transect_Files.zip |
Detailed flight line maps showing the location of the laser footprint ground tracks in the vicinity of each TF site. |
|
Log_Notes.zip |
Instrument operator log notes for each flight day |
|
Trajectory_Files_and_Plots.zip |
GPS aircraft trajectory files stored as ASCII data. composed of one header record and then a data record for each GPS epoch. The header record consists of one parameter and a data record consists of eight parameters. The naming convention for these files consists of an eight-character name and a .trj suffix. The eight characters consist of YY_MM_DD, where YY is the last two digits of the year in which the data were collected, MM is the month of the year, and DD is the day of the month. |
Descriptions of the parameters contained in the SLICER inventory file
|
Column Name |
Unit of Measurement |
Description |
|
Spatial_Coverage |
The general term used to denote the spatial area over which the data were collected. |
|
|
Date_Obs |
DD-MON-YYYY |
The date on which the data were collected |
|
Start_Time |
HHMM GMT |
The starting GPS time for the data collected |
|
End_Time |
HHMM GMT |
The ending GPS time for the data collected |
|
Run_Start_Lat |
Decimal Degrees |
The WGS84 latitude coordinate at the beginning of the data line |
|
Run_Start_Long |
Decimal Degrees |
The WGS84 longitude coordinate at the beginning of the data line |
|
Run_End_Lat |
Decimal Degrees |
The WGS84 latitude coordinate at the end of the data line |
|
Run_End_Long |
Decimal Degrees |
The WGS84 longitude coordinate at the end of the data line |
|
Num_Shots |
Count |
The number of laser pulses for the data line |
|
CRTFCN_Code |
The BOREAS certification level of the data. Examples are CPI (Checked by PI), CGR (Certified by Group), PRE (Preliminary), and CPI-??? (CPI but questionable). |
Application and Derivation
The objectives of this activity were to (1) provide the BOREAS project with measurements of canopy structure and ground topography, which are not readily achievable by ground-based or other remote sensing techniques, and (2) utilize BOREAS ground-based canopy measurements to assess SLICER performance and capabilities. Canopy architecture plays a fundamental role in controlling the exchanges of radiative energy, sensible heat, water, carbon dioxide, and trace gases between the surface and the lower atmosphere. Canopy architecture also plays an important role in controlling remote sensing image characteristics, such as the self-shadowing effects on at-sensor radiance observed by passive optical imagers. However, the importance of canopy architecture has rarely been directly quantified due to the difficulty in obtaining consistent, regional observations of three-dimensional canopy structure. The SLICER data collection for BOREAS provides the opportunity to incorporate such observations in an integrated study of the boreal ecosystem. The data can be used to construct topographic profiles of the canopy top directly using the elevation parameter, and of the underlying ground using the elevation minus the vegetation height.
Quality Assessment
SLICER geolocation and elevation results were assessed by differencing the profiles with respect to a Digital Elevation Model (DEM) for the SSA. SLICER profiles were shifted with respect to the DTED grid in order to establish the best-fit location for the SLICER profiles based on a minimization of the root mean square (RMS) difference between the SLICER ground elevations and the DTED elevations.
Qualitative assessments of data consistency were made by constructing a variety of plots for SLICER data in the vicinity of each flux tower. Plots included three-dimensional perspective views of canopy top and ground elevation profiles, contoured transect plots of the height distribution of canopy surface area and closure, and plots of individual and averaged canopy height profiles derived from the backscatter waveforms (examples shown in Harding, 1998). No anomalous data characteristics were observed in these plots.
Data Acquisition, Materials, and Methods
Please refer to the companion file, BOREAS_SLICER_NASA-LAPG_TechnicalOverview.pdf, for detailed information.
Scanning Lidar Imager of Canopies by Echo Recovery (SLICER) is an airborne laser altimeter and surface lidar instrument that acquires canopy height, vertical structure, and ground elevation data along transects that are approximately 50 m wide. The data have a horizontal resolution of approximately 10 m and a vertical resolution of approximately 1 m. Each laser footprint is individually georeferenced by combining the laser ranging data with orientation and positional information provided by the Inertial Navigation System (INS) and Global Positioning System (GPS), respectively. SLICER was flown onboard a National Aeronautics and Space Administration (NASA) C130-Q aircraft on 5 days between 18-Jul and 30-Jul-1996, acquiring data along transects crossing all the Tower Flux (TF) sites in the Southern and Northern Study Areas (SSA and NSA, respectively) of the BOReal Ecosystem-Atmosphere Study (BOREAS) study region (Harding, 1998). The SLICER airborne lidar altimeter system consists of a ranging component and ancillary instrumentation for geolocation. The ranging component consists of a laser transmitter, scan mechanism, receiver telescope, detector, timing electronics, waveform digitizer, and an instrument control and data collection system. Data on a minimum of 3 and a maximum of 10 flight lines were acquired for each tower site. Additional data were acquired on transect flights between study areas and for calibration purposes. Data for each flight line, which are typically 40 km in length, are contained in individual binary files (Level 3a). For ease of use, where the ground track is close to a BOREAS TF site, the data were extracted from the full flight lines, edited for ground return identification, and stored in separate files (Level 3b). Each file contains 1,001 laser shots centered near a tower, extending approximately 1 km outward from the tower.
The SLICER data provided to the BOREAS project are a Level 3 product consisting of a mixture of raw and derived parameters for each laser shot yielding a valid return along the flight. The data record for each laser shot consists of 13 parameters and a 600-byte waveform that is the raw record of the back scatter laser energy reflected from Earth's surface. The 13 parameters are the laser shot number; across-track beam position; energy of the transmitted pulse; time of pulse transmission; diameter of the laser footprint on the surface; azimuth and inclination of the laser pointing vector; latitude and longitude of the footprint; elevation of the highest surface within the footprint; and the distance along the laser vector from the highest surface to what is inferred to be the start, peak, and end of the laser reflection from the ground. Level 3a consists of all shots along the flight lines that yielded a valid reflection from Earth's surface and level 3b consists of segments extracted from the Level 3a data that are in the vicinity of the TF sites.
The principal quantities measured by SLICER are:
- The round-trip travel time of a short-duration 1064-nm pulse of laser light, from the aircraft platform to the first surface that reflects sufficient laser light above a detection threshold at the receiver.
- The intensity of the back scatter return reflected from the surface as a function of time.
- The orientation of the laser pointing vector, obtained from the orientation of the laser scan mirror and an INS measurement of instrument attitude based on gyroscope-determined accelerations.
- The trajectory of the aircraft, obtained from a kinematic differential solution of dual-frequency GPS observations.
- Observation time for each of the above quantities.
A SLICER flight mission typically consists of the following steps:
- Collect GPS data at both the fixed base station and onboard the aircraft while the aircraft is not moving for a period of approximately 30 minutes, in order to provide static differential data to initialize the forward kinematic solution.
- Initialize the INS unit while the aircraft is not moving.
- After takeoff, fly over a water surface at approximately 10,000 ft in level flight to align the laser footprints within the receiver FOV by manually adjusting mirror mounts to maximize the return energy for each footprint (returns off of a water surface are normally used as it provides a flat reference target with uniform albedo).
- Acquire data over a water surface at approximately 10,000 ft, conducting a sequence of roll maneuvers and pitch maneuvers (typically +/- 5 degrees for each axis) to be used in data postprocessing to establish time and angle biases between the laser altimeter and INS unit.
- Acquire data across the target sites, typically at an altitude of 17,500 ft (approx. 5,000 m) above mean sea level, using a flight management system that displays aircraft position (obtained from a GPS receiver) relative to a programmed flight line (at BOREAS the desired flight line was defined by preprogrammed coordinates for the tower positions and a flight orientation through a tower site established in-flight by ASAS requirements for a specified azimuth with respect to the solar principal plane); data acquisition is typically initiated several minutes prior to reaching the target location and terminated several minutes after passing the target (flight time to a target location is reported by the flight management system).
- Prior to landing, acquire data across the GPS base station location to be used in data postprocessing to establish the system range bias.
- After landing, collect GPS data at both the fixed base station and onboard the aircraft while the aircraft is not moving for a period of approximately 30 minutes, in order to provide static differential data to initialize the backward kinematic solution.
Due to time constraints imposed by ASAS acquisition requirements, steps 3 through 6 were not necessarily completed in that order nor were all those steps always completed for every flight mission.
Calibration of the SLICER system includes measurement of laser pulse divergence and temporal quality, time and angle biases between the INS unit and the laser transmitter, a system delay range bias, and laser pulse transmit energy.
Data Access
These data are available through the Oak Ridge National Laboratory (ORNL) Distributed Active Archive Center (DAAC).
BOREAS Scanning Lidar Imager of Canopies by Echo Recovery (SLICER): Level-3 Data
Contact for Data Center Access Information:
- E-mail: uso@daac.ornl.gov
- Telephone: +1 (865) 241-3952
References
Please refer to the companion file, BOREAS_SLICER_NASA-LAPG_TechnicalOverview.pdf, for detailed information.
Data Set Revisions
This data set was originally published in 2000, with data access restrictions. This R1 release removes all data access restrictions, and includes updated documentation.