Documentation Revision Date: 2025-06-23
Dataset Version: 1
Summary
There are four data files in comma separated values format (CSV) and two files in KML format in this dataset.
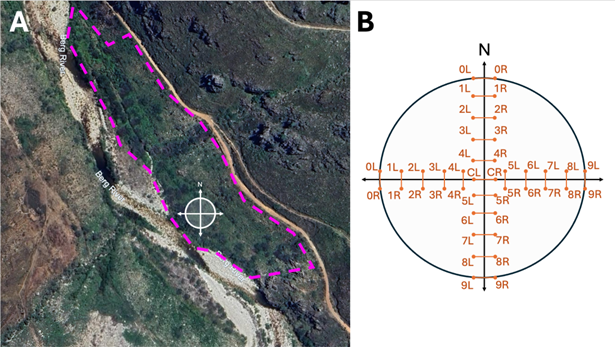
Figure 1. Vegetation plots were erected in a patch of vegetation representative of the plant community at each predetermined site. A) The pink lines show the vegetation patch boundary. The circle with NS and EW transects shows the 10-m diameter plot, divided into four quadrants. B) The naming convention of the MetersAlongLine column in the LineIntercept file corresponds to where plant identifications were recorded.
Citation
Slimp, M., J. Malindi, R. Meyer, A. Cunningham, J. Rourke, M. Hayden, A. Hargey, J. Nesslage, S. Johnson, M. Rossi, and N. Stavros. 2025. BioSCape Vegetation Surveys Berg and Eerste River Catchments, South Africa, 2022-2023. ORNL DAAC, Oak Ridge, Tennessee, USA. https://doi.org/10.3334/ORNLDAAC/2425
Table of Contents
- Dataset Overview
- Data Characteristics
- Application and Derivation
- Quality Assessment
- Data Acquisition, Materials, and Methods
- Data Access
- References
Dataset Overview
This dataset contains vegetation plot survey data collected at 36 sites across the Berg and Eerste River catchments in the Western Cape, South Africa collected during 2022 and again in 2023 during the 2023 BioSCape Field Collection season. Sampling protocols were designed by the BioSCape Leadership team for use by multiple teams to generate standardized and comparable vegetation plot data across sites. Each plot was circular, 10 m in diameter, and representative of the vegetation community. Species were identified at each 1-m mark along the N-S and W-E transects, totaling 42 identifications per plot. Fractional ground cover of the plot, fractional vegetation dominance, and rarefaction counts for each plot were recorded at all plots from 2023. Data from 2022 have fractional ground cover of the NE quadrant and fractional vegetation dominance. The boundaries of the patches where the vegetation plots were located were recorded as polygons.
Project: Biodiversity Survey of the Cape (BioSCape)
The Biodiversity Survey of the Cape (BioSCape) is an international collaboration between South Africa and the United States to study biodiversity in South Africa’s Greater Cape Floristic Region (GCFR). The GCFR was selected due to two exceptional hotspots of both terrestrial and aquatic biodiversity. The GCFR is listed among the World’s 200 Significant Ecoregions. The BioSCape is an integrated field and airborne campaign occurring in 2023. The campaign will collect UV/visible to short wavelength infrared (UVSWIR) and thermal imaging spectroscopy and laser altimetry LiDAR data over terrestrial and aquatic targets using four airborne instruments: Airborne Visible InfraRed Imaging Spectrometer - Next Generation (AVIRIS-NG), Portable Remote Imaging SpectroMeter (PRISM), Land, Vegetation, and Ice Sensor (LVIS), and Hyperspectral Thermal Emission Spectrometer (HyTES). The anticipated airborne data set is unique in its size and scope and unprecedented in its instrument combination and level of detail. These airborne data will be accompanied by a range of biodiversity-related field observations. BioSCape’s primary objective is to understand the structure, function, and composition of the region’s ecosystems, and to learn about how and why they are changing in time and space.
Related Publications
Cardoso, A.W., E.L. Hestir, J.A. Slingsby, C.J. Forbes, G.R. Moncrieff, W. Turner, A.L. Skowno, J. Nesslage, P.G. Brodrick, K.D. Gaddis, and A.M. Wilson. 2025. The biodiversity survey of the Cape (BioSCape), integrating remote sensing with biodiversity science. npj biodivers 4:2. https://doi.org/10.1038/s44185-024-00071-5
Cardoso, A.W. and The BioSCape Consortium. 2025. BioSCape combines local knowledge and remote-sensing technology for inclusive biodiversity science. Nature Reviews Biodiversity 1:2-4. https://doi.org/10.1038/s44358-024-00007-8
Related Datasets
Clark, M., L. Salas, R. Snyder, A. Lee, A.A. Turner, C. Seymour, J. Measey, A. Ferraz, F.D. Schneider, and F. Adebgola. 2025. BioSCape: BioSoundSCape Acoustic Recordings, South Africa, 2023. ORNL DAAC, Oak Ridge, Tennessee, USA. https://doi.org/10.3334/ORNLDAAC/2372
Acknowledgement
The BioSCape program is funded by NASA grant 80NSSC21K0086, the South African government (NRF/SAEON), and the United Nations Educational, Scientific and Cultural Organization (UNESCO). Funding for this BioSCape sub-project was provided by NASA grant 80NSSC22K0832. We would like to thank the Berg and Eerste Rivers landowners who permitted our team to come and collect on their property. We also thank Cape Nature for access to reserve land. Thank you to Jackson DeWitt for helping with data formatting.
Data Characteristics
Spatial Coverage: Western Cape of South Africa, Berg and Eerste River catchments
Spatial Resolution: Point
Temporal Coverage: 2022-09-19 to 2023-11-11
Temporal Resolution: Once in the dry season in 2022 and once in the rainy season in 2023
Site Boundaries: Latitude and longitude are given in decimal degrees.
| Site | Westernmost Longitude | Easternmost Longitude | Northernmost Latitude | Southernmost Latitude |
|---|---|---|---|---|
| Western Cape of South Africa, Berg and Eerste River catchments | 18.7789 | 19.1165 | -32.9961 | -33.9858 |
Data File Information
There are four files in .csv format and two files in .KML format in this data set. The files are described in Table 1.
Table 1. File names and descriptions
| File Name | Description |
|---|---|
| Berg_Eerste_Veg_SiteData.csv | Site information such as coordinates, survey date, general observations, and ground cover observations |
| Berg_Eerste_Veg_Rarefaction2023.csv | Data from rarefaction counts in 2023: total species lists, opportunistic species lists, and general plot observations |
| Berg_Eerste_Veg_LineIntercept.csv | Species identifications across the transects |
| Berg_Eerste_Veg_PlotCoverage.csv | Percent cover of dominant species per quadrant |
| Berg_Eerste_Veg_vegplotboundaries_2022.kml Berg_Eerste_Veg_vegplotboundaries_2023.kml |
Polygons for the site vegetation patch boundaries. Attributes include plot name and description |
Variables in the csv data files-For all files, missing text values are provided as NA and missing numeric values are provided as -9999.
Table 2. Variables in the file Berg_Eerste_Veg_SiteData.csv
| Variable | Units/format | Description |
|---|---|---|
| Year | YYYY | Year of survey |
| SiteCode | Short text codes that describe where the plots are located (e.g. Cederberg) | |
| Plot | Plot number | |
| SiteCode_Plot | SIte code and plot combined | |
| Quadrant | Plot quadrant, labelled according to orientation (e.g. north-west quadrant) | |
| SiteCode_Plot_Quadrant | Unique plot label given to the plot quadrant | |
| GPS_PlotCenter_Latitude | degrees north | GPS coordinates of the plot center (latitude) in decimal degrees |
| GPS_PlotCenter_Longitude | degrees east | GPS coordinates of the plot center (longitude) in decimal degrees |
| Date | YYYY-MM-DD | Date plot quadrant was surveyed |
| PercentBareSoil | percent | Visual estimate of the percent bare soil as seen from above |
| PercentBareRock | percent | Visual estimate of the percent bare rock as seen from above |
| PercentDeadVegetation | percent | Visual estimate of the percent dead vegetation as seen from above |
| PercentLiveVegetation | percent | Visual estimate of the percent live vegetation as seen from above |
| TotalCover_Check | percent | A column to check that percentage cover estimates total 100% |
| VegHeight | cm | Visual estimate of mean vegetation heigh in the plot |
| Comments | Comments |
Table 3. Variables in the file Berg_Eerste_Veg_Rarefaction2023.csv
| Variable | Description |
|---|---|
| Year | Year of survey |
| Site | Study site |
| Rarefaction | Rarefaction is a count of all unique plant species that were found within the 10m plot in 5 minutes time |
| General_Plot_Observations | Visual plot observations noting the appearance of the plots, ground cover, location descriptions, etc. |
| Inplot_Species_Observation | List of species observed inside plot |
| Outplot_Species_Observation | List of species observed outside of plot |
| Comments | Additional comments |
Table 4. Variables in the file Berg_Eerste_Veg_LineIntercept.csv
| Variable | units | Description |
|---|---|---|
| Year | YYYY | Year of survey |
| SiteCode_Plot | Plot site code | |
| LineTransect | The North-South line (NS) or the West-East line (WE) | |
| SiteCode_Plot_LineTransect | Line transect label. | |
| MetersAlongLine | Distance along the line (0, 1, 2 meters etc) and whether the species noted were on the right or left (R or L) | |
| AcceptedSpecies | Observed species name | |
| Comments | Comments |
Table 5. Variables in the file Berg_Eerste_Veg_PlotCoverage.csv
| Variable | units | Description |
|---|---|---|
| Year | YYYY | Year of survey |
| SiteCode_Plot_Quadrant | Site plot quadrant | |
| AcceptedSpecies | Observed species name | |
| PercentCoverAlive | percent | Visual estimate of the percentage of that species that is alive in the plot quadrant |
| PercentCoverDead | percent | Visual estimate of the percentage of that species that is dead in the plot quadrant |
| Comment | General observations regarding the quadrant |
Application and Derivation
These data describe terrestrial vegetation along the Berg and Eerste Rivers in September-October of 2022 and October-November of 2023. The data can be used with other analogous vegetation plots from the BioSCape program teams, which use the same vegetation plot protocol, to understand the Western Cape vegetation during the BioSCape flight data collection period.
Quality Assessment
Uncertainty for the center point of the vegetation plot and patch polygon boundaries had a maximum error of 5 m.
Data Acquisition, Materials, and Methods
Vegetation plot data were collected during 2022 and 2023 during the 2023 BioSCape field collection season. The data were collected at 36 predetermined sites along the Berg (32 sites) and Eerste (4 sites) rivers, which flank pristine, public/urban, and agricultural land. Explicit permission from landowners was obtained if the site was on private land and had a Cape Nature permit to access reserve and public land.
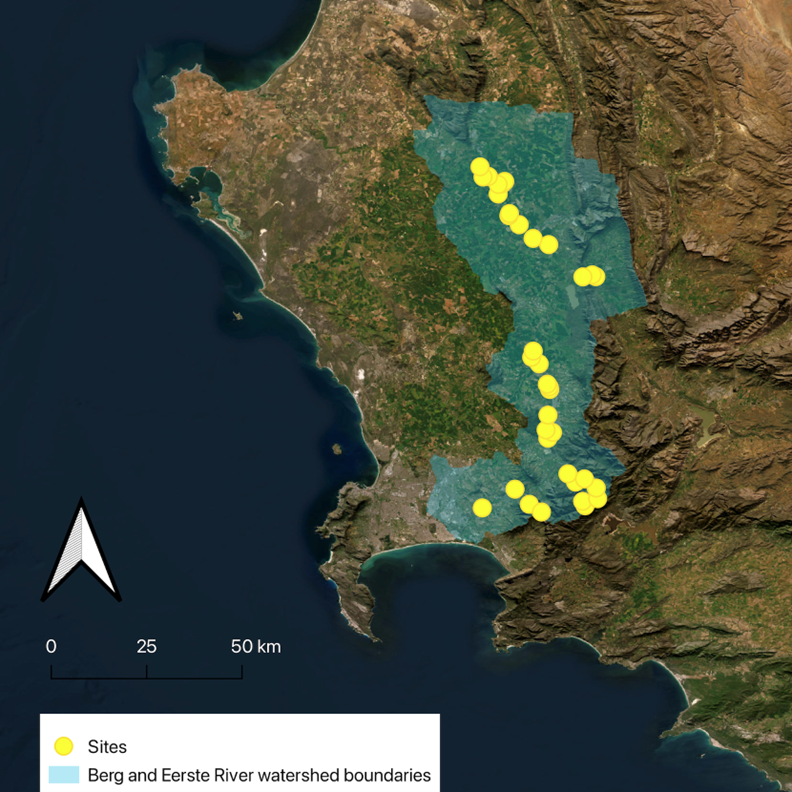
Figure 2. Map indicating the study sites along the Berg and Eerste River watershed boundaries.
This sampling protocol was designed by the BioSCape Leadership team for use by multiple teams to generate standardized and comparable vegetation plot data across sites. A patch of vegetation was found representative of the flanking plant communities of the river, which had to be large enough to fit a 10-m diameter plot. Stakes were used to mark the center point of the plots and the NS and EW transects, and ropes were ran to mark each meter point. The coordinates of the center points were recorded. The boundaries of the vegetation patches were mapped with a GPS-enabled field mapping application (TouchGIS) by walking their perimeters. Uncertainty for the center point of the vegetation plot and patch polygon had a maximum error of 5 m.
General observations were made about the plot, and in 2023, vegetation height was collected, and rarefaction counts for all unique species that could be found in the plots within five minutes (labeled INPLOT). Occasionally, species were recorded outside the plot (labeled OUTPLOT) to verify the eDNA data later. For the 2022 plots, the fractional ground cover of the NE quadrant of the plots was recorded, and in 2023, the data were collected for all quadrants in the plot. Then, observers walked along the NS transect, identifying each plant at the rope's left and right of each 1-m mark from a canopy view to match observations with the remote sensing data. Observers did the same for the EW transect, totaling 42 plant identifications per plot. If there were no plants directly to the left and right of the meter mark, ground cover was reported instead. Species identifications were made by consulting regional expert botanists and referencing regional plant books and taxonomic keys (e.g., Manning and Goldblatt, 2012). Where species-level identification could not be made, the closest taxonomic description was recorded. The fractional cover was then estimated for each plant species by quadrant. Species were opportunistically recorded at the understory level for later use to verify eDNA data.
Data Access
These data are available through the Oak Ridge National Laboratory (ORNL) Distributed Active Archive Center (DAAC).
BioSCape Vegetation Surveys Berg and Eerste River Catchments, South Africa, 2022-2023
Contact for Data Center Access Information:
- E-mail: uso@daac.ornl.gov
- Telephone: +1 (865) 241-3952
References
Cardoso, A.W., E.L. Hestir, J.A. Slingsby, C.J. Forbes, G.R. Moncrieff, W. Turner, A.L. Skowno, J. Nesslage, P.G. Brodrick, K.D. Gaddis, and A.M. Wilson. 2025. The biodiversity survey of the Cape (BioSCape), integrating remote sensing with biodiversity science. npj biodivers 4:2. https://doi.org/10.1038/s44185-024-00071-5
Cardoso, A.W. and The BioSCape Consortium. 2025. BioSCape combines local knowledge and remote-sensing technology for inclusive biodiversity science. Nature Reviews Biodiversity 1:2-4. https://doi.org/10.1038/s44358-024-00007-8
Clark, M., L. Salas, R. Snyder, A. Lee, A.A. Turner, C. Seymour, J. Measey, A. Ferraz, F.D. Schneider, and F. Adebgola. 2025. BioSCape: BioSoundSCape Acoustic Recordings, South Africa, 2023. ORNL DAAC, Oak Ridge, Tennessee, USA. https://doi.org/10.3334/ORNLDAAC/2372
Manning, J., and P. Goldblatt. 2012. Plants of the Greater Cape Floristic Region. 1: the Core Cape Flora. Strelitzia 29. South African National Biodiversity Institute (SANBI) Publishing; Pretoria, South Africa. https://www.sanbi.org/documents/plants-of-the-greater-cape-floristic-region-the-core-cape-flora-strelitzia-29/