Documentation Revision Date: 2025-06-09
Dataset Version: 1
Summary
The NASA AVIRIS-NG is a pushbroom spectral mapping system with high signal-to-noise ratio (SNR), designed and toleranced for high performance spectroscopy. AVIRIS-NG measures reflected radiance at 5-nm intervals in the Visible to Shortwave Infrared (VSWIR) spectral range from 380-2510 nm. The AVIRIS-NG sensor has a 1 milliradian instantaneous field of view, providing altitude dependent ground sampling distances from 20 m to sub meter range. The AVIRIS-NG was flown on a NASA Gulfstream III aircraft.
The dataset includes 3647 files in netCDF format.
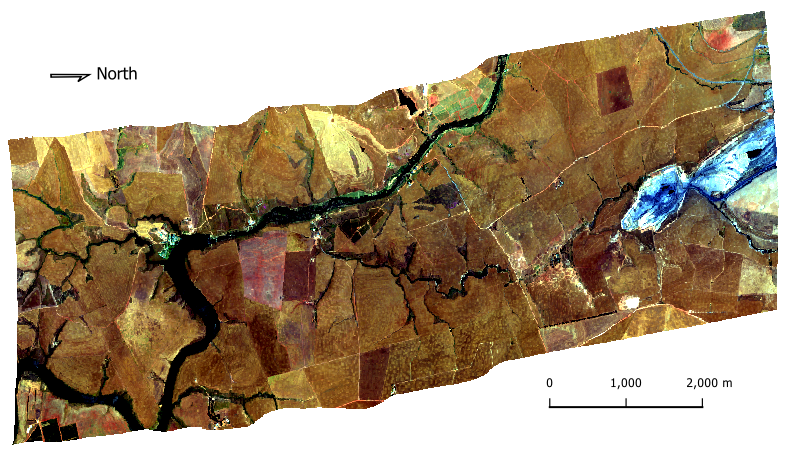
Figure 1. RGB rendering of corrected surface reflectance from AVIRIS-NG flight ang20231022t092801, scene 000, on October 22, 2023, south of Piketberg in Western Cape, South Africa (approximately -33.00 lat, 18.79 lon). Wavelengths: R 658, G 547, B 437 nm. Source: ang20231022t092801_000_L2B_OE_0b4f48b4_RFL_ORT_tbg_v1.nc
Citation
Kovach, K.R., Z. Ye, H. Frye, and P.A. Townsend. 2025. BioSCape: AVIRIS-NG L2B Enhanced Surface Reflectance. ORNL DAAC, Oak Ridge, Tennessee, USA. https://doi.org/10.3334/ORNLDAAC/2385
Table of Contents
- Dataset Overview
- Data Characteristics
- Application and Derivation
- Quality Assessment
- Data Acquisition, Materials, and Methods
- Data Access
- References
Dataset Overview
This dataset holds corrected surface reflectance (L2B) from the Airborne Visible / Infrared Imaging Spectrometer-Next Generation (AVIRIS-NG) instrument flown on a NASA Gulfstream III aircraft during the Biodiversity Survey of the Cape (BioSCape) project. AVIRIS-NG imagery was acquired in October - November 2023 over the Greater Cape Floristic Region (GCFR), South Africa. BioSCape is a multi-agency, NASA-led research project that integrates airborne imaging spectroscopy and lidar with a suite of measurements of biodiversity. L2B surface reflectance was derived from L1B radiance data in 425 bands, and this enhanced L2B product includes topographic, glint, and bidirectional reflectance distribution function (BRDF) corrections. Data were georeferenced and projected into UTM coordinates. These files hold the original native ancillary information relevant to the image, as well as the ancillary masks used in the creation and parameterization of the topography, glint, and BRDF corrections applied to enhance these image products.
The NASA AVIRIS-NG is a pushbroom spectral mapping system with high signal-to-noise ratio (SNR), designed and toleranced for high performance spectroscopy. AVIRIS-NG measures reflected radiance at 5-nm intervals in the Visible to Shortwave Infrared (VSWIR) spectral range from 380-2510 nm. The AVIRIS-NG sensor has a 1 milliradian instantaneous field of view, providing altitude dependent ground sampling distances from 20 m to sub meter range. The AVIRIS-NG was flown on a NASA Gulfstream III aircraft.
Project: Biodiversity Survey of the Cape (BioSCape)
The Biodiversity Survey of the Cape (BioSCape) is an international collaboration between South Africa and the United States to study biodiversity in South Africa’s Greater Cape Floristic Region (GCFR). The GCFR was selected due to two exceptional hotspots of both terrestrial and aquatic biodiversity. The GCFR is listed among the World’s 200 Significant Ecoregions. The BioSCape is an integrated field and airborne campaign occurring in 2023. The campaign will collect UV/visible to short wavelength infrared (UVSWIR) and thermal imaging spectroscopy and laser altimetry LiDAR data over terrestrial and aquatic targets using four airborne instruments: Airborne Visible InfraRed Imaging Spectrometer - Next Generation (AVIRIS-NG), Portable Remote Imaging SpectroMeter (PRISM), Land, Vegetation, and Ice Sensor (LVIS), and Hyperspectral Thermal Emission Spectrometer (HyTES). The anticipated airborne data set is unique in its size and scope and unprecedented in its instrument combination and level of detail. These airborne data will be accompanied by a range of biodiversity-related field observations. BioSCape’s primary objective is to understand the structure, function, and composition of the region’s ecosystems, and to learn about how and why they are changing in time and space.
Related Publications:
Cardoso, A.W. and The BioSCape Consortium. 2025. BioSCape combines local knowledge and remote-sensing technology for inclusive biodiversity science. Nature Reviews Biodiversity 1:2-4. https://doi.org/10.1038/s44358-024-00007-8
Cardoso, A., E. Hestir, J. Slingsby, C. Forbes, G. Moncrieff, W. Turner, A. Skowno, J. Nesslage, P. Brodrick, K. Gaddis, and A. Wilson. 2025. The biodiversity survey of the Cape (BioSCape), integrating remote sensing with biodiversity science. npj Biodiversity 4:2. https://doi.org/10.1038/s44185-024-00071-5
Related Datasets:
Brodrick, P.G., A.M. Chlus, R. Eckert, J.W. Chapman, M. Eastwood, S. Geier, M. Helmlinger, S.R. Lundeen, W. Olson-Duvall, R. Pavlick, L.M. Rios, D.R. Thompson, and R.O. Green. 2025. BioSCape: AVIRIS-NG L3 Resampled Reflectance Mosaics, V2. ORNL DAAC, Oak Ridge, Tennessee, USA. https://doi.org/10.3334/ORNLDAAC/2427
Green, R.O., P.G. Brodrick, J.W. Chapman, M. Eastwood, S. Geier, M. Helmlinger, S.R. Lundeen, W. Olson-Duvall, R. Pavlick, L.M. Rios, D.R. Thompson, and A.K. Thorpe. 2023. AVIRIS-NG L1B Calibrated Radiance, Facility Instrument Collection, V1. ORNL DAAC, Oak Ridge, Tennessee, USA. https://doi.org/10.3334/ORNLDAAC/2095
Green, R.O., P.G. Brodrick, J.W. Chapman, M. Eastwood, S. Geier, M. Helmlinger, S.R. Lundeen, W. Olson-Duvall, R. Pavlick, L.M. Rios, D.R. Thompson, and A.K. Thorpe. 2023. AVIRIS-NG L2 Surface Reflectance, Facility Instrument Collection, V1. ORNL DAAC, Oak Ridge, Tennessee, USA. https://doi.org/10.3334/ORNLDAAC/2110
- Other Level 1B and L2 reflectance products from AVIRIS-NG.
Green, R.O., P.G. Brodrick, J.W. Chapman, M. Eastwood, S. Geier, M. Helmlinger, S.R. Lundeen, W. Olson-Duvall, R. Pavlick, L.M. Rios, D.R. Thompson, and A.K. Thorpe. 2023. AVIRIS Facility Instruments: Flight Line Geospatial Polygons and Contextual Data, V1. ORNL DAAC, Oak Ridge, Tennessee, USA. https://doi.org/10.3334/ORNLDAAC/2140
- Flight line ancillary information in tabular and attributed polygon vector files
Acknowledgements:
The BioSCape Project is a multi-agency, NASA-led research project that integrates airborne imaging spectroscopy (AVIRIS NG) and lidar (LVIS) with a suite of surface measures of biodiversity. Funding support for BioSoundSCape was provided by NASA grants 80NSSC22K0830 and 80NSSC23K1459. BioSCape was supported by NASA grant 80NSSC21K0086, the South African government (NRF/SAEON), and the United Nations Educational, Scientific and Cultural Organization (UNESCO).
Data Characteristics
Spatial Coverage: Greater Cape Floristic Region (GCFR), South Africa
Spatial Resolution: nominal 5 m; varies from 1 to 11 m among flight scenes
Temporal Coverage: 2023-10-22 to 2023-11-26
Temporal Resolution: Daily, weather permitting, during deployment
Site Boundaries: Latitude and longitude are given in decimal degrees.
| Site | Westernmost Longitude | Easternmost Longitude | Northernmost Latitude | Southernmost Latitude |
|---|---|---|---|---|
| Greater Cape Floristic Region, South Africa | 17.7847 | 26.2556 | -31.2347 | -34.9172 |
Data File Information
The dataset includes corrected surface reflectance for 3647 flight scenes in netCDF-4 format.
The file naming convention is <flight prefix>_<scene>_L2B_OE_<ver>_RFL_ORT_tbg_v1.nc, where
- <flight prefix> = flight line identifier, angYYYMMDDthhmmss, encoding the date and time by year (YYYY), month (MM), day (DD), hour (hh), minute (mm), and second (ss) of the flight (e.g., ang20200708t192518).
- <scene> = scene ID along the flight line as a three digit number (e.g., "000", "001", "002", etc.)
- <ver> = unique seven character identifier of full heritage versioning.
- "RFL_ORT_tbg" indicates orthorectified surface reflectance with topographic, BRDF, and glint corrections applied.
The netCDFs hold surface reflectance in the UTM projected coordinate system using WGS 84 datum. The UTM zones are 33S, 34S, or 35S and are indicated in the netCDF metadata (WGS-84 datum, EPSG 32733, 32734 and 32735).
Example file names: ang20231126t114819_000_L2B_OE_0b4f48b4_RFL_ORT_tbg_v1.nc, ang20231126t114819_001_L2B_OE_0b4f48b4_RFL_ORT_tbg_v1.nc, ang20231126t114819_002_L2B_OE_0b4f48b4_RFL_ORT_tbg_v1.nc
Table 1. Variables in the netCDF-4 files.
| Variable | Group | Units | Description |
|---|---|---|---|
| wavelength | reflectance | nm | Reflectance band wavelength center, n = 425 |
| fwhm | nm | Full width at half maximum for band wavelength, n=425 | |
| reflectance | 1 | Corrected surface reflectance factor, dimensions: x, y, wavelength | |
| topo_ndi_850_660 | masks | 1 | Normalized difference index (NDI) mask used in the filtering of pixels for topographic correction |
| topo_band | Band at 1100 nm used for excluding over-saturated pixels | ||
| topo_ancillary_slope | (slope >5 deg) mask used in the estimation of the topography parameters | ||
| topo_ancillary_cosine_i | Illumination factor (cosine_i>0.12) mask used in estimation of topography parameters | ||
| brdf_ndi_850_660 | NDI mask used in the filtering of pixels for BRDF correction | ||
| brdf_band | Band at 1100 nm used for excluding over-saturated pixels | ||
| glint_ndi_850_660 | NDI mask used in the filtering of pixels for glint correction |
Application and Derivation
The AVIRIS-NG sensor collects data that can be used for characterization of the Earth's surface and atmosphere from geometrically coherent spectroradiometric measurements. This data can be applied to studies in the fields of oceanography, environmental science, snow hydrology, geology, volcanology, soil and land management, atmospheric and aerosol studies, agriculture, and limnology. Applications include the quantitative evaluation of geologic, vegetation, hydrologic, and aquatic systems, as well as the assessment and monitoring of environmental hazards such as toxic waste, oil spills, and land/air/water pollution. With proper calibration and correction for atmospheric effects, the measurements can be converted to ground reflectance data which can then be used for quantitative characterization of surface features.
NASA’s BioSCape project is an integrated field and airborne campaign occurring in the hyperdiverse Cape Floristic Region of South Africa in October and November of 2023. The campaign collected UV/visible to short wavelength infrared (UVSWIR) and thermal imaging spectroscopy and laser altimetry LiDAR data over terrestrial and aquatic targets using four airborne instruments: AVIRIS-NG, PRISM, LVIS, and HyTES. The airborne data set is unique in its size and scope and unprecedented in its instrument combination and level of detail. These airborne data are accompanied by a range of biodiversity-related field observations. BioSCape’s primary objective is to understand the structure, function, and composition of the region’s ecosystems, and to learn about how and why they are changing in time and space.
Quality Assessment
The AVIRIS-NG calibration procedure addresses electronic effects involving radiometric responses of each detector, optical effects involving the spatial and spectral view of each detector, and radiometric calibration. Detector responsiveness is measured at the beginning of each deployment and mid-flight for particularly long deployments. Instrument artifacts in the spectrometer data, such as striping, are removed statistically by minimizing a Markov Random Field model. Likewise, bad pixels are identified and corrected using statistical methods followed by laboratory and field protocols to evaluate effectiveness. Details of calibration methods are available in Chapman et al. (2019).
Data Acquisition, Materials, and Methods
South Africa’s Greater Cape Floristic Region (GCFR) is a globally important region for biodiversity with the richest temperate flora and the third highest marine endemism in the world. It contains two Global Biodiversity Hotspots and is experiencing climate-driven changes in biodiversity, which are predicted to continue. GCFR’s vulnerability is compounded by ecological feedbacks between water scarcity, fire, and pressures from human populations.
The BioSCape campaign’s focus was on biological diversity. It spanned both terrestrial and aquatic realms and included research on both plant and animal life (Cardoso et al., 2025b). The primary objective for this campaign was to understand the structure, function, and composition of the region’s ecosystems, and to learn about how and why they are changing in time and space. The campaign was organized around three major themes, aimed at understanding:
- the distribution and abundance of biodiversity,
- the role of biodiversity in ecosystem function, and
- the impacts of biodiversity change on ecosystem services.
The experimental design for BioSCape was based on combining in-situ field data with airborne remote sensing data to answer questions about Earth’s natural systems. In October-November 2023, the BioSCape project collected hyperspectral, thermal infrared, and laser altimeter data over the terrestrial and aquatic realms of the GCFR. The airborne instruments deployed include Airborne Visible InfraRed Imaging Spectrometer - Next Generation (AVIRIS-NG), Portable Remote Imaging SpectroMeter (PRISM), Land, Vegetation, and Ice Sensor (LVIS), and Hyperspectral Thermal Emission Spectrometer (HyTES).
The Airborne Visible-Infrared Imaging Spectrometer (AVIRIS-NG) was developed to provide continued access to high signal-to-noise ratio imaging spectroscopy measurements in the solar reflected spectral range (Green et al., 1998). AVIRIS-NG measures the wavelength range from 380 nm to 2510 nm with 5-nm sampling. Spectra are measured as images with 600 cross-track elements and spatial sampling from 0.3 m to 4.0 m. AVIRIS-NG has better than 95% cross-track spectral uniformity and >= 95% spectral instantaneous field of view (IFOV) uniformity. AVIRIS-NG was flown on a Gulfstream III aircraft for the BioSCape campaign. Additional details about the AVIRIS-NG instrument are available at https://doi.org/10.3334/ORNLDAAC/2095.
AVIRIS-NG instrument data were processed to Level 1 radiance using AVIRIS-NG calibration software, followed by atmospheric correction to Hemispherical Directional Reflectance Factor (HDRF) through the ISOFIT (https://github.com/isofit/isofit) surface and atmospheric modeling package, by NASA’s Jet Propulsion Laboratory.
These L2 products were derived from L1B radiance products (Green et al., 2023a) using Optimal Estimation adapted for imaging spectroscopy as outlined in Thompson et al. (2018) via ISOFIT v3.2.2 (Brodrick et al., 2024). The netCDF files list the wavelengths and full width half maximum (fwhm) values for each band.
Downstream corrections for topographic, glint, and bidirectional reflectance distribution function (BRDF) effects were applied to the L2 imagery to create an L2 enhanced product distributed here. Imagery includes hyperspectral reflectances that have been BRDF/topographically normalized and have had a glint correction applied in aquatic areas. The processing includes: BRDF and Topographic Normalization using FlexBRDF (Queally et al., 2022) and aquatic sunglint correction following Greenberg et al. (2022).
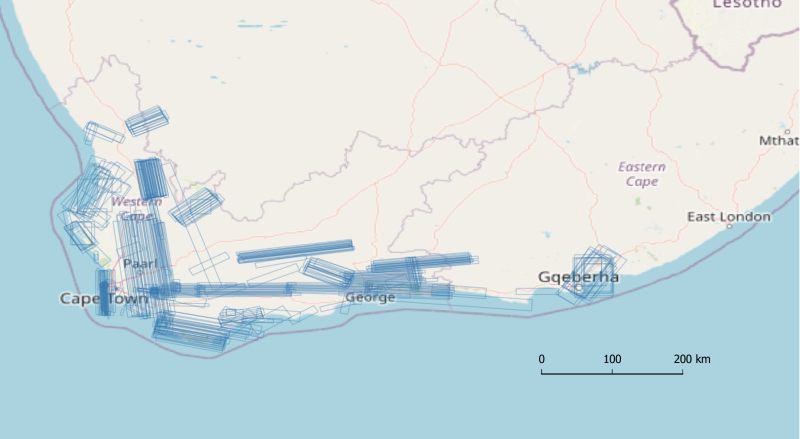
Figure 2. Distribution of AVIRIS-NG flight lines with L2B enhanced surface reflectance in South Africa’s Greater Cape Floristic Region (GCFR). Footprints of flight lines are shown as blue rectangles. Basemap: © OpenStreetMap contributors.
Data Access
These data are available through the Oak Ridge National Laboratory (ORNL) Distributed Active Archive Center (DAAC).
BioSCape: AVIRIS-NG L2B Enhanced Surface Reflectance
Contact for Data Center Access Information:
- E-mail: uso@daac.ornl.gov
- Telephone: +1 (865) 241-3952
References
Brodrick, P.G., A.M. Chlus, R. Eckert, J.W. Chapman, M. Eastwood, S. Geier, M. Helmlinger, S.R. Lundeen, W. Olson-Duvall, R. Pavlick, L.M. Rios, D.R. Thompson, and R.O. Green. 2025. BioSCape: AVIRIS-NG L3 Resampled Reflectance Mosaics, V2. ORNL DAAC, Oak Ridge, Tennessee, USA. https://doi.org/10.3334/ORNLDAAC/2427
Brodrick, P.G., D.R. Thompson, N. Bohn, N. Carmon, R. Eckert, J. Montgomery, K. Wurster, and N. Vaughn. 2024. isofit (v3.2.2). Zenodo. https://doi.org/10.5281/zenodo.14135462
Cardoso, A.W. and The BioSCape Consortium. 2025a. BioSCape combines local knowledge and remote-sensing technology for inclusive biodiversity science. Nature Reviews Biodiversity 1:2-4. https://doi.org/10.1038/s44358-024-00007-8
Cardoso, A., E. Hestir, J. Slingsby, C. Forbes, G. Moncrieff, W. Turner, A. Skowno, J. Nesslage, P. Brodrick, K. Gaddis, and A. Wilson. 2025b. The biodiversity survey of the Cape (BioSCape), integrating remote sensing with biodiversity science. npj Biodiversity 4:2. https://doi.org/10.1038/s44185-024-00071-5
Chapman, J.W., D.R. Thompson, M.C. Helmlinger, B.D. Bue, R.O. Green, M.L. Eastwood, S. Geier, W. Olson-Duvall, and S.R. Lundeen. 2019. Spectral and radiometric calibration of the Next Generation Airborne Visible Infrared Spectrometer (AVIRIS-NG). Remote Sensing 11: 2129. https://doi.org/10.3390/rs11182129
Green, R.O., P.G. Brodrick, J.W. Chapman, M. Eastwood, S. Geier, M. Helmlinger, S.R. Lundeen, W. Olson-Duvall, R. Pavlick, L.M. Rios, D.R. Thompson, and A.K. Thorpe. 2023a. AVIRIS-NG L1B Calibrated Radiance, Facility Instrument Collection, V1. ORNL DAAC, Oak Ridge, Tennessee, USA. https://doi.org/10.3334/ORNLDAAC/2095
Green, R.O., P.G. Brodrick, J.W. Chapman, M. Eastwood, S. Geier, M. Helmlinger, S.R. Lundeen, W. Olson-Duvall, R. Pavlick, L.M. Rios, D.R. Thompson, and A.K. Thorpe. 2023b. AVIRIS-NG L2 Surface Reflectance, Facility Instrument Collection, V1. ORNL DAAC, Oak Ridge, Tennessee, USA. https://doi.org/10.3334/ORNLDAAC/2110
Green, R.O., P.G. Brodrick, J.W. Chapman, M. Eastwood, S. Geier, M. Helmlinger, S.R. Lundeen, W. Olson-Duvall, R. Pavlick, L.M. Rios, D.R. Thompson, and A.K. Thorpe. 2023. AVIRIS Facility Instruments: Flight Line Geospatial Polygons and Contextual Data, V1. ORNL DAAC, Oak Ridge, Tennessee, USA. https://doi.org/10.3334/ORNLDAAC/2140
Greenberg, E., D.R. Thompson, D. Jensen, P. A. Townsend, N. Queally, A. Chlus, C.G. Fichot, J.P. Harringmeyer, and M. Simard. 2022. An improved scheme for correcting remote spectral surface reflectance simultaneously for terrestrial BRDF and water-surface sunglint in coastal environments. Journal of Geophysical Research: Biogeosciences 127:e2021JG006712. https://doi.org/10.1029/2021JG006712
Queally, N., Z. Ye, T. Zheng, A. Chlus, F. Schneider, R.P. Pavlick, and P.A. Townsend. 2022. FlexBRDF: A flexible BRDF correction for grouped processing of airborne imaging spectroscopy flightlines. Journal of Geophysical Research: Biogeosciences 127:e2021JG006622. https://doi.org/10.1029/2021JG006622
Thompson, D.R., V. Natraj, R.O. Green, M.C. Helmlinger, B.-C. Gao, and M.L. Eastwood. 2018. Optimal estimation for imaging spectrometer atmospheric correction. Remote Sensing of Environment 216:355-373. https://doi.org/10.1016/j.rse.2018.07.003