Documentation Revision Date: 2025-05-09
Dataset Version: 2
Summary
The NASA AVIRIS-NG is a pushbroom spectral mapping system with high signal-to-noise ratio (SNR), designed and toleranced for high performance spectroscopy. AVIRIS-NG measures reflected radiance at 5-nm intervals in the Visible to Shortwave Infrared (VSWIR) spectral range from 380-2510 nm. The AVIRIS-NG sensor has a 1 milliradian instantaneous field of view, providing altitude dependent ground sampling distances from 20 m to sub meter range. The AVIRIS-NG was flown on a NASA Gulfstream III aircraft.
The dataset includes surface reflectance with uncertainty for 807 tiles in netCDF format along with an RGB quicklook image in TIFF format. A spatial index of mosaic grid ties is included in GeoJSON format.

Figure 1. Portion of quicklook image from mosaic tile 28_53 over the Lopende River region in Western Cape, South Africa (approximately -33.54 lat, 22.90 lon). Source: AVIRIS-NG_BIOSCAPE_V02_L3_28_53_QL.tif
Citation
Brodrick, P.G., A.M. Chlus, R. Eckert, J.W. Chapman, M. Eastwood, S. Geier, M. Helmlinger, S.R. Lundeen, W. Olson-Duvall, R. Pavlick, L.M. Rios, D.R. Thompson, and R.O. Green. 2025. BioSCape: AVIRIS-NG L3 Resampled Reflectance Mosaics, V2. ORNL DAAC, Oak Ridge, Tennessee, USA. https://doi.org/10.3334/ORNLDAAC/2427
Table of Contents
- Dataset Overview
- Data Characteristics
- Application and Derivation
- Quality Assessment
- Data Acquisition, Materials, and Methods
- Data Access
- References
Dataset Overview
This dataset holds mosaics of resampled surface reflectance from the Airborne Visible / Infrared Imaging Spectrometer-Next Generation (AVIRIS-NG) instrument for Biodiversity Survey of the Cape (BioSCape) project. AVIRIS-NG imagery was acquired in October - November 2023 over the Greater Cape Floristic Region (GCFR), South Africa. L2B surface reflectance data from these AVIRIS-NG collections were resampled to 5-m spatial resolution and mosaiced into a regular tile system of 807 tiles. A given tile includes multiple AVIRIS-NG scenes from multiple flight lines spanning multiple days. BioSCape is a multi-agency, NASA-led research project that integrates airborne imaging spectroscopy and lidar with a suite of measurements of biodiversity.
Project: Biodiversity Survey of the Cape (BioSCape)
The Biodiversity Survey of the Cape (BioSCape) is an international collaboration between South Africa and the United States to study biodiversity in South Africa’s Greater Cape Floristic Region (GCFR). The GCFR was selected due to two exceptional hotspots of both terrestrial and aquatic biodiversity. The GCFR is listed among the World’s 200 Significant Ecoregions. The BioSCape is an integrated field and airborne campaign occurring in 2023. The campaign will collect UV/visible to short wavelength infrared (UVSWIR) and thermal imaging spectroscopy and laser altimetry LiDAR data over terrestrial and aquatic targets using four airborne instruments: Airborne Visible InfraRed Imaging Spectrometer - Next Generation (AVIRIS-NG), Portable Remote Imaging SpectroMeter (PRISM), Land, Vegetation, and Ice Sensor (LVIS), and Hyperspectral Thermal Emission Spectrometer (HyTES). The anticipated airborne data set is unique in its size and scope and unprecedented in its instrument combination and level of detail. These airborne data will be accompanied by a range of biodiversity-related field observations. BioSCape’s primary objective is to understand the structure, function, and composition of the region’s ecosystems, and to learn about how and why they are changing in time and space.
Related Publications:
Cardoso, A.W. and The BioSCape Consortium. 2025. BioSCape combines local knowledge and remote-sensing technology for inclusive biodiversity science. Nature Reviews Biodiversity 1:2-4. https://doi.org/10.1038/s44358-024-00007-8
Cardoso, A., E. Hestir, J. Slingsby, C. Forbes, G. Moncrieff, W. Turner, A. Skowno, J. Nesslage, P. Brodrick, K. Gaddis, and A. Wilson. 2025. The biodiversity survey of the Cape (BioSCape), integrating remote sensing with biodiversity science. npj Biodiversity 4:2. https://doi.org/10.1038/s44185-024-00071-5
Related Datasets:
Green, R.O., P.G. Brodrick, J.W. Chapman, M. Eastwood, S. Geier, M. Helmlinger, S.R. Lundeen, W. Olson-Duvall, R. Pavlick, L.M. Rios, D.R. Thompson, and A.K. Thorpe. 2023. AVIRIS-NG L1B Calibrated Radiance, Facility Instrument Collection, V1. ORNL DAAC, Oak Ridge, Tennessee, USA. https://doi.org/10.3334/ORNLDAAC/2095
Green, R.O., P.G. Brodrick, J.W. Chapman, M. Eastwood, S. Geier, M. Helmlinger, S.R. Lundeen, W. Olson-Duvall, R. Pavlick, L.M. Rios, D.R. Thompson, and A.K. Thorpe. 2023. AVIRIS-NG L2 Surface Reflectance, Facility Instrument Collection, V1. ORNL DAAC, Oak Ridge, Tennessee, USA. https://doi.org/10.3334/ORNLDAAC/2110
- Other Level 1B and L2 reflectance products from AVIRIS-NG.
Green, R.O., P.G. Brodrick, J.W. Chapman, M. Eastwood, S. Geier, M. Helmlinger, S.R. Lundeen, W. Olson-Duvall, R. Pavlick, L.M. Rios, D.R. Thompson, and A.K. Thorpe. 2023. AVIRIS Facility Instruments: Flight Line Geospatial Polygons and Contextual Data, V1. ORNL DAAC, Oak Ridge, Tennessee, USA. https://doi.org/10.3334/ORNLDAAC/2140
- Flight line ancillary information in tabular and attributed polygon vector files
Acknowledgements:
The BioSCape Project is a multi-agency, NASA-led research project that integrates airborne imaging spectroscopy (AVIRIS NG) and lidar (LVIS) with a suite of surface measures of biodiversity. Funding support for BioSoundSCape was provided by NASA grants 80NSSC22K0830 and 80NSSC23K1459. BioSCape was supported by NASA grant 80NSSC21K0086, the South African government (NRF/SAEON), and the United Nations Educational, Scientific and Cultural Organization (UNESCO).
Data Characteristics
Spatial Coverage: Greater Cape Floristic Region (GCFR), South Africa
Spatial Resolution: 5 m
Temporal Coverage: 2023-10-22 to 2023-11-26
Temporal Resolution: Daily, weather permitting, during deployment
Site Boundaries: Latitude and longitude are given in decimal degrees.
| Site | Westernmost Longitude | Easternmost Longitude | Northernmost Latitude | Southernmost Latitude |
|---|---|---|---|---|
| Greater Cape Floristic Region, South Africa | 17.6241 | 26.3228 | -31.1562 | -35.0059 |
Data File Information
The dataset includes surface reflectance with uncertainty for 807 tiles in netCDF format along with an RGB quicklook image in TIFF format. A spatial index of mosaic grid ties is included in GeoJSON format.
The file naming convention is AVIRIS-NG_BIOSCAPE_V02_L3_<tile>_<var>.<ext>, where
- <tile> = grid cell of the tiling system (e.g., "10_12")
- <var> = mapped variable: "RFL" for surface reflectance, "UNC" for reflectance uncertainty, or "QL" for quicklook image
- <ext> = extension indicating file type, "nc" for netCDF or "tif" for TIFF image.
The netCDFs hold orthorectified surface reflectance and reflectance uncertainty mapped in the Hartebeesthoek94 projected coordinate system (WGS-84 datum, EPSG 9221). The spatial resolution is 5 m.
Example file names: AVIRIS-NG_BIOSCAPE_V02_L3_10_12_RFL.nc, AVIRIS-NG_BIOSCAPE_V02_L3_10_12_UNC.nc, and AVIRIS-NG_BIOSCAPE_V02_L3_10_12_QL.tif.
There are three files for each mosaic tile packaged as a multifile granule in Earthdata. The naming system for the granule UR is AVIRIS-NG_BIOSCAPE_V02_L3_<tile>. The "granule UR" is the unique identifier for the multifile granule and can be used to locate and retrieve respective individual files in the NASA Earthdata Search API.
BioSCape_ANG_V02_L3_RFL_Mosaic_tiles.geojson provides polygon footprints of the mosaic grid tiles (Table 2).
Table 1. Variables in the netCDF files.
| Variable | Group | Units | Description |
|---|---|---|---|
| easting | - | m | Projection X coordinate; UTM easting |
| northing | m | Projection Y coordinate; UTM northing | |
| wavelength | reflectance and uncertainty | nm | Reflectance wavelength center, n = 425 |
| fwhm | nm | Full width at half maximum for wavelength, n=425 | |
| reflectance | reflectance | 1 | Mosaiced surface hemispherical directional reflectance factor |
| uncertainty | uncertainty | 1 | Uncertainty factor for surface hemispherical directional reflectance |
| path_length | obs | m | Path length from surface to sensor |
| to_sensor_azimuth | degrees | Angle from sensor line of sight to azimuth (0 to 360 degrees clockwise from N) | |
| to_sensor_zenith | degrees | Angle from sensor line of sight to zenith (0 to 90 degrees from zenith) | |
| to_sun_zenith | degrees | Angle between sun and zenith (0 to 90 degrees from zenith) | |
| solar_phase | degrees | Solar phase angle | |
| slope | degrees | Terrain slope for pixel | |
| aspect | degrees | Terrain aspect for pixel | |
| cosine_i | degrees | Angle between sensor line of sight and surface normal | |
| utc_time | h | Time since UTC midnight in decimal hours | |
| earth_sun_distance | AU | Distance from earth to sun in astronomical units | |
| scene_id | scene_info | - | ID number indicating which AVIRIS-NG scene used for pixel; indexed to scene_names |
| scene_names | - | Name of AVIRIS-NG (e.g., "ang20231126t114026_002") |
Table 2. Variables in BioSCape_ANG_V02_L3_RFL_Mosaic_tiles.geojson.
| Variable name | Description |
|---|---|
| tile | ID code for mosaic grid tile (e.g., "10_12") |
| granule | Name of the multifile granule in Earthdata using the naming convention: AVIRIS-NG_BIOSCAPE_V02_L3_<tile> |
| date | First date of this data collection: "2023-10-22" |
| project | Project name: "BioSCape" |
| platform | Airborne platform: "Gulfstream III" |
Application and Derivation
The AVIRIS-NG sensor collects data that can be used for characterization of the Earth's surface and atmosphere from geometrically coherent spectroradiometric measurements. This data can be applied to studies in the fields of oceanography, environmental science, snow hydrology, geology, volcanology, soil and land management, atmospheric and aerosol studies, agriculture, and limnology. Applications include the quantitative evaluation of geologic, vegetation, hydrologic, and aquatic systems, as well as the assessment and monitoring of environmental hazards such as toxic waste, oil spills, and land/air/water pollution. With proper calibration and correction for atmospheric effects, the measurements can be converted to ground reflectance data which can then be used for quantitative characterization of surface features (Figure 2).
NASA’s BioSCape project is an integrated field and airborne campaign occurring in the hyperdiverse Cape Floristic Region of South Africa in October and November of 2023. The campaign collected UV/visible to short wavelength infrared (UVSWIR) and thermal imaging spectroscopy and laser altimetry LiDAR data over terrestrial and aquatic targets using four airborne instruments: AVIRIS-NG, PRISM, LVIS, and HyTES. The airborne data set is unique in its size and scope and unprecedented in its instrument combination and level of detail. These airborne data are accompanied by a range of biodiversity-related field observations. BioSCape’s primary objective is to understand the structure, function, and composition of the region’s ecosystems, and to learn about how and why they are changing in time and space.
Quality Assessment
The AVIRIS-NG calibration procedure addresses electronic effects involving radiometric responses of each detector, optical effects involving the spatial and spectral view of each detector, and radiometric calibration. Detector responsiveness is measured at the beginning of each deployment and mid-flight for particularly long deployments. Instrument artifacts in the spectrometer data, such as striping, are removed statistically by minimizing a Markov Random Field model. Likewise, bad pixels are identified and corrected using statistical methods followed by laboratory and field protocols to evaluate effectiveness. Details of calibration methods are available in Chapman et al. (2019).
Uncertainty in surface reflectance is included in this dataset.
Data Acquisition, Materials, and Methods
South Africa’s Greater Cape Floristic Region (GCFR) is a globally important region for biodiversity with the richest temperate flora and the third highest marine endemism in the world. It contains two Global Biodiversity Hotspots and is experiencing climate-driven changes in biodiversity, which are predicted to continue. GCFR’s vulnerability is compounded by ecological feedbacks between water scarcity, fire, and pressures from human populations.
The BioSCape campaign’s focus was on biological diversity. It spanned both terrestrial and aquatic realms and included research on both plant and animal life (Cardoso et al., 2025b). The primary objective for this campaign was to understand the structure, function, and composition of the region’s ecosystems, and to learn about how and why they are changing in time and space. The campaign was organized around three major themes, aimed at understanding:
- the distribution and abundance of biodiversity,
- the role of biodiversity in ecosystem function, and
- the impacts of biodiversity change on ecosystem services.
The experimental design for BioSCape was based on combining in-situ field data with airborne remote sensing data to answer questions about Earth’s natural systems. In October-November 2023, the BioSCape project collected hyperspectral, thermal infrared, and laser altimeter data over the terrestrial and aquatic realms of the GCFR. The airborne instruments deployed include Airborne Visible InfraRed Imaging Spectrometer - Next Generation (AVIRIS-NG), Portable Remote Imaging SpectroMeter (PRISM), Land, Vegetation, and Ice Sensor (LVIS), and Hyperspectral Thermal Emission Spectrometer (HyTES).
The Airborne Visible-Infrared Imaging Spectrometer (AVIRIS-NG) was developed to provide continued access to high signal-to-noise ratio imaging spectroscopy measurements in the solar reflected spectral range (Green et al., 1998). AVIRIS-NG measures the wavelength range from 380 nm to 2510 nm with 5-nm sampling. Spectra are measured as images with 600 cross-track elements and spatial sampling from 0.3 m to 4.0 m. AVIRIS-NG has better than 95% cross-track spectral uniformity and >= 95% spectral instantaneous field of view (IFOV) uniformity. AVIRIS-NG was flown on a Gulfstream III aircraft for the BioSCape campaign. Additional details about the AVIRIS-NG instrument are available at https://doi.org/10.3334/ORNLDAAC/2095.
AVIRIS-NG instrument data were processed to Level 1 radiance using AVIRIS-NG calibration software, followed by atmospheric correction to Hemispherical Directional Reflectance Factor (HDRF) through the ISOFIT (https://github.com/isofit/isofit) surface and atmospheric modeling package, by NASA’s Jet Propulsion Laboratory. The L1 data were used to generate L2 reflectance and Level 3 derived products, such as these mosaics.
These L2 products were derived from L1B radiance products using Optimal Estimation adapted for imaging spectroscopy as outlined in Thompson et al. (2018) via ISOFIT v3.2.2 (Brodrick et al., 2024). The netCDF files list the wavelengths and full width half maximum (fwhm) values for each band.
The mosaics in this dataset were generated by stitching together separate scenes and resampling to 5-m resolution in the Hartebeesthoek94 projected coordinate system (WGS-84 datum, EPSG 9221). The mosaic files are distributed on a tiled grid system, and the tile name is included in the file name. Mosaics were generated by manually grouping sets of flight lines into different chunks that should be placed 'in front of' or 'behind' other chunks. The selection criteria included a combination of the weather during observations, flight conditions, flightbox design, and the time the flight was taken. As such, selections were inherently subjective. The goal, however, was to minimize the influence of bad conditions on the mosaic (those with partial or complete cloud cover), and keep the overall scene as continuous as possible (i.e., by keeping overlapping chunks closer together in time when possible). Within a particular chunk of lines, individual lines were mosaiced by nearest-neighbor resampling to a common, 5-m GSD grid, using the minimum phase angle (the direct angle between the sun, target, and sensor) as the sorting criteria.
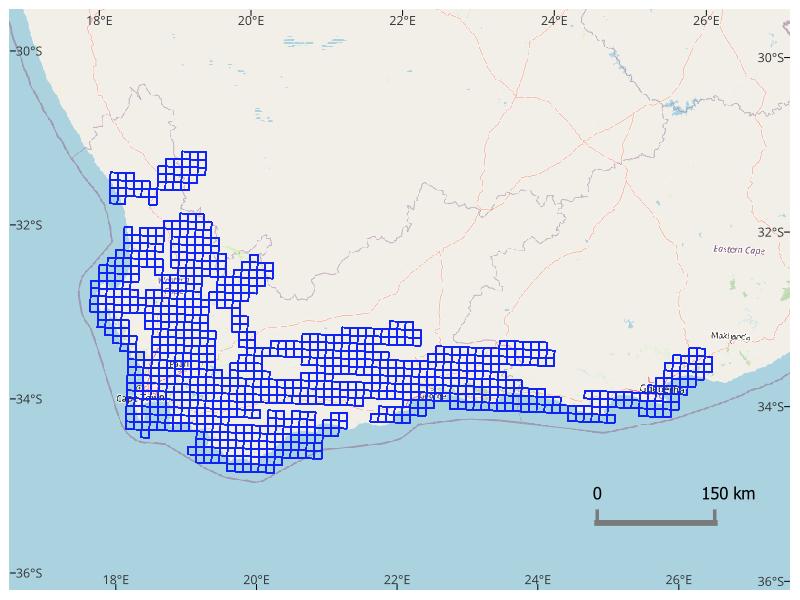
Figure 2. Distribution of L3 surface reflectance mosaics in South Africa’s Greater Cape Floristic Region (GCFR). Mosaic tile grid cells are shown as blue rectangles. Basemap: © OpenStreetMap contributors.
Data Access
These data are available through the Oak Ridge National Laboratory (ORNL) Distributed Active Archive Center (DAAC).
BioSCape: AVIRIS-NG L3 Resampled Reflectance Mosaics, V2
Contact for Data Center Access Information:
- E-mail: uso@daac.ornl.gov
- Telephone: +1 (865) 241-3952
References
Brodrick, P.G., D.R. Thompson, N. Bohn, N. Carmon, R. Eckert, J. Montgomery, K. Wurster, and N. Vaughn. 2024. isofit (v3.2.2). Zenodo. https://doi.org/10.5281/zenodo.14135462
Cardoso, A.W. and The BioSCape Consortium. 2025a. BioSCape combines local knowledge and remote-sensing technology for inclusive biodiversity science. Nature Reviews Biodiversity 1:2-4. https://doi.org/10.1038/s44358-024-00007-8
Cardoso, A., E. Hestir, J. Slingsby, C. Forbes, G. Moncrieff, W. Turner, A. Skowno, J. Nesslage, P. Brodrick, K. Gaddis, and A. Wilson. 2025b. The biodiversity survey of the Cape (BioSCape), integrating remote sensing with biodiversity science. npj Biodiversity 4:2. https://doi.org/10.1038/s44185-024-00071-5
Chapman, J.W., D.R. Thompson, M.C. Helmlinger, B.D. Bue, R.O. Green, M.L. Eastwood, S. Geier, W. Olson-Duvall, and S.R. Lundeen. 2019. Spectral and radiometric calibration of the Next Generation Airborne Visible Infrared Spectrometer (AVIRIS-NG). Remote Sensing 11: 2129. https://doi.org/10.3390/rs11182129
Green, R.O., P.G. Brodrick, J.W. Chapman, M. Eastwood, S. Geier, M. Helmlinger, S.R. Lundeen, W. Olson-Duvall, R. Pavlick, L.M. Rios, D.R. Thompson, and A.K. Thorpe. 2023. AVIRIS-NG L1B Calibrated Radiance, Facility Instrument Collection, V1. ORNL DAAC, Oak Ridge, Tennessee, USA. https://doi.org/10.3334/ORNLDAAC/2095
Green, R.O., P.G. Brodrick, J.W. Chapman, M. Eastwood, S. Geier, M. Helmlinger, S.R. Lundeen, W. Olson-Duvall, R. Pavlick, L.M. Rios, D.R. Thompson, and A.K. Thorpe. 2023. AVIRIS-NG L2 Surface Reflectance, Facility Instrument Collection, V1. ORNL DAAC, Oak Ridge, Tennessee, USA. https://doi.org/10.3334/ORNLDAAC/2110
Green, R.O., P.G. Brodrick, J.W. Chapman, M. Eastwood, S. Geier, M. Helmlinger, S.R. Lundeen, W. Olson-Duvall, R. Pavlick, L.M. Rios, D.R. Thompson, and A.K. Thorpe. 2023. AVIRIS Facility Instruments: Flight Line Geospatial Polygons and Contextual Data, V1. ORNL DAAC, Oak Ridge, Tennessee, USA. https://doi.org/10.3334/ORNLDAAC/2140
Thompson, D.R., B.C. Gao, R.O. Green, P.E. Dennison, D.A. Roberts, and S. Lundeen. 2015a. Atmospheric correction for global mapping spectroscopy: ATREM advances for the HyspIRI preparatory campaign. Remote Sensing of Environment 167:64- 77. https://doi.org/10.1016/j.rse.2015.02.010
Thompson, D.R., V. Natraj, R.O. Green, M.C. Helmlinger, B.-C. Gao, and M.L. Eastwood. 2018. Optimal estimation for imaging spectrometer atmospheric correction. Remote Sensing of Environment 216:355-373. https://doi.org/10.1016/j.rse.2018.07.003
Thompson, D.R., F.C. Seidel, B.C. Gao, M. Gierach, R.O. Green, R.M. Kudela, and P. Mouroulis. 2015b. Optimizing irradiance estimates for coastal and inland water imaging spectroscopy. Geophysical Research Letters 42:4116-4123. https://doi.org/10.1002/2015GL063287