Documentation Revision Date: 2024-11-01
Dataset Version: 1
Summary
This dataset holds 887,931 audio recordings in waveform audio file format (WAV) format, one compressed zip archive holding 5870 photographs in JPEG format, and one file in comma separated values (CSV) format.
Citation
Clark, M., L. Salas, R. Snyder, W. Schackwitz, D. Leland, and T. Erickson. 2024. Soundscapes to Landscapes Acoustic Recordings, Sonoma County, CA, 2017-2022. ORNL DAAC, Oak Ridge, Tennessee, USA. https://doi.org/10.3334/ORNLDAAC/2341
Table of Contents
- Dataset Overview
- Data Characteristics
- Application and Derivation
- Quality Assessment
- Data Acquisition, Materials, and Methods
- Data Access
- References
Dataset Overview
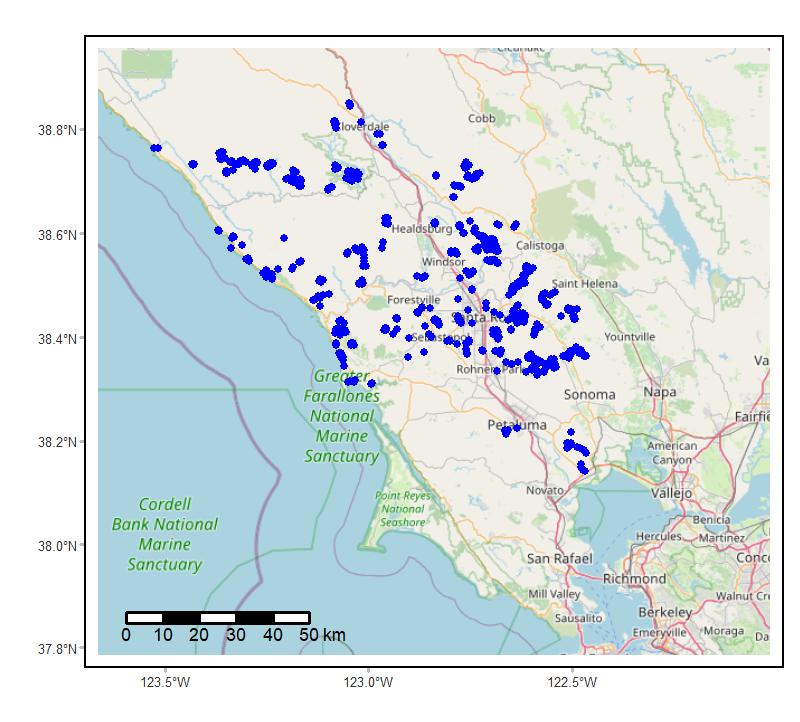
This dataset holds in situ sound recordings from sites in Sonoma County, California, USA as part of the Soundscapes to Landscapes citizen science project. Recordings were collected from 2017 to 2022 during the bird breeding season (mid-March thru mid-July). Sites (n=1399) were selected across the county; locations were stratified with respect to topographic position and broad land use/land cover types, such as forest, shrubland, herbaceous, urban, agriculture, and riparian areas. Two types of automated recorders were used: Android-based smartphones with attached microphones and AudioMoths. Recorders were deployed at sites for at least 3 days, and programmed to record 1 min of every 10, thus providing temporal sampling through day and night. Each recording was saved in a waveform audio file format (.wav) with 16-bit digitization depth and 44.1 kHz or 48 kHz sampling rate for smartphone and AudioMoth recorders, respectively. The dataset also includes site information including site location when so permitted by landowners in tabular form and photographs of field sites.
Related Publications:
Clark, M.L., L. Salas, S. Baligar, C.A. Quinn, R.L. Snyder, D. Leland, W. Schackwitz, S.J. Goetz, and S. Newsam. 2023. The effect of soundscape composition on bird vocalization classification in a citizen science biodiversity monitoring project. Ecological Informatics 75:102065. https://doi.org/10.1016/j.ecoinf.2023.102065
Quinn, C.A., P. Burns, G. Gill, S. Baligar, R.L. Snyder, L. Salas, S.J. Goetz, and M.L. Clark. 2022. Soundscape classification with convolutional neural networks reveals temporal and geographic patterns in ecoacoustic data. Ecological Indicators 138:108831. https://doi.org/10.1016/j.ecolind.2022.108831
Quinn, C.A., P. Burns, C.R. Hakkenberg, L. Salas, B. Pasch, S.J. Goetz, and M.L. Clark. 2023. Soundscape components inform acoustic index patterns and refine estimates of bird species richness. Frontiers in Remote Sensing 4:1156837. https://doi.org/10.3389/frsen.2023.1156837
Quinn, C.A., P. Burns, P. Jantz, L. Salas, S.J. Goetz, and M.L. Clark. 2024. Soundscape mapping: understanding regional spatial and temporal patterns of soundscapes incorporating remotely-sensed predictors and wildfire disturbance. Environmental Research: Ecology 3:025002. https://doi.org/10.1088/2752-664X/ad4bec
Snyder, R., M. Clark, L. Salas, W. Schackwitz, D. Leland, T.Stephens, T. Erickson, T. Tuffli, M. Tuffli, and K. Clas. 2022. The Soundscapes to Landscapes Project: development of a bioacoustics-based monitoring workflow with multiple citizen scientist contributions. Citizen Science: Theory and Practice 7:24. http://doi.org/10.5334/cstp.391
Acknowledgements:
This project was supported by NASA's Citizen Science for Earth Systems Program (grant NNX17AG59A).
The Soundscapes to Landscapes team acknowledges the many landowners and volunteers (citizen scientists) who graciously cooperated with this project and the following entities who contributed to field data collection by facilitating access to their properties, and in some cases, employing staff members to deploy and retrieve audio recorders: Pepperwood Foundation, Sonoma County Agricultural Preservation and Open Space District, Audubon Canyon Ranch, Sonoma Land Trust, California State Parks, Sonoma Regional Parks, Conservation Fund, The Wildlands Conservancy, and California Department of Fish and Wildlife.
Data Characteristics
Spatial Coverage: Sonoma County, California, USA
Spatial Resolution: Point - sounds within 50 m of audio recorder locations
Temporal Coverage: 2017-04-01 to 2022-07-11
Temporal Resolution: Recordings of 1-min duration taken every 10 min for 3-5 day periods..
Site Boundaries: Latitude and longitude are given in decimal degrees.
| Site | Westernmost Longitude | Easternmost Longitude | Northernmost Latitude | Southernmost Latitude |
|---|---|---|---|---|
| Sonoma County, California, US | -123.52782 | -122.46458 | 38.84987 | 38.14193 |
Data File Information
This dataset holds 887,931 audio recordings in waveform audio file format (.wav, .WAV) format, one compressed zip archive (.zip) holding 5870 photographs in JPEG format, and one file in comma separated values (.csv) format.
The file naming convention for the audio recordings is <device>_<begin_date>_<rec_time>.wav, where
- <device> = 8-character device number (e.g., s2llg010)
- <begin_date> = date when recordings began at site in YYMMDD
- <rec_time> = start date and time for 1-minute recording in YYYY-MM-DD_hh-mm
The combination of <device> and <begin_date> uniquely identifies each survey site, since each device can only be at one location on a specific date.
Example file name: s2llg010_210628_202107-01_10-50.wav (sampling with device s2llg010, which began on 2021-06-28 at location s2llg010_210628; this specific recording started at 10:50 am on 2021-07-01, on the fourth day of deployment at the site).
The file s2l_sites.csv holds information about each site (Table 1). Missing data are coded as "NA" or "-9999" for text and numeric fields, respectively
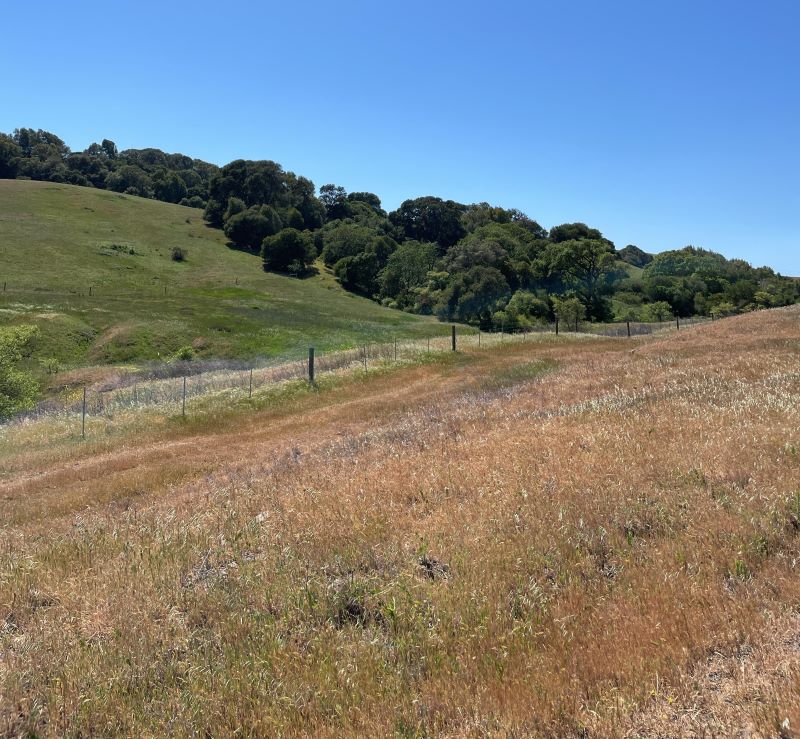
The compressed zip archive survey123_site_photos.zip holds 5870 photographs taken at study sites. Images include the mounted recorder, views from the recorder location toward the N,E,S,W cardinal directions, and upward views for sites with forest canopy.
Within the archive, the file naming convention for these photographs is <device>_<begin_date>_<photo>.jpg (e.g., s2llg010_190619_west.jpg), where
- <photo> = "mounted" (an image of the recorder) or the viewing direction "north", "east", "south", or "west".
Table 1. Variables in s2l_sites.csv.
| Variable | Units | Description |
|---|---|---|
| siteid | - | Unique code for each site that includes the eight-character device number and six-digit date code (YYMMDD) denoting date when sampling started: <device>_<begin_date>. For example, "s2lam001_180526". |
| year | YYYY | Year of audio recording. |
| date | YYYY-MM-DD | Date of first audio recording at site. |
| location_type | - | Means of obtaining site location: "DGPS" (differential GPS receiver), "Survey123" (software on mobile phone or tablet computer), or "Manual" (read from map). |
| easting | m | Easting coordinate in UTM zone 10N, WGS84 datum. |
| northing | m | Northing coordinate in UTM zone 10N, WGS84 datum. |
| sharelocaion | - | "Yes" = coordinates provided; "No" = coordinates not provided to respect the privacy of landowner. |
| recordertype | - | Audio recording device used: "AudioMoth" or "LG Smartphone". |
| protectivecover | - | Type of water protection for recording device: "Pencil bag" or "Ziplock". |
| file_count | 1 | Number of audio files for the site. |
Application and Derivation
Soundscapes to Landscapes (S2L) (Soundscapes to Landscapes 2022) was a distributed, citizen science-based acoustic monitoring project that uses cost-effective mobile and web-based technologies, autonomous recording units (ARUs), and bioacoustic analysis to monitor bird diversity and broad soundscape components of anthrophony (e.g., cars, airplanes), geophony (e.g., wind, rain), and biophony (e.g., birds, insects, mammals) at a countywide scale (Clark et al., 2023; Quinn et al., 2022; Quinn et al., 2023; Quinn et al., 2024; Snyder et al., 2022).
Passive acoustic monitoring of the environment can provide information on overall ecosystem status and change as well as on sound-producing wildlife, including birds, amphibians, insects and mammals (Balantic and Donovan, 2020; Gibb et al., 2019). Bioacoustic analysis allows automatic detection of bird presence with greater sampling in time and space than with traditional bird observations (Campos-Cerqueira and Aide, 2016; Furnas and Callas, 2015), removes the influence of human presence on animal vocalization during sampling, and reduces individual observer bias. Field surveys may be combined with remotely sensed data on land cover and habitat structure to study the distribution of species (e.g., Burns et al., 2020).
Quality Assessment
Invalid recordings were removed from this collection.
Data Acquisition, Materials, and Methods
From 2017 to 2021, the Soundscapes to Landscapes (S2L; https://soundscapes2landscapes.org/) project deployed automated recording units (ARU) annually in field campaigns spanning late March to early July, capturing most of the breeding season when birds vocalize for mating and for defending their territory. Engaging citizen scientists to sample bird diversity across a diverse landscape was a central goal of this project.
Site selection
A stratified random sampling design was used to identify locations for ARUs across Sonoma County, California, US. The strata were based on county-wide GIS data (terrain, streams, land cover), canopy chemistry (chlorophyll, nitrogen, lignin, water) metrics from Summer 2017 airborne hyperspectral imagery (Clark and Kilham, 2016), and forest structure metrics (LasTools, https://rapidlasso.com/lastools) applied to 2013 airborne lidar data.
The county was first stratified into upland and lowland zones using a digital elevation model. A county land-cover map (http://sonomavegmap.org/data-downloads/) was used to separate annual croplands, developed areas, grasslands, native forest, orchards, shrublands, vineyards, urban-wildland and other areas. Further, riparian corridors were delineated as 25-m from lidar-derived streams. Forests were further separated into six levels of chemical and structural variation based on principle component analysis applied to multi-seasonal hyperspectral and lidar metrics, respectively. Many of these random sample points fell in inaccessible terrain (e.g., in a ravine or atop a steep hill), therefore, when deploying ARUs, citizen scientists chose a subset of the random sample points on each property based on navigation feasibility. When no stratified sample points fell on the property (usually due to small property size), or when none of the sample points were accessible, citizen scientist used a set of defined criteria to select a site on the property: 1) away from the road and house, 2) >50 meters from any bird feeders on the property, 3) feasible to navigate to, and 4) use no a priori knowledge regarding bird activity.
Field teams used a free smartphone application to navigate to site locations and the ArcGIS Survey123 application to collect auxiliary site data, including location coordinates, date and time of deployment, property information, and photographs of the survey site. Two thirds of the sites were on private lands.
Precise locations for these recording data are only available for sites where landowners granted permission to share the location data. For these sites, locations were captured using the smartphone application Survey123 or with a Trimble Juno SB unit with differential corrections.
ARU equipment and deployment
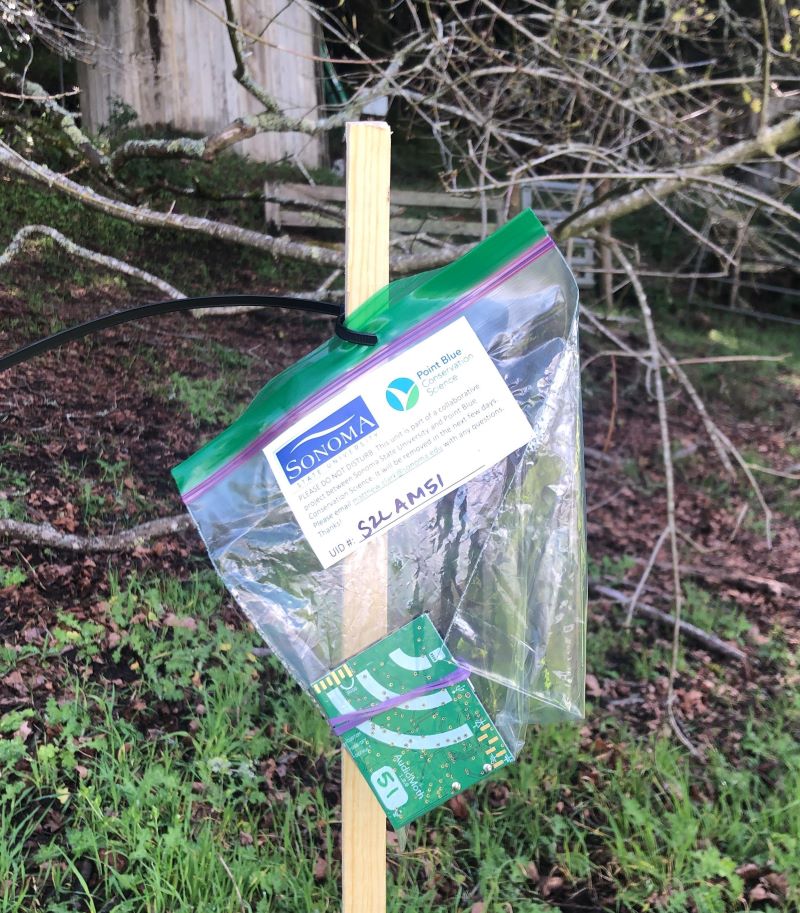
Two types of ARUs were used to collect sound recordings at sample sites. In 2017 and 2018, ten Android-based smartphones (US$300/unit) with attached microphones and waterproof cases were used. In 2019, the project transitioned to the AudioMoth device (Hill et al., 2019), which has been used in bird, amphibian, insect, and mammal research applications (Barber-Meyer et al., 2020; Clark et al., 2023; LeBien et al., 2020; Zhong et al., 2020). The AudioMoth cost about US$85 per unit with batteries and SD memory card, was easy to program, and had a simple data upload from the SD card. AudioMoths were deployed in plastic ziplock bags or vinyl pencil bags for protection from rain.

Figure 2.An AudioMoth automated recorder placed within a plastic ziplock bag.
The ARUs were programmed to sample 1 minute of every 10 minutes, thus providing temporal sampling through day and night. The project chose not to record continuously as this would require the project to archive and process large amounts of data, would incur higher data storage costs, and the project goal was to capture species at a site level, not every instance of vocalization. Further, recordings typically spanned 3 to 4 days, with the goal of capturing more spatial than temporal variation in a field season. Each 1-minute recording was saved in a waveform audio file format (.wav) with 16-bit digitization depth and 44.1 kHz or 48 kHz sampling rate for smartphone and AudioMoth recorders, respectively.

Figure 3. View looking west from site s2lam045. Source: s2lam049_210501_west.jpg
See Snyder et al. (2022) for additional information.
Data Access
These data are available through the Oak Ridge National Laboratory (ORNL) Distributed Active Archive Center (DAAC).
Soundscapes to Landscapes Acoustic Recordings, Sonoma County, CA, 2017-2022
Contact for Data Center Access Information:
- E-mail: uso@daac.ornl.gov
- Telephone: +1 (865) 241-3952
References
Balantic, C.M., and T.M. Donovan. 2019. Statistical learning mitigation of false positives from template-detected data in automated acoustic wildlife monitoring. Bioacoustics 29:296–321. https://doi.org/10.1080/09524622.2019.1605309
Barber-Meyer, S.M., V. Palacios, B. Marti-Domken, and L.J. Schmidt. 2020. Testing a new passive acoustic recording unit to monitor wolves. Wildlife Society Bulletin 44:590–598. https://doi.org/10.1002/wsb.1117
Burns, P., M. Clark, L. Salas, S. Hancock, D. Leland, P. Jantz, R. Dubayah, and S.J. Goetz. 2020. Incorporating canopy structure from simulated GEDI Lidar Into bird species distribution models. Environmental Research Letters 15:095002. https://doi.org/10.1088/1748-9326/ab80ee
Campos-Cerqueira, M., and T.M. Aide. 2016. Improving distribution data of threatened species by combining acoustic monitoring and occupancy modelling. Methods in Ecology and Evolution 7:1340–1348. https://doi.org/10.1111/2041-210X.12599
Clark, M.L., and N.E. Kilham. 2016. Mapping of land cover in northern California with simulated hyperspectral satellite imagery. ISPRS Journal of Photogrammetry and Remote Sensing 119:228–245. https://doi.org/10.1016/j.isprsjprs.2016.06.007
Clark, M.L., L. Salas, S. Baligar, C.A. Quinn, R.L. Snyder, D. Leland, W. Schackwitz, S.J. Goetz, and S. Newsamt. 2023. The effect of soundscape composition on bird vocalization classification in a citizen science biodiversity monitoring project. Ecological Informatics 75:102065. https://doi.org/10.1016/j.ecoinf.2023.102065
Furnas, B.J., and R.L. Callas. 2015. Using automated recorders and occupancy models to monitor common forest birds across a large geographic region. The Journal of Wildlife Management 79:325–337. https://doi.org/10.1002/jwmg.821
Gibb, R., E. Browning, P. Glover-Kapfer, and K.E. Jones. 2018. Emerging opportunities and challenges for passive acoustics in ecological assessment and monitoring. Methods in Ecology and Evolution 10:169–185. https://doi.org/10.1111/2041-210X.13101
Hill, A.P., P. Prince, J.L. Snaddon, C.P. Doncaster, and A. Rogers. 2019. Audiomoth: a low-cost acoustic device for monitoring biodiversity and the environment. Hardwarex 6:E00073. https://doi.org/10.1016/j.ohx.2019.E00073
Lebien, J., M. Zhong, M. Campos-Cerqueira, J.P. Velev, R. Dodhia, J.L. Ferres, and T.M. Aide. 2020. A pipeline for identification of bird and frog species in tropical soundscape recordings using a convolutional neural network. Ecological Informatics 59:101113. https://doi.org/10.1016/j.ecoinf.2020.101113
Quinn, C.A., P. Burns, G. Gill, S. Baligar, R.L. Snyder, L. Salas, S.J. Goetz, and M.L. Clark. 2022. Soundscape classification with convolutional neural networks reveals temporal and geographic patterns in ecoacoustic data. Ecological Indicators 138:108831. https://doi.org/10.1016/j.ecolind.2022.108831
Quinn, C.A., P. Burns, C.R. Hakkenberg, L. Salas, B. Pasch, S.J. Goetz, and M.L. Clark. 2023. Soundscape components inform acoustic index patterns and refine estimates of bird species richness. Frontiers in Remote Sensing 4:1156837. https://doi.org/10.3389/frsen.2023.1156837
Quinn, C.A., P. Burns, P. Jantz, L. Salas, S.J. Goetz, and M.L. Clark. 2024. Soundscape mapping: understanding regional spatial and temporal patterns of soundscapes incorporating remotely-sensed predictors and wildfire disturbance. Environmental Research: Ecology 3:025002. https://doi.org/10.1088/2752-664X/ad4bec
Snyder, R., M. Clark, L. Salas, W. Schackwitz, D. Leland, T.Stephens, T. Erickson, T. Tuffli, M. Tuffli, and K. Clas. 2022. The Soundscapes to Landscapes Project: development of a bioacoustics-based monitoring workflow with multiple citizen scientist contributions. Citizen Science: Theory and Practice 7:24. https://doi.org/10.5334/cstp.391
Zhong, M., J. Lebien, M. Campos-Cerqueira, R. Dodhia, J. Lavista Ferres, J.P. Velev, and T.M. Aide. 2020. Multispecies bioacoustic classification using transfer learning of deep convolutional neural networks with pseudo-labeling. Applied Acoustics 166:107375. https://doi.org/10.1016/j.apacoust.2020.107375
