Documentation Revision Date: 2025-05-31
Dataset Version: 1.0
Summary
The main objective of the AVIRIS project is to identify, measure, and monitor constituents of the Earth's surface and atmosphere based on molecular absorption and particle scattering signatures. Research with AVIRIS data is predominantly focused on understanding processes related to the global environment and climate change.
AVIRIS-C was developed in 1987 (Green et al., 1998). It is an optical sensor that delivers calibrated images of the upwelling spectral radiance in 224 contiguous spectral channels (bands) with wavelengths from 380 to 2500 nanometers, the complete VIS-NIR-SWIR spectrum. In 2009, AVIRIS-NG was developed to provide continued access to high signal-to-noise ratio imaging spectroscopy measurements in the solar reflected spectral range and has been operational since 2014. AVIRIS-NG measures the wavelength range from 380 nm to 2510 nm in 5 nm intervals. Spectra are measured as images with 600 cross-track elements with spatial resolution from 0.3 m to 4.0 m. AVIRIS-NG supports NASA Science and applications in many areas including plant composition and function, geology and soils, greenhouse gas mapping, and calibration of orbital platforms. Radiance data from both instruments may be converted to spectral reflectance.
NASA facility instruments operate out of a NASA research center and support multiple science disciplines, field investigations, and NASA science objectives. Facility instruments are supported by managers in the Earth Science Division (ESD) Research and Analysis Program, and/or the Earth Observation System (EOS) Project Science Office. The AVIRIS systems reside at the Jet Propulsion Laboratory (JPL), and the project operates under the Observational Systems Division of JPL. In addition, the AVIRIS project works to ensure that experiment requirements are met for each flight and that users are satisfied with data quality and the level of service provided.
Additional facility instrument data will be appended to this dataset as they become available.
This dataset includes a total of 37 files: two tables in comma-separated values (CSV) format, two shapefiles in compressed (.zip) format, two GeoJSON files (.geojson), and 31 files in compressed Keyhole Markup Language (.kmz).
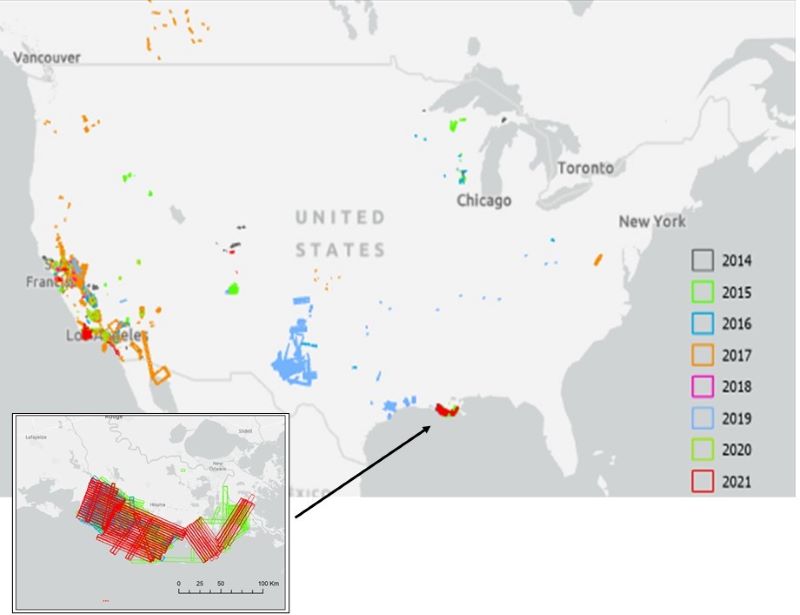
Figure 1. Location of AVIRIS-NG flight lines in the conterminous US for 2014 - 2021. Inset shows detail of flight lines in coastal Louisiana associated with the Delta-X project.
Citation
Green, R.O., P.G. Brodrick, J.W. Chapman, M. Eastwood, S. Geier, M. Helmlinger, S.R. Lundeen, W. Olson-Duvall, R. Pavlick, L.M. Rios, D.R. Thompson, and A.K. Thorpe. 2023. AVIRIS Facility Instruments: Flight Line Geospatial and Contextual Data. ORNL DAAC, Oak Ridge, Tennessee, USA. https://doi.org/10.3334/ORNLDAAC/2140
Table of Contents
- Dataset Overview
- Data Characteristics
- Application and Derivation
- Quality Assessment
- Data Acquisition, Materials, and Methods
- Data Access
- References
- Dataset Revisions
Dataset Overview
This dataset provides attributed geospatial and tabular information for identifying and querying flight lines of interest for the Airborne Visible InfraRed Imaging Spectrometer-Classic (AVIRIS-C) and Airborne Visible InfraRed Imaging Spectrometer-Next Generation (AVIRIS-NG) Facility Instrument collections. It includes attributed shapefile and GeoJSON files containing polygon representation of individual flights lines for all years and separate KMZ files for each year. These files allow users to visualize and query flight line locations using Geographic Information System (GIS) software. Tables of AVIRIS-C and AVIRIS-NG flight lines with attributed information include dates, bounding coordinates, site names, investigators involved, flight attributes, associated campaigns, and corresponding file names for associated L1B (radiance) and L2 (reflectance) files in the AVIRIS-C and AVIRIS-NG Facility Instrument Collections. Tabular information is also provided in comma-separated values (CSV) format.
Project: AVIRIS
The Airborne Visible InfraRed Imaging Spectrometer-Classic (AVIRIS-C) and -Next Generation (AVIRIS-NG) are two Facility Instruments (FIs) that are part of NASA’s Airborne Science Program (ASP) and the Jet Propulsion Laboratory’s (JPL) Earth Science Airborne Program. The AVIRIS-C is an imaging spectrometer that delivers calibrated images of the upwelling spectral radiance in 224 contiguous spectral channels with wavelengths from 400 to 2500 nanometers (nm). The AVIRIS-NG is the successor to AVIRIS-Classic and provides high signal-to-noise ratio imaging spectroscopy measurements in 425 contiguous spectral channels with wavelengths in the solar reflected spectral range (380-2510 nm). The AVIRIS-NG started operation in 2014 and is expected to replace the AVIRIS-C instrument. Data from AVIRIS-C and AVIRIS-NG have been applied to a wide range of studies in the fields of terrestrial and coastal aquatic plant physiology, atmospheric and aerosol studies, environmental science, snow hydrology, geology, volcanology, oceanography, soil and land management, agriculture, and limnology.
Related Datasets:
Green, R.O., P.G. Brodrick, J.W. Chapman, M. Eastwood, S. Geier, M. Helmlinger, S.R. Lundeen, W. Olson-Duvall, R. Pavlick, L.M. Rios, D.R. Thompson, and A.K. Thorpe. 2023. AVIRIS-NG L2 Surface Reflectance, Facility Instrument Collection, V1. ORNL DAAC, Oak Ridge, Tennessee, USA.. https://doi.org/10.3334/ORNLDAAC/2110
Green, R.O., P.G. Brodrick, J.W. Chapman, M. Eastwood, S. Geier, M. Helmlinger, S.R. Lundeen, W. Olson-Duvall, R. Pavlick, L.M. Rios, D.R. Thompson, and A.K. Thorpe. 2023. AVIRIS-NG L1B Calibrated Radiance, Facility Instrument Collection, V1. ORNL DAAC, Oak Ridge, Tennessee, USA. https://doi.org/10.3334/ORNLDAAC/2095
Green, R.O., D.R. Thompson, J.W. Boardman, J.W. Chapman, M. Eastwood, M. Helmlinger, S.R. Lundeen, and W. Olson-Duvall. 2023. AVIRIS-Classic: L1B Calibrated Radiance, Facility Instrument Collection, V1. ORNL DAAC, Oak Ridge, Tennessee, USA. https://doi.org/10.3334/ORNLDAAC/2155
Green, R.O., D.R. Thompson, J.W. Boardman, J.W. Chapman, M. Eastwood, M. Helmlinger, S.R. Lundeen, and W. Olson-Duvall. 2023. AVIRIS-Classic: L2 Calibrated Reflectance, Facility Instrument Collection. ORNL DAAC, Oak Ridge, Tennessee, USA. https://doi.org/10.3334/ORNLDAAC/2154
Data Characteristics
Spatial Coverage: North America, Europe, southern Asia, and southern Africa
Spatial Resolution: 5 to 20 m
Temporal Coverage: 2004-05-02 to 2024-08-16
Temporal Resolution: One-time estimate, start and stop of each flight line to the nearest minute.
Study Areas: All latitudes and longitudes given in decimal degrees.
| Site | Westernmost Longitude | Easternmost Longitude | Northernmost Latitude | Southernmost Latitude |
|---|---|---|---|---|
| North America, Europe, southern Asia, and southern Africa | -171.840 | 121.920 | 86.800 | -65.810 |
Data File Information
This dataset includes a total of 37 files: two tables in comma-separated values (CSV) format, two shapefiles in compressed (.zip) format, two GeoJSON files (.geojson), and 31 files in compressed Keyhole Markup Language (.kmz).
AVIRIS-C_flight_table.csv and AVIRIS-NG_flight_table.csv hold information for each flight line in tabular form (Table 1).
AVIRIS-C_flights_shapefile.zip and AVIRIS-NG_flights_shapefile.zip hold a shapefile of imagery footprints for each flight line.
AVIRIS-C_flights.geojson and AVIRIS-NG_flights.geojson hold polygons of imagery footprints for each flight line in GeoJSON format.
AVIRIS-C_YYYY.kmz and AVIRIS-NG_YYYY.kmz contain imagery footprints, one for each year (YYYY) 2006 to 2024, in compressed Keyhole Markup Language. There are 20 KMZ files for AVIRIS-C (2004, 2006 to 2024) and 11 KMZ files for AVIRIS-NG (2014 to 2024).
Table 1. Variables in the tabular CSV files, shapefiles, and KMZ maps.
| Variable name in | Units | Description | |
|---|---|---|---|
| CSV | shapefile, GeoJSON, and KMZ's | ||
| year | year | YYYY | Year of flight |
| date | date | YYYY-MM-DD | Date of flight |
| flight_ID | flt_ID | - | Flight identifier in the format of "angYYYYMMDDt" |
| flight_line | flt_line | - | Unique identifier of each flight line that includes the flight_ID + run_ID |
| site_info | site_info | - | Site information derived from AVIRIS-C/AVIRIS-NG flight log or comments |
| run_ID | run_ID | - | Portion of the flight_line ID that includes the starting time in hour, minutes and seconds (hhmmss) |
| site_name | site_name | - | Site information derived from AVIRIS-C/AVIRIS-NG flight log or comments |
| NASA_Log | nasa_log | - | NASA flight log identifier |
| investigator | investgtr | - | Investigator names from AVIRIS-C/AVIRIS-NG flight log |
| start_lat | start_lat | degrees_north | Starting latitude of flight line of aircraft from AVIRIS-C/AVIRIS-NG flight log |
| start_lon | start_lon | degrees_east | Starting longitude of flight line of aircraft from AVIRIS-C/AVIRIS-NG flight log |
| stop_lat | stop_lat | degrees_north | Ending latitude of flight line of aircraft from AVIRIS-C/AVIRIS-NG flight log |
| stop_lon | stop_lon | degrees_east | Ending longitude of flight line of aircraft from AVIRIS-C/AVIRIS-NG flight log |
| start_GMT | start_gmt | hhmm | Starting time of flight line of aircraft from AVIRIS-C/AVIRIS-NG flight log in hours (hh) and minutes (mm) GMT |
| stop_GMT | stop_gmt | hhmm | Ending time of flight line of aircraft from AVIRIS-C/AVIRIS-NG flight log GMT |
| comments | comments | - | Comment text from AVIRIS-C/AVIRIS-NG flight log |
| campaign | campaign | - | Name of campaign from AVIRIS-C/AVIRIS-NG historical flight information |
| campaign_info | camp_info | - | Additional information related to campaign or deployment from AVIRIS-C/AVIRIS-NG flight log |
| state | state | - | Name of U.S. state derived by overlaying bounding polygon on map of US states |
| country | country | - | Name of country derived by overlaying bounding polygon on map of world countries. Blank if over open ocean |
| platform | platform | - | The airborne platform, e.g., "King Air B200" |
| instrument | instrument | - | "AVIRIS-Classic" or "AVIRIS-NG" |
| scene_elevation | scene_elev | m | On-ground elevation of imagery provided by JPL |
| altitude | altitude | m | Aircraft altitude from AVIRIS-C/AVIRIS-NG flight log; converted from kft (1000 feet) |
| speed_on_ground | speed_grnd | m s-1 | Ground speed of aircraft obtained from AVIRIS-C/AVIRIS-NG flight log; converted from knots |
| direction | direction | degrees | Aircraft heading from AVIRIS-C/AVIRIS-NG flight log as "Direction" or "MCRS" |
| weather_condition | weather | - | Comments on weather conditions during flight |
| gp_lon1 | - | degree_east | Longitude coordinates for points of bounding rectangle provided in spreadsheet from the AVIRIS-C/AVIRIS-NG Data Portals |
| gp_lon2 | - | ||
| gp_lon3 | - | ||
| gp_lon4 | - | ||
| gp_lat1 | - | degree_north | Latitude coordinates for points of bounding rectangle provided in spreadsheet from the AVIRIS-C/AVIRIS-NG Data Portals |
| gp_lat2 | - | ||
| gp_lat3 | - | ||
| gp_lat4 | - | ||
| radiance | radiance | - | Name of L1B radiance ENVI file in DAAC archive; blank if no file available |
| refl_rfl | refl_rfl | - | Name of L2 reflectance ENVI file with 425 bands in DAAC archive. Blank if no file available |
| refl_corr | refl_corr | - | Name of L2 corrected reflectance ENVI file with 425 bands in DAAC archive. Water absorption bands have been removed and a slight smoothing was applied to the spectra. Blank if no file available |
| h2o_absorp | h2o_absorp | - | Name of L2 water absorption ENVI file with 3 bands in DAAC archive. Column water vapor and optical absorption paths for liquid water and ice for flight line. Blank if no file available |
| quicklook | quicklook | - | Name of L1B quicklook JPEG file in DAAC archive; blank if no file available |
| rad_bin_lnk | rad_bin | - | URLs for downloading* L1B radiance file from DAAC archive. There are separate links for the ENVI binary file and the ENVI header; blank if no file available. |
| rad_hdr_lnk | rad_hdr | - | |
| refrfl_bin_lnk | refrfl_bin | - | URLs for downloading* L2 reflectance file from DAAC archive. There are separate links for the ENVI binary file and the ENVI header; blank if no file available |
| refrfl_hdr_lnk | refrfl_hdr | - | |
| refcor_bin_lnk | refcor_bin | - | URLs for downloading* L2 corrected reflectance file from DAAC archive. There are separate links for the ENVI binary file and the ENVI header; blank if no file available |
| refcor_hdr_lnk | refcor_hdr | - | |
| quicklook_lnk | quiklk_lnk | - | URL for downloading* L1B quicklook JPEG file from DAAC archive |
*Note: URLs for downloading. Copying the URL into a web browser will initiate an automatic download of data. An Earthdata Login account is required (https://urs.earthdata.nasa.gov/users/new).
All geographic coordinates use the WGS 1984 datum: EPSG, 4326.
The no-data value for numeric fields is -999 and "NA" for text fields.
User Note: In tabular data for AVIRIS-Classic flights (AVIRIS-C), multiple file names, separated by a semicolon, may be listed in the radiance, refl_rfl, and refl_corr fields. These files are associated with different software versions or adjustments to the flight scene data. When multiple files are available, only one download URL is provided, which points to the file with the latest software version or scene. All files listed are available from the DAAC archive, even if a download URL is not listed in these tables.
An active Earthdata login session is required to download files using these URLs. New users may register for an Earthdata login account at http://urs.earthdata.nasa.gov/.
Application and Derivation
The main objective of the AVIRIS project is to identify, measure, and monitor constituents of the Earth's surface and atmosphere based on molecular absorption and particle scattering signatures. Research with AVIRIS data is predominantly focused on understanding processes related to the global environment and climate change.
The AVIRIS sensors collect data that can be used for characterization of the Earth's surface and atmosphere from geometrically coherent spectroradiometric measurements. This data can be applied to studies in the fields of oceanography, environmental science, snow hydrology, geology, volcanology, soil and land management, atmospheric and aerosol studies, agriculture, and limnology (Green et al., 1998). Applications under development include the assessment and monitoring of environmental hazards such as toxic waste, oil spills, and land/air/water pollution. With proper calibration and correction for atmospheric effects, the measurements can be converted to ground reflectance data which can then be used for quantitative characterization of surface features.
The NASA AVIRIS-C facility instrument has been in operation since 1987 (Green et al., 1998). It is an optical sensor that delivers calibrated images of the upwelling spectral radiance in 224 contiguous spectral channels (bands) with wavelengths from 380 to 2500 nanometers, the complete VIS-NIR-SWIR spectrum. AVIRIS-C is a whisk broom sensor that produces 677 pixels on each scan. AVIRIS-C is used by a range of terrestrial ecology science investigations related to: (1) pattern and spatial distribution of ecosystems and their components, (2) ecosystem function, physiology and seasonal activity, (3) biogeochemical cycles, (3) changes in disturbance activity, and (4) ecosystems and human health. This instrument has been useful in developing techniques for atmospheric corrections needed to estimate surface reflectance using hyperspectral data (Thompson et al., 2015a; Thompson et al., 2016).
Beginning in 2009, a new NASA Earth Science airborne sensor called AVIRIS-NG was developed by JPL through the funding support from the American Recovery and Reinvestment Act (ARRA). Technical and programmatic oversight of the AVIRIS-NG development was provided by NASA’s Earth Science Technology Office (ESTO). AVIRIS-NG was developed to provide continued access to high signal-to-noise ratio imaging spectroscopy measurements in the solar reflected spectral range. AVIRIS-NG measures the wavelength range from 380 nm to 2510 nm in 5 nm intervals. Spectra are measured as images with 600 cross-track elements with spatial resolution from 0.3 m to 4.0 m.
AVIRIS-NG supports NASA Science and applications in many areas including plant composition and function, geology and soils, greenhouse gas mapping, and calibration of orbital platforms. AVIRIS-NG has been used to develop algorithms to accurately measure surface reflectances in coastal areas where the mixture of water and terrestrial surfaces, sun glint, atmospheric aerosols are challenging (Thompson et al., 2015b; Thompson et al. 2019). AVIRIS-NG has been calibrated and deployed with a new high-rate data-capture system and a new real-time cloud-screening algorithm (Thompson et al., 2014) to support a methane-release experiment at the Department of Energy’s Rocky Mountain Oil Field Test Center. This instrument’s capability to detect and measure methane point sources (Thorpe et al., 2013a, 2013b) is of interest for both greenhouse gas research and natural resource exploration, and the on-board cloud-screening algorithm is applicable for space imaging spectrometer missions.
The pixel size and swath width of AVIRIS data depend on the altitude from which the data is collected. When collected by the NASA ER-2 aircraft (20 km above the ground) each pixel produced by AVIRIS-C covers an area approximately 20 m in diameter on the ground (with some overlap between pixels), thus yielding a ground swath about 11 km wide. When collected by the Twin Otter aircraft (4 km above the ground), each ground pixel is 4 m2, and the swath is 2 km wide. The ground data are recorded on board the instrument along with navigation and engineering data and the readings from the AVIRIS on-board calibrator.
Quality Assessment
When possible, flight dates, times, and bound coordinates were validated with data in acquired L1B files (Green et al., 2023a; Green et al., 2023c).
Data Acquisition, Materials, and Methods
Flight line information was derived from L1B data files (Green et al., 2023a; Green et al., 2023c), spreadsheets of flight information available from the AVIRIS-C Data Products Portal (https://aviris.jpl.nasa.gov/dataportal/) and the AVIRIS-NG Data Products Portal (https://avirisng.jpl.nasa.gov/dataportal/), and logs of completed flights: AVIRIS-C Flight Logs (1998 to 2021, https://aviris.jpl.nasa.gov/status/flight_logs.html) and AVIRIS-NG Flight Logs (2014 to 2021, https://avirisng.jpl.nasa.gov/flight_logs.html).
Fields on flight altitude, speed_on_ground, direction, and weather were parsed from comment text included with the flight logs.
The country and state fields were determined by overlaying the bounding rectangle over a map of world countries (https://data.worldbank.org/) and U.S. states (https://www.census.gov/geographies/mapping-files/time-series/geo/tiger-line-file.html), respectively. If the country field is empty, the bounding rectangle was entirely over open ocean.
Identifying flight lines and obtaining related data from Earthdata Search
This dataset provides geospatial and tabular information for visualizing, identifying and querying flight lines of interest for the Airborne Visible InfraRed Imaging Spectrometer-Classic (AVIRIS-C) and Airborne Visible InfraRed Imaging Spectrometer-Next Generation (AVIRIS-NG) Facility Instrument collections. Geographic Information System (GIS) software may be used with the shapefiles, KMZs, or GeoJSON files to visualize the spatial distribution of flight line polygons for a given location of interest. Tabular attribute data associated with these polygons may be queried to narrow the selected flights by date and other attributes listed in Table 1. Once a candidate flight polygon has been selected, the flight_line (or flt_line) field holds a unique identifier for the flight (e.g., "ang20220223t203826" for an AVIRIS-NG flight).
The AVIRIS Facility Instrument datasets organize the granules by instrument and data level (Table 2).
Table 2. AVIRIS Facility instrument datasets.
| Instrument | Data level | Collection keyword |
|---|---|---|
| AVIRIS-Classic | L1B radiance | AVIRIS-Classic_L1B_Radiance |
| L2 reflectance | AVIRIS-Classic_L2_Reflectance | |
| AVIRIS-Next Generation | L1B radiance | AVIRIS-NG_L1B_radiance |
| L2 reflectance | AVIRIS-NG_L2_Reflectance |
The flight_line (flt_line) identifier may be used to search for related granules in Earthdata Search (https://search.earthdata.nasa.gov/search). First, enter the collection keyword from Table 2 in the keyword search box ("Search for collections or topics") in top left corner of the interface. The search results will show the matching collection; click on that collection in the Results panel. The interface will change to show a "Filter Granules" panel on the left side. Enter the flight line identifier text in the Granule IDs box surrounded by asterisks. For example, enter "*ang20220223t203826*" (without quotation marks) to search for granules associated with flight line ang20220223t203826. Associated granules will appear the Search Results with options to view detailed metadata, download the files, or access them in Amazon Web Services (AWS).
Note: An active Earthdata login session is required to download files from the search results and from the download URLs in tables included with this dataset. New users may register for an Earthdata login account at http://urs.earthdata.nasa.gov/.
Data Access
These data are available through the Oak Ridge National Laboratory (ORNL) Distributed Active Archive Center (DAAC).
AVIRIS Facility Instruments: Flight Line Geospatial and Contextual Data
Contact for Data Center Access Information:
- E-mail: uso@daac.ornl.gov
- Telephone: +1 (865) 241-3952
References
Green, R.O., P.G. Brodrick, J.W. Chapman, M. Eastwood, S. Geier, M. Helmlinger, S.R. Lundeen, W. Olson-Duvall, R. Pavlick, L.M. Rios, D.R. Thompson, and A.K. Thorpe. 2023a. AVIRIS-NG L2 Surface Reflectance, Facility Instrument Collection, V1. ORNL DAAC, Oak Ridge, Tennessee, USA. https://doi.org/10.3334/ORNLDAAC/2110
Green, R.O., P.G. Brodrick, J.W. Chapman, M. Eastwood, S. Geier, M. Helmlinger, S.R. Lundeen, W. Olson-Duvall, R. Pavlick, L.M. Rios, D.R. Thompson, and A.K. Thorpe. 2023b. AVIRIS-NG L1B Calibrated Radiance, Facility Instrument Collection, V1. ORNL DAAC, Oak Ridge, Tennessee, USA. https://doi.org/10.3334/ORNLDAAC/2095
Green, R.O., M.L. Eastwood, C.M. Sarture, T.G. Chrien, M. Aronsson, B.J. Chippendale, J.A. Faust, B.E. Pavri, C. J. Chovit, M. Solis, M.R. Olah, and O. Williams. 1998. Imaging Spectroscopy and the Airborne Visible/Infrared Imaging Spectrometer (AVIRIS). Remote Sensing of Environment 65:227-248. https://doi.org/10.1016/S0034-4257(98)00064-9
Green, R.O., D.R. Thompson, J.W. Boardman, J.W. Chapman, M. Eastwood, M. Helmlinger, S.R. Lundeen, and W. Olson-Duvall. 2023c. AVIRIS-Classic: L1B Calibrated Radiance, Facility Instrument Collection, V1. ORNL DAAC, Oak Ridge, Tennessee, USA. https://doi.org/10.3334/ORNLDAAC/2155
Green, R.O., D.R. Thompson, J.W. Boardman, J.W. Chapman, M. Eastwood, M. Helmlinger, S.R. Lundeen, and W. Olson-Duvall. 2023d. AVIRIS-Classic: L2 Calibrated Reflectance, Facility Instrument Collection. ORNL DAAC, Oak Ridge, Tennessee, USA. https://doi.org/10.3334/ORNLDAAC/2154
Thompson, D.R., K. Cawse-Nicholson, Z. Erickson, C.G. Fichot, C. Frankenberg, B.-C. Gao, M.M. Gierach, R.O. Green, D. Jensen, V. Natraj, and A. Thompson. 2019. A unified approach to estimate land and water reflectances with uncertainties for coastal imaging spectroscopy. Remote Sensing of Environment 231:111198. https://doi.org/10.1016/j.rse.2019.05.017
Thompson, D.R., D.A. Roberts, B.C. Gao, R. O. Green, L. Guild, K. Hayashi, R. Kudela, and S. Palacios. 2016. Atmospheric correction with the Bayesian empirical line. Optics Express 24: 2134-2144. https://doi.org/10.1364/OE.24.002134
Thompson, D.R., B.C. Gao, R.O. Green, P.E. Dennison, D.A. Roberts, and S. Lundeen. 2015a. Atmospheric correction for global mapping spectroscopy: ATREM advances for the HyspIRI preparatory campaign. Remote Sensing of Environment 167:64-77. https://doi.org/10.1016/j.rse.2015.02.010
Thompson, D.R., F.C. Seidel, B.C. Gao, M. Gierach, R.O. Green, R.M. Kudela, and P. Mouroulis. 2015b. Optimizing irradiance estimates for coastal and inland water imaging spectroscopy. Geophysical Research Letters 42:4116-4123. https://doi.org/10.1002/2015GL063287
Thompson, D.R., R.O. Green, D. Keymeulen, S. Lundeen, Y. Mouradi, R. Castano, S.A. Chien. 2014. Rapid spectral cloud screening onboard aircraft and spacecraft. IEEE Transactions on Geoscience and Remote Sensing 52:6779-6792. https://doi.org/10.1109/TGRS.2014.2302587
Thorpe, A.K., C. Frankenberg, and D.A. Roberts. 2013a. Retrieval techniques for airborne imaging of methane concentrations using high spatial and moderate spectral resolution: application to AVIRIS. Atmospheric Measurement Techniques: Discussions 6:8543-8588. https://doi.org/10.5194/amtd-6-8543-2013
Thorpe, A.K., D.A. Roberts, E.S. Bradley, C.C. Funk, P.E. Dennison, and I. Leifer. 2013b. High resolution mapping of methane emissions from marine and terrestrial sources using a Cluster-Tuned Matched Filter technique and imaging spectrometry. Remote Sensing of Environment 134:305-318. https://doi.org/10.1016/j.rse.2013.03.018
Dataset Revisions
| Version | Release Date | Revision Notes |
|---|---|---|
| 1.0 | 2025-05-31 | Added information for AVIRIS-C flights for 2004, 2023, and 2024 and AVIRIS-NG flights for 2018, 2019, 2021 to 2024. Shapefiles and GeoJSONs were updated to include footprints for these years. |
| 1.0 | 2024-02-01 | Added information for 2022 AVIRIS-NG flight lines, included download links in data tables, provided GeoJSON version of spatial polygons. Updated documentation. Also corrected file names for AVIRIS-NG quicklooks in AVIRIS-NG_flight_table.csv |
| 1.0 | 2023-06-15 | AVIRIS-Classic flight files added to dataset; documentation updated |
| 1.0 | 2023-04-18 | First publication, AVIRIS-NG flight information only |