Documentation Revision Date: 2023-09-21
Dataset Version: 1
Summary
NASA facility instruments operate out of a NASA research center and support multiple science disciplines, field investigations, and NASA science objectives. Facility instruments are supported by managers in the Earth Science Division (ESD) Research and Analysis Program, and/or the Earth Observation System (EOS) Project Science Office. The AVIRIS-NG system resides at the JPL. The AVIRIS-NG project operates under the Observational Systems Division of the Jet Propulsion Laboratory. In addition to operating and maintaining the sensor, the AVIRIS-NG project works to ensure that experiment requirements are met for each flight and that users are satisfied with data quality and the level of service provided.
This dataset will include all L2 files from the AVIRIS-NG facility instrument. See tables below for descriptions of data products and the number of files per year.
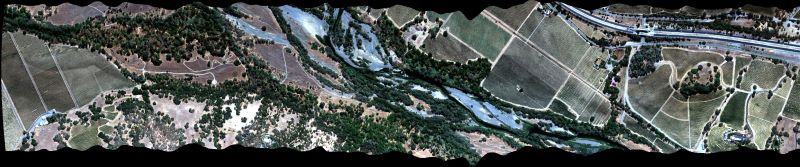
Figure 1. Portion of quick look image for flight ang20200907t214229 on 07 September 2020 over the Russian River in Sonoma County south of Cloverdale, California (approximately 38.7392 lat, -122.9387 lon).
Citation
Green, R.O., P.G. Brodrick, J.W. Chapman, M. Eastwood, S. Geier, M. Helmlinger, S.R. Lundeen, W. Olson-Duvall, R. Pavlick, L.M. Rios, D.R. Thompson, and A.K. Thorpe. 2023. AVIRIS-NG L2 Surface Reflectance, Facility Instrument Collection, V1. ORNL DAAC, Oak Ridge, Tennessee, USA. https://doi.org/10.3334/ORNLDAAC/2110
Table of Contents
- Dataset Overview
- Data Characteristics
- Application and Derivation
- Quality Assessment
- Data Acquisition, Materials, and Methods
- Data Access
- References
- Dataset Revisions
Dataset Overview
This dataset contains Level 2 (L2) orthocorrected reflectance from the Airborne Visible / Infrared Imaging Spectrometer-Next Generation (AVIRIS-NG) instrument. This is the NASA Earth Observing System Data and Information System (EOSDIS) facility instrument archive of these data. The AVIRIS-NG is a pushbroom spectral mapping system with high signal-to-noise ratio (SNR), designed and toleranced for high performance spectroscopy. AVIRIS-NG measures reflected radiance at 5-nm intervals in the Visible to Shortwave Infrared (VSWIR) spectral range from 380-2510 nm. The AVIRIS-NG sensor has a 1 milliradian instantaneous field of view, providing altitude dependent ground sampling distances from 20 m to sub-meter range. For each flight line, two types of L2 data files may be included: (a) calibrated surface reflectance and (b) water vapor and optical absorption paths for liquid water and ice. The L2 data are provided in ENVI format, which includes a flat binary file accompanied by a header (.hdr) file holding metadata in text format. The AVIRIS-NG is flown on a variety of aircraft platforms including the Twin Otter, the King Air B-200, and NASA's high altitude ER-2. This archive currently includes data from 2014 - 2022. Additional AVIRIS-NG facility instrument L2 data will be added as they become available. The AVIRIS-NG supports NASA Science and applications in many areas including plant composition and function, geology and soils, greenhouse gas mapping, and calibration of orbital platforms.
NASA facility instruments operate out of a NASA research center and support multiple science disciplines, field investigations, and NASA science objectives. Facility instruments are supported by managers in the Earth Science Division (ESD) Research and Analysis Program, and/or the Earth Observation System (EOS) Project Science Office. The AVIRIS-NG system resides at the JPL. The AVIRIS-NG project operates under the Observational Systems Division of the Jet Propulsion Laboratory. In addition to operating and maintaining the sensor, the AVIRIS-NG project works to ensure that experiment requirements are met for each flight and that users are satisfied with data quality and the level of service provided.
This dataset will include all L2 files from the AVIRIS-NG facility instrument.
The table below lists the number of flight lines with L2 data and the campaigns, projects, or locations in which the AVIRIS-NG- instrument was used in each year since 2014
| Year | Flight Lines with L2 data | Campaigns/Projects |
|---|---|---|
| 2014 | 34 | Airborne Science Objectives |
| 2015 | 68 | International Crops Research Institute for the Semi-arid Tropics (ICRISAT), India |
| 2016 | 245 | California Methane Survey; India |
| 2017 | 478 | Arctic-Boreal Vulnerability Experiment (ABoVE); California Methane Survey; Fall Methane Survey (U.S.) |
| 2018 | 836 | ABoVE, India, Europe, California Methane Survey, Fall Methane Survey |
| 2019 | 744 | ABoVE; Greenland; Fall Methane Survey; Student Airborne Research Program (SARP); Mother Lode Mine; Four Corners Mines |
| 2020 | 35 | California COVID-era Methane; SARP; California Virus and Smoke Impact on Wine Grapes |
| 2021 | 192 | Delta-X |
| 2022 | 667 | ABoVE; SHIFT; SARP; Methane (California, Canada) |
Project: AVIRIS
The Airborne Visible InfraRed Imaging Spectrometer - Classic (AVIRIS-C) and Next Generation (AVIRIS-NG) are two Facility Instruments (FIs) that are part of NASA’s Airborne Science Program (ASP) and the Jet Propulsion Laboratory’s (JPL) Earth Science Airborne Program. The AVIRIS-C is an imaging spectrometer that delivers calibrated images of the upwelling spectral radiance in 224 contiguous spectral channels with wavelengths from 400 to 2500 nanometers (nm). The AVIRIS-NG is the successor to AVIRIS-Classic and provides high signal-to-noise ratio imaging spectroscopy measurements in 425 contiguous spectral channels with wavelengths in the solar reflected spectral range (380-2510 nm). The AVIRIS-NG started operation in 2014 and is expected to replace the AVIRIS-C instrument. Data from AVIRIS-C and AVIRIS-NG have been applied to a wide range of studies in the fields of terrestrial and coastal aquatic plant physiology, atmospheric and aerosol studies, environmental science, snow hydrology, geology, volcanology, oceanography, soil and land management, agriculture, and limnology.
Related Publications
Chapman, J.W., D.R. Thompson, M.C. Helmlinger, B.D. Bue, R.O. Green, M.L. Eastwood, S. Geier, W. Olson-Duvall, and S.R. Lundeen. 2019. Spectral and radiometric calibration of the Next Generation Airborne Visible Infrared Spectrometer (AVIRIS-NG). Remote Sensing 11: 2129. https://doi.org/10.3390/rs11182129
Related Datasets:
Green, R.O., P.G. Brodrick, J.W. Chapman, M. Eastwood, S. Geier, M. Helmlinger, S.R. Lundeen, W. Olson-Duvall, R. Pavlick, L.M. Rios, D.R. Thompson, and A.K. Thorpe. 2023. AVIRIS-NG L1B Calibrated Radiance, Facility Instrument Collection, V1. ORNL DAAC, Oak Ridge, Tennessee, USA. https://doi.org/10.3334/ORNLDAAC/2095
- These L1B data files were used to generate the L2 files provided in this dataset.
Green, R.O., P.G. Brodrick, J.W. Chapman, M. Eastwood, S. Geier, M. Helmlinger, S.R. Lundeen, W. Olson-Duvall, R. Pavlick, L.M. Rios, D.R. Thompson, and A.K. Thorpe. 2023. AVIRIS Facility Instruments: Flight Line Geospatial Polygons and Contextual Data, V1. ORNL DAAC, Oak Ridge, Tennessee, USA. https://doi.org/10.3334/ORNLDAAC/2140
- Flight line ancillary information in tabular and attributed polygon vector files
Data Characteristics
Spatiotemporal Characteristics
| Year | Spatial Coverage | Spatial Resolution | Temporal Coverage |
|---|---|---|---|
| 2014 | U.S. (California, Nevada) | 1.0 to 3.0 m | 2014-06-21 to 2014-09-03 |
| 2015 | India | 3.9 to 8.2 m | 2015-12-18 to 2015-12-31 |
| 2016 | U.S. (California); India | 2.3 to 8.1 m | 2016-01-01 to 2016-10-06 |
| 2017 | U.S. (Alaska/ABoVE study region, California, Nevada, Virginia); Western Canada (ABoVE study region) | 1.0 to 19.7 m | 2017-02-28 to 2017-10-23 |
| 2018 | U.S. (Alaska/ABoVE study region); Europe; India | 1.0 to 5.5 m | 2018-02-24 to 2018-10-10 |
| 2019 | U.S. (Alaska ABoVE study region, south central and southwestern US); Northwestern Canada (Northwest Territories); Greenland | 1.8 to 9.5 m | 2019-06-21 to 2019-10-27 |
| 2020 | U.S. (California and Nevada) | 1.0 to 8.5 m | 2020-07-12 to 2020-08-01 |
| 2021 | U.S. (Delta-X Mississippi River Delta, Louisiana) | 3.8 to 4.8 m | 2021-03-27 to 2021-9-25 |
| 2022 | U.S. (Alaska, California, Idaho, Oregon, Washington); Canada (Alberta, Saskatchewan) | 1.0 to 7.6 m | 2022-02-23 to 2022-09-17 |
Temporal Resolution: One-time estimate
Study Area: All latitudes and longitudes given in decimal degrees.
| Westernmost Longitude | Easternmost Longitude | Northernmost Latitude | Southernmost Latitude |
|---|---|---|---|
| -166.65 | 88.81 | 84.36 | 9.200 |
Data File Information
This dataset includes ENVI binary files (.bin) with associated header (.hdr) files holding metadata in text format.
See Tables 1-2 for description of file types and numbers of files.
The naming convention for the ENVI files is <flight prefix>_<product>_<ver>_img<ext>, where
- <flight prefix> = flight line identifier, angYYYMMDDthhmmss, encoding the date and time by year (YYYY), month (MM), day (DD), hour (hh), minute (mm), and second (ss) of the flight (e.g., ang20200708t192518).
- <product> = Level 2 data product as described in Table 1.
- <ver> = product versioning marker, e.g., "v2y1".
- <ext> = file extension of ".bin" denotes ENVI binary data files, while “.hdr” denotes the ENVI header files.
The header (.hdr) for each ENVI holds metadata for the binary data file, including:
- number of samples (rows), lines (rows), and bands
- band names
- data type (4 = Float32, 5=Float64), interleave type, and byte order
- map info: projection and datum, coordinates for x y reference points, pixel size, and map units
- no data value
- See https://www.l3harrisgeospatial.com/docs/enviheaderfiles.html for the header format.
The ENVI files are in a rotated UTM projection that follows the trajectory of the respective flight path.
Example file names for one flight line are:
- ang20200801t165409_corr_v2y1_img.bin
- ang20200801t165409_corr_v2y1_img.hdr
- ang20200801t165409_h2o_v2y1_img.bin
- ang20200801t165409_h2o_v2y1_img.hdr
Table 1. Level 2 data products.
| Product abbreviation | Description | Units | Bands |
|---|---|---|---|
| corr | Orthocorrected surface reflectance derived from measured radiances (uW nm-1 cm-2 sr-1). Water absorption bands have been removed and a slight smoothing was applied to the spectra. | 1 | 425 bands at wavelengths of 380 nm to 2510 nm in 5-nm intervals. Wavelength for each band is listed in the header file. Valid reflectance values range 0.0 to 1.0. Some corr files from 2014 have 432 bands. |
| h2o | Column water vapor and optical absorption paths for liquid water and ice for flight line | cm | 3 bands: column water vapor, total liquid water absorption path, total ice absorption path |
| rfl | Orthocorrected surface reflectance derived from measured radiances (uW nm-1 cm-2 sr-1). These ENVIs include all absorption bands without smoothing; water absorption bands are included. | 1 | 425 bands at wavelengths of 380 nm to 2510 nm in 5-nm intervals. Wavelength for each band is listed in the header file. Valid reflectance values range 0.0 to 1.0 |
Application and Derivation
The main objective of the AVIRIS project is to identify, measure, and monitor constituents of the Earth's surface and atmosphere based on molecular absorption and particle scattering signatures. Research with AVIRIS data is predominantly focused on understanding processes related to the global environment and climate change.
The NASA Airborne Visible/Infrared Imaging Spectrometer (AVIRIS-Classic) has been in operation since 1989 acquiring contiguous spectral measurements between 380 and 2510 nm for use by a range of terrestrial ecology science investigations related to: (1) pattern and spatial distribution of ecosystems and their components, (2) ecosystem function, physiology and seasonal activity, (3) biogeochemical cycles, (3) changes in disturbance activity, and (4) ecosystems and human health.
Beginning in 2009, a new NASA Earth Science airborne sensor called the Next Generation Airborne Visible/Infrared Imaging Spectrometer (AVIRIS-NG) was developed by JPL through the funding support from the American Recovery and Reinvestment Act (ARRA). Technical and programmatic oversight of the AVIRIS-NG development was provided by NASA’s Earth Science Technology Office (ESTO).
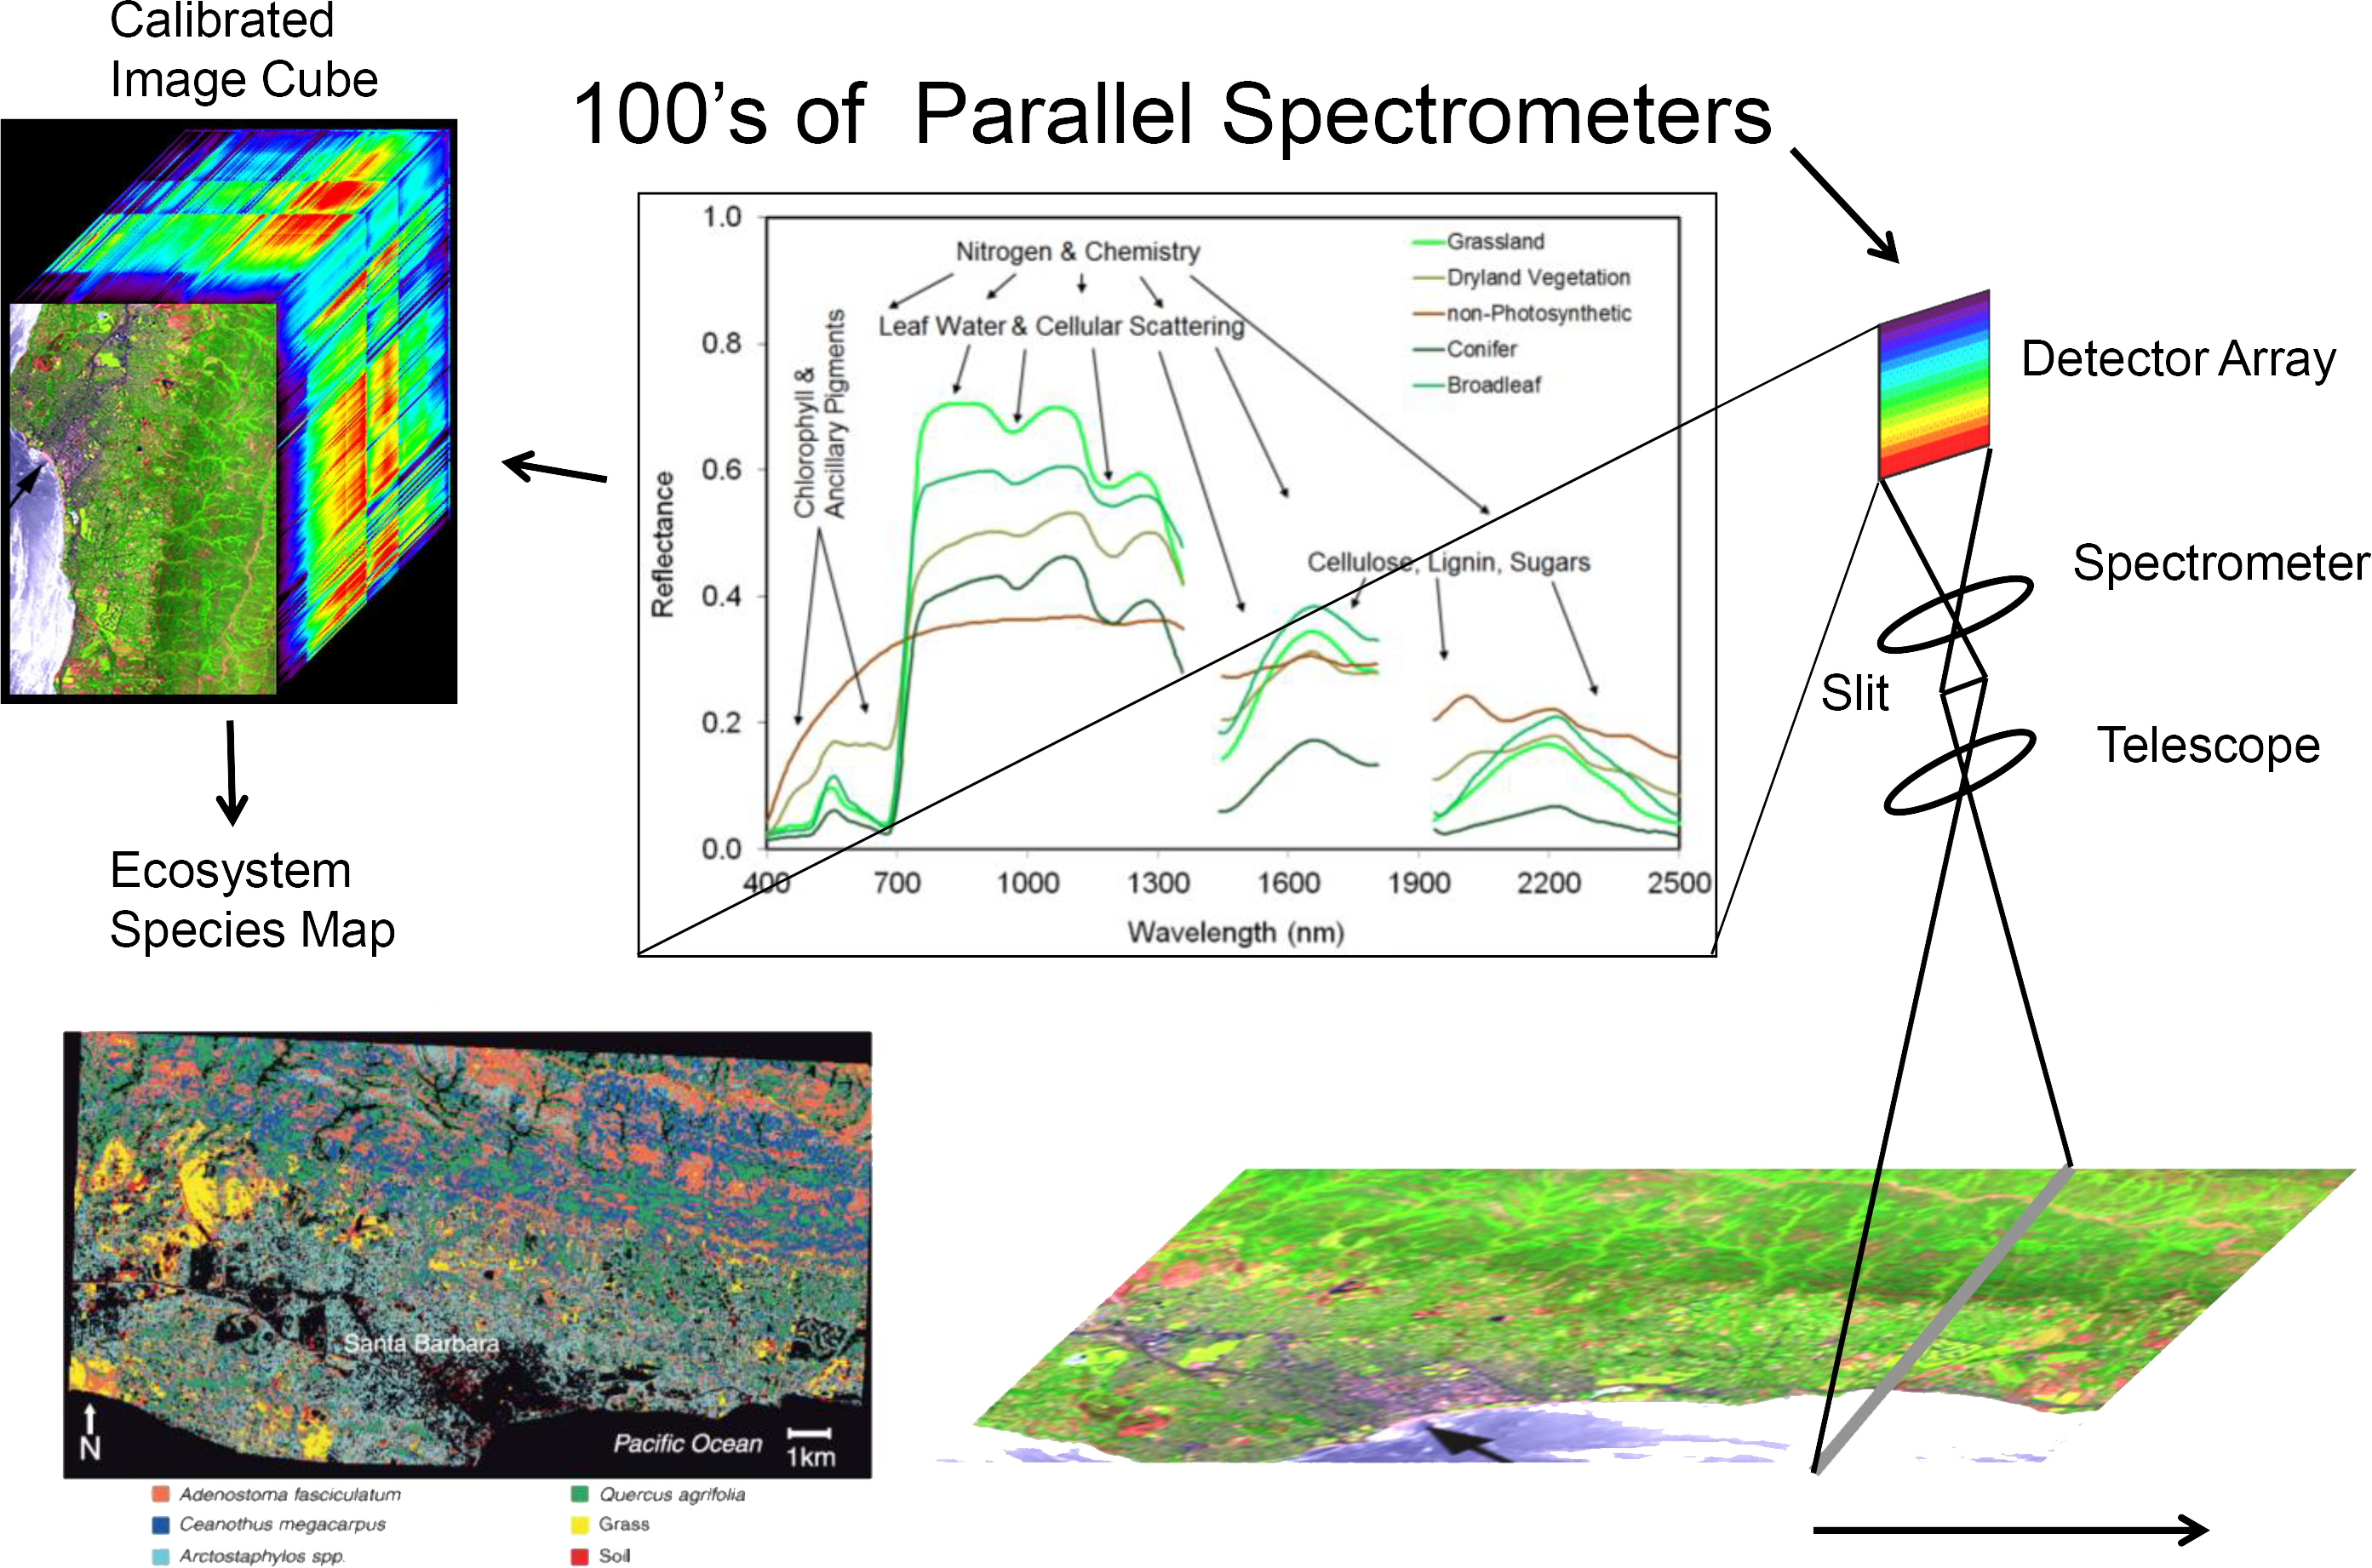
Figure 2. Overview of AVIRIS-NG applications. Source: https://avirisng.jpl.nasa.gov/aviris-ng.html
AVIRIS-NG has been used to develop algorithms to accurately measure surface reflectances in coastal areas where the mixture of water and terrestrial surfaces, sun glint, atmospheric aerosols are challenging (Thompson et al., 2015b; Thompson et al. 2019). AVIRIS-NG has been calibrated and deployed with a new high-rate data-capture system and a new real-time cloud-screening algorithm (Thompson et al., 2014) to support a methane-release experiment at the Department of Energy’s Rocky Mountain Oil Field Test Center. This instrument’s capability to detect and measure methane point sources (Thorpe et al., 2013a, 2013b) is of interest for both greenhouse gas research and natural resource exploration, and the on-board cloud-screening algorithm is applicable for space imaging spectrometer missions.
Quality Assessment
The AVIRIS-NG calibration procedure addresses electronic effects involving radiometric responses of each detector, optical effects involving the spatial and spectral view of each detector, and radiometric calibration. Detector responsiveness is measured at the beginning of each deployment and mid-flight for particularly long deployments. Instrument artifacts in the spectrometer data, such as striping, are removed statistically by minimizing a Markov Random Field model. Likewise, bad pixels are identified and corrected using statistical methods followed by laboratory and field protocols to evaluate effectiveness. Details of calibration methods are available in Chapman et al. (2019).
Data Acquisition, Materials, and Methods
The AVIRIS-NG has been developed to provide continued access to high signal-to-noise ratio imaging spectroscopy measurements in the solar reflected spectral range. The AVIRIS-NG is expected to replace the AVIRIS-Classic instrument that has been flying since 1986.
The AVIRIS-NG measures the wavelength range from 380 nm to 2510 nm with 5-nm sampling. Spectra are measured as images with 600 cross-track elements and spatial sampling from 0.3 m to 4.0 m. AVIRIS-NG has better than 95% cross-track spectral uniformity and >= 95% spectral instantaneous field of view (IFOV) uniformity. The AVIRIS-NG is compatible with a broad array of possible aircraft platforms, such as NASA’s ER-2 jet, the Twin Otter DHC-6 turboprop, and the B200 King Air.
AVIRIS-NG has been calibrated and deployed with a new high-rate data-capture system and a new real-time cloud-screening algorithm to support a methane-release experiment at the Department of Energy’s Rocky Mountain Oil Field Test Center. This instrument’s capability to detect and measure methane point sources is of interest for both greenhouse gas research and natural resource exploration, and the on-board cloud-screening algorithm is applicable for space imaging spectrometer missions.
These L2 products were derived from L1B radiance products. Examples of the methods employed are available in Gao et al. (1993) and Thompson et al. (2015a, 2015b). The calibrated reflectance (corr) products from 2014 have 432 bands. It was determined that some extreme wavelengths could not be reliably calibrated, so standard products from subsequent years have been distributed with 425 bands. The corr ENVI header files list the wavelengths and full width half maximum (fwhm) values for each band.
Additional details about the AVIRIS-NG instrument are available at https://doi.org/10.3334/ORNLDAAC/2095.
Data Access
These data are available through the Oak Ridge National Laboratory (ORNL) Distributed Active Archive Center (DAAC).
AVIRIS-NG L2 Surface Reflectance, Facility Instrument Collection, V1
Contact for Data Center Access Information:
- E-mail: uso@daac.ornl.gov
- Telephone: +1 (865) 241-3952
References
Gao, B.C., K.H. Heidebrecht, and A.F.H. Goetz. 1993. Derivation of scaled surface reflectances from AVIRIS data. Remote Sensing of Environment 44:165-178. https://doi.org/10.1016/0034-4257(93)90014-O
Green, R.O., S. Nolte, M. Helmlinger, and D.R. Thompson. 2022. AVIRIS-NG L1B Orthocorrected Calibrated Radiance, Facility Instrument Collection. ORNL DAAC, Oak Ridge, Tennessee, USA. https://doi.org/10.3334/ORNLDAAC/2095
Green, R.O., and D.R. Thompson. 2023. AVIRIS Facility Instruments: Flight Line Geospatial Polygons and Contextual Data, V1. ORNL DAAC, Oak Ridge, Tennessee, USA. https://doi.org/10.3334/ORNLDAAC/2140 https://doi.org/10.3334/ORNLDAAC/2140
Thompson, D.R., B.C. Gao, R.O. Green, P.E. Dennison, D.A. Roberts, and S. Lundeen. 2015a. Atmospheric correction for global mapping spectroscopy: ATREM advances for the HyspIRI preparatory campaign. Remote Sensing of Environment 167:64-77. https://doi.org/10.1016/j.rse.2015.02.010
Thompson, D.R., F.C. Seidel, B.C. Gao, M. Gierach, R.O. Green, R.M. Kudela, and P. Mouroulis. 2015b. Optimizing irradiance estimates for coastal and inland water imaging spectroscopy. Geophysical Research Letters 42:4116-4123. https://doi.org/10.1002/2015GL063287
Dataset Revisions
| Version | Release Date | Revision Notes |
|---|---|---|
| 1.0 | 2023-09-21 | Appended data from 2022 |
| 1.0 | 2023-04-17 | First publication that includes data from 2014 - 2021 |