Documentation Revision Date: 2023-09-22
Dataset Version: 1
Summary
NASA facility instruments operate out of a NASA research center and support multiple science disciplines, field investigations, and NASA science objectives. Facility instruments are supported by managers in the Earth Science Division (ESD) Research and Analysis Program, and/or the Earth Observation System (EOS) Project Science Office. The AVIRIS-NG system resides at the JPL. The AVIRIS-NG project operates under the Observational Systems Division of the Jet Propulsion Laboratory. In addition to operating and maintaining the sensor, the AVIRIS-NG project works to ensure that experiment requirements are met for each flight and that users are satisfied with data quality and the level of service provided.
This dataset will include all L1B files from the AVIRIS-NG facility instrument. See Tables below for descriptions of data products and the number of files per year.
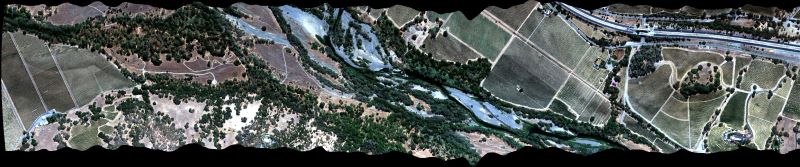
Figure 1. Portion of quick look image for flight ang20200907t214229 on 07 September 2020 over the Russian River in Sonoma County south of Cloverdale, California (approximately 38.7392 lat, -122.9387 lon). Source: ancillary file ang20200907t214229_geo.jpg
Citation
Green, R.O., P.G. Brodrick, J.W. Chapman, M. Eastwood, S. Geier, M. Helmlinger, S.R. Lundeen, W. Olson-Duvall, R. Pavlick, L.M. Rios, D.R. Thompson, and A.K. Thorpe. 2023. AVIRIS-NG L1B Calibrated Radiance, Facility Instrument Collection, V1. ORNL DAAC, Oak Ridge, Tennessee, USA. https://doi.org/10.3334/ORNLDAAC/2095
Table of Contents
- Dataset Overview
- Data Characteristics
- Application and Derivation
- Quality Assessment
- Data Acquisition, Materials, and Methods
- Data Access
- References
- Dataset Revisions
Dataset Overview
This dataset contains Level 1B (L1B) orthocorrected, scaled radiance image files as well as files of observational geometry and illumination parameters and supporting sensor band information from the Airborne Visible / Infrared Imaging Spectrometer-Next Generation (AVIRIS-NG) instrument. This is the NASA Earth Observing System Data and Information System (EOSDIS) facility instrument archive of these data. The NASA AVIRIS-NG is a pushbroom spectral mapping system with high signal-to-noise ratio (SNR), designed and toleranced for high performance spectroscopy. AVIRIS-NG measures reflected radiance at 5-nm intervals in the Visible to Shortwave Infrared (VSWIR) spectral range from 380-2510 nm. The AVIRIS-NG sensor has a 1 milliradian instantaneous field of view, providing altitude dependent ground sampling distances from 20 m to sub-meter range. In this dataset, for each flight line, six file types are included: orthocorrected calibrated radiance image (img) files, geometric lookup table (glt) and orthocorrected observation geometry and illumination (obs_ort) files. Also included are unprojected files of input geometry (igm), parameters relating to the geometry of observation and illumination (obs), and orthocorrected locations of each pixel (loc). In addition, ancillary files for the flight line are provided, including quick look images and polygon outlines of imagery footprints. The AVIRIS-NG L1B data are provided in ENVI binary format, which includes a flat binary file accompanied by a header (.hdr) file holding metadata in text format. The ancillary files include JPEG images and maps in Keyhole Markup Language (KML). The AVIRIS-NG is flown on a variety of aircraft platforms including the Twin Otter, the King Air B-200, and NASA's high altitude ER-2. Additional AVIRIS-NG facility instrument L1B data will be added as they become available. AVIRIS-NG supports NASA Science and applications in many areas including plant composition and function, geology and soils, greenhouse gas mapping, and calibration of orbital platforms.
NASA facility instruments operate out of a NASA research center and support multiple science disciplines, field investigations, and NASA science objectives. Facility instruments are supported by managers in the Earth Science Division (ESD) Research and Analysis Program, and/or the Earth Observation System (EOS) Project Science Office. The AVIRIS-NG system resides at the JPL. The AVIRIS-NG project operates under the Observational Systems Division of the Jet Propulsion Laboratory. In addition to operating and maintaining the sensor, the AVIRIS-NG project works to ensure that experiment requirements are met for each flight and that users are satisfied with data quality and the level of service provided.
This dataset will include all L1B files from the AVIRIS-NG facility instrument. See Tables 1-3 for descriptions of data products and the number of files per year.
Table below lists the number of flight lines captured and the campigns, projects, or locations in which the AVIRIS-NG instrument was used in each year since 2014.
| Year | Flight Lines | Campaigns/Projects |
|---|---|---|
| 2014 | 35 | Airborne Science Objectives |
| 2015 | 198 | Four Corners Anthropogenic Methane Emissions; Airborne Science Objectives: Louisiana; International Crops Research Institute for the Semi-arid Tropics (ICRISAT), India |
| 2016 | 871 | Cal/Val; New Orleans (Louisiana) Land-Sea Continuum; California Methane Survey; India |
| 2017 | 1815 | Arctic-Boreal Vulnerability Experiment (ABoVE); California Methane Survey; Fall Methane Survey (U.S.); California Fire, GOES-R under flight |
| 2018 | 838 | ABoVE; India; Europe; California Methane Survey; Fall Methane Survey (U.S.) |
| 2019 | 794 | ABoVE; Greenland; Fall Methane Survey; Student Airborne Research Program (SARP); Mother Lode Mine, Four Corners Mines |
| 2020 | 592 | California COVID-era Methane; SARP; California Virus and Smoke Impact on Wine Grapes |
| 2021 | 731 | Delta-X; Europe, UK, Iceland; SARP; AErosol RObotic NETwork (AERONET); SnowEx; Southern California Oil Spill |
| 2022 | 1515 | ABoVE; SHIFT; SARP; Methane (California, Four Corners, Canada, GOM, MIT, Carbon Mapper) |
Project: AVIRIS
The Airborne Visible InfraRed Imaging Spectrometer - Classic (AVIRIS-C) and Next Generation (AVIRIS-NG) are two Facility Instruments (FIs) that are part of NASA’s Airborne Science Program (ASP) and the Jet Propulsion Laboratory’s (JPL) Earth Science Airborne Program. The AVIRIS-C is an imaging spectrometer that delivers calibrated images of the upwelling spectral radiance in 224 contiguous spectral channels with wavelengths from 400 to 2500 nanometers (nm). The AVIRIS-NG is the successor to AVIRIS-Classic and provides high signal-to-noise ratio imaging spectroscopy measurements in 425 contiguous spectral channels with wavelengths in the solar reflected spectral range (380-2510 nm). The AVIRIS-NG started operation in 2014 and is expected to replace the AVIRIS-C instrument. Data from AVIRIS-C and AVIRIS-NG have been applied to a wide range of studies in the fields of terrestrial and coastal aquatic plant physiology, atmospheric and aerosol studies, environmental science, snow hydrology, geology, volcanology, oceanography, soil and land management, agriculture, and limnology.
Related Publications
Chapman, J.W., D.R. Thompson, M.C. Helmlinger, B.D. Bue, R.O. Green, M.L. Eastwood, S. Geier, W. Olson-Duvall, and S.R. Lundeen. 2019. Spectral and radiometric calibration of the Next Generation Airborne Visible Infrared Spectrometer (AVIRIS-NG). Remote Sensing 11: 2129. https://doi.org/10.3390/rs11182129
Related Datasets
Green, R.O., P.G. Brodrick, J.W. Chapman, M. Eastwood, S. Geier, M. Helmlinger, S.R. Lundeen, W. Olson-Duvall, R. Pavlick, L.M. Rios, D.R. Thompson, and A.K. Thorpe. 2023. AVIRIS-NG L2 Surface Reflectance, Facility Instrument Collection, V1. ORNL DAAC, Oak Ridge, Tennessee, USA. https://doi.org/10.3334/ORNLDAAC/2110
- Level 2 reflectance products were developed from these L1B data.
Green, R.O., P.G. Brodrick, J.W. Chapman, M. Eastwood, S. Geier, M. Helmlinger, S.R. Lundeen, W. Olson-Duvall, R. Pavlick, L.M. Rios, D.R. Thompson, and A.K. Thorpe. 2023. AVIRIS Facility Instruments: Flight Line Geospatial Polygons and Contextual Data, V1. ORNL DAAC, Oak Ridge, Tennessee, USA. https://doi.org/10.3334/ORNLDAAC/2140
- Flight line ancillary information in tabular and attributed polygon vector files
Data Characteristics
Spatiotemporal Characteristics
| Year | Spatial Coverage | Spatial Resolution | Temporal Coverage |
|---|---|---|---|
| 2014 | U.S. (California, Nevada) | 1.0 to 3.9 m | 2014-06-21 to 2014-09-03 |
| 2015 | U.S. (New Mexico, Colorado, Louisiana); India | 1.0 to 8.2 m | 2015-04-19 to 2015-12-31 |
| 2016 | U.S. (California, Texas, Louisiana); India | 1.0 to 8.1 m | 2016-01-01 to 2016-11-04 |
| 2017 | U.S. (Alaska/ABoVE study region, Arizona, Virginia); Canada (ABoVE study region); Mexico (Sonora) | 1.0 to 26.5 m | 2017-02-28 to 2017-11-13 |
| 2018 | U.S. (Alaska/ABoVE study region and California); Canada (ABoVE study region); Europe; India | 1.0 to 5.5 m | 2018-02-24 to 2018-10-10 |
| 2019 | U.S. (Alaska/ABoVE study region Alaska, south central and southwestern US); Canada (northwestern territory); Greenland | 1.0 to 9.5 m | 2019-06-18 to 2019-10-27 |
| 2022 | U.S. (California and Nevada) | 1.0 to 8.5 m | 2020-07-08 to 2020-09-24 |
| 2021 | U.S. (Louisiana, southwestern US); Iceland; Europe | 1.0 to 8.3 m | 2021-03-18 to 2021-10-12 |
| 2022 | U. S. (Alaska, Arizona, California, Colorado, Idaho, Louisiana, Michigan, Nevada, New Mexico, Ohio, Oregon, Pennsylvania, Texas); Canada (Alberta, British Columbia, Manitoba, Northwest Territories, Nunuavut, Ontario, Quebec, Saskatchewan) | 1.0 to 7.6 | 2022-02-23 to 2022-09-17 |
Temporal Resolution: One-time estimate
Study Area: All latitudes and longitudes given in decimal degrees.
| Westernmost Longitude | Easternmost Longitude | Northernmost Latitude | Southernmost Latitude |
|---|---|---|---|
| -166.651 | 88.8091 | 84.356 | 9.200 |
Data File Information
This dataset includes multiband ENVI binary files (.bin) with associated header (.hdr) files, images in JPEG format (.jpg), and files in compressed Keyhole Markup Language (.kmz). The ENVI header files hold metadata in text format. See Tables 1-3 for description of file types and numbers of files.
The naming convention for the ENVI files is <flight prefix>_<type>_<ver>_<product><ext>, where
- <flight prefix> = flight line identifier, angYYYMMDDthhmmss, encoding the date and time by year (YYYY), month (MM), day (DD), hour (hh), minute (mm), and second (ss) of the flight (e.g., ang20200708t192518).
- <type> = “rdn” indicates radiance product.
- <ver> = product versioning marker, e.g., “v2y1”.
- <product> = Level 1B data product as described in Table 1.
- <ext> = file extension of ".bin" denotes ENVI binary data files, while “.hdr” denotes the ENVI header files.
The header (.hdr) for each ENVI holds metadata for the binary data file, including:
- number of samples (columns), lines (rows), and bands
- band names
- data type (3 = Unsigned Int32, 4 = Float32, 5 = Float64), interleave type, and byte order
- map info: projection and datum, coordinates for x y reference points, pixel size, and map units
- See https://www.l3harrisgeospatial.com/docs/enviheaderfiles.html for the header format.
The orthocorrected ENVI files are in a rotated UTM projection that follows the trajectory of the respective flight path.
The dataset also includes ancillary files for each flight line, which include quick look images and geographic footprint of imagery. The naming convention for these files is <flight prefix>_<product>.<ext>, where
- <flight prefix> = flight line identifier.
- <product> = ancillary data product as described in Table 2.
- <ext> = "jpg" indicates a JPEG image, and "kmz" indicates a file in compressed Keyhole Markup Language
Example file names for one flight line are
- ang20200708t192518_rdn_v2y1_glt.bin
- ang20200708t192518_rdn_v2y1_glt.hdr
- ang20200708t192518_rdn_v2y1_igm.bin
- ang20200708t192518_rdn_v2y1_igm.hdr
- ang20200708t192518_rdn_v2y1_img.bin
- ang20200708t192518_rdn_v2y1_img.hdr
- ang20200708t192518_rdn_v2y1_loc.bin
- ang20200708t192518_rdn_v2y1_loc.hdr
- ang20200708t192518_rdn_v2y1_obs.bin
- ang20200708t192518_rdn_v2y1_obs.hdr
- ang20200708t192518_rdn_v2y1_obs_ort.bin
- ang20200708t192518_rdn_v2y1_obs_ort.hdr
- ang20200708t192518_geo.jpg
- ang20200708t192518_RGB.jpg
- ang20200708t192518_outline_KML.kmz
- ang20200708t192518_overlay_KML.kmz
Table 1. Level 1B data products.
| Product abbreviation | Description | Bands | Format |
|---|---|---|---|
| glt | Geometric look-up table. Orthocorrected product with a fixed pixel size projected into a rotated UTM system that contains the information about which original pixel occupies which output pixel in the final product. Additionally, each pixel is sign-coded to indicate if it is real (indicated by a positive value) or a nearest-neighbor infill (indicated by negative values). | 2 bands: sample number, original line number | 16 bit integer, band interleaved by pixel |
| igm | Input geometry file. Pixel location data for each radiance image cube. No map correction or resampling is applied; the IGM file reports the surface location of the unadjusted pixel centers in (a) geographic coordinates as decimal degrees or (b) projected UTM coordinates; both use WGS-84 datum. Data includes the estimated ground elevation at pixel center in m. |
3 bands: |
64-bit double precision, band interleaved by pixel |
| img | Orthocorrected calibrated radiances. The header records the spectral calibration (wavelength and full-width at half-maximum value) for every channel in the radiance data. | 425 bands: radiance (uW nm-1 cm-2 sr-1) at wavelengths of 380 nm to 2510 nm in 5-nm intervals | 32-bit floating point, band interleaved by line |
| loc | Orthocorrected pixel locations for each radiance image cube in geographic coordinates as decimal degrees in WGS-84 datum and estimated ground elevation at pixel center in m. | 3 bands: longitude, latitude, elevation | 64-bit double precision, band interleaved by pixel |
| obs | Observation parameter file for unorthocorrected radiance image. Parameters relate the geometry of observation and illumination for each pixel. | 11 bands: Path length (m), To-sensor azimuth (0 to 360 degrees clockwise from N), To-sensor zenith (0 to 90 degrees from zenith) , To-sun azimuth (0 to 360 degrees clockwise from N), To-sun zenith (0 to 90 degrees from zenith) , Solar phase, Slope, Aspect, Cosine(i), UTC Time, Earth-sun distance (AU) | 64-bit double precision, band interleaved by pixel |
| obs_ort | Orthocorrected observation parameter file that relates to the each pixel’s geometry of observation and illumination. |
Table 2. Ancillary files associated with AVIRIS-NG flight lines.
| Product abbreviation | Format | Description |
|---|---|---|
| RGB.jpg | JPEG | RGB image for flight line derived from reflectance |
| geo.jpg | JPEG | Quick look image for flight line with typically lower resolution than RGB image |
| outline_KML.kmz | KMZ | Polygon outline of flight line imagery footprint |
| overlay_KML.kmz | KMZ | RGB image overlaid on polygon outline of flight line imagery footprint |
Application and Derivation
The main objective of the AVIRIS project is to identify, measure, and monitor constituents of the Earth's surface and atmosphere based on molecular absorption and particle scattering signatures. Research with AVIRIS data is predominantly focused on understanding processes related to the global environment and climate change.
The AVIRIS-NG sensor collects data that can be used for characterization of the Earth's surface and atmosphere from geometrically coherent spectroradiometric measurements. This data can be applied to studies in the fields of oceanography, environmental science, snow hydrology, geology, volcanology, soil and land management, atmospheric and aerosol studies, agriculture, and limnology. Applications under development include the assessment and monitoring of environmental hazards such as toxic waste, oil spills, and land/air/water pollution. With proper calibration and correction for atmospheric effects, the measurements can be converted to ground reflectance data which can then be used for quantitative characterization of surface features.
The NASA Airborne Visible/Infrared Imaging Spectrometer (AVIRIS-Classic) has been in operation since 1987 acquiring contiguous spectral measurements between 380 and 2510 nm for use by a range of terrestrial ecology science investigations related to: (1) pattern and spatial distribution of ecosystems and their components, (2) ecosystem function, physiology and seasonal activity, (3) biogeochemical cycles, (3) changes in disturbance activity, and (4) ecosystems and human health. This instrument has been useful in developing techniques for atmospheric corrections needed to estimate surface reflectance using hyperspectral data (Thompson et al., 2015a; Thompson et al., 2016).
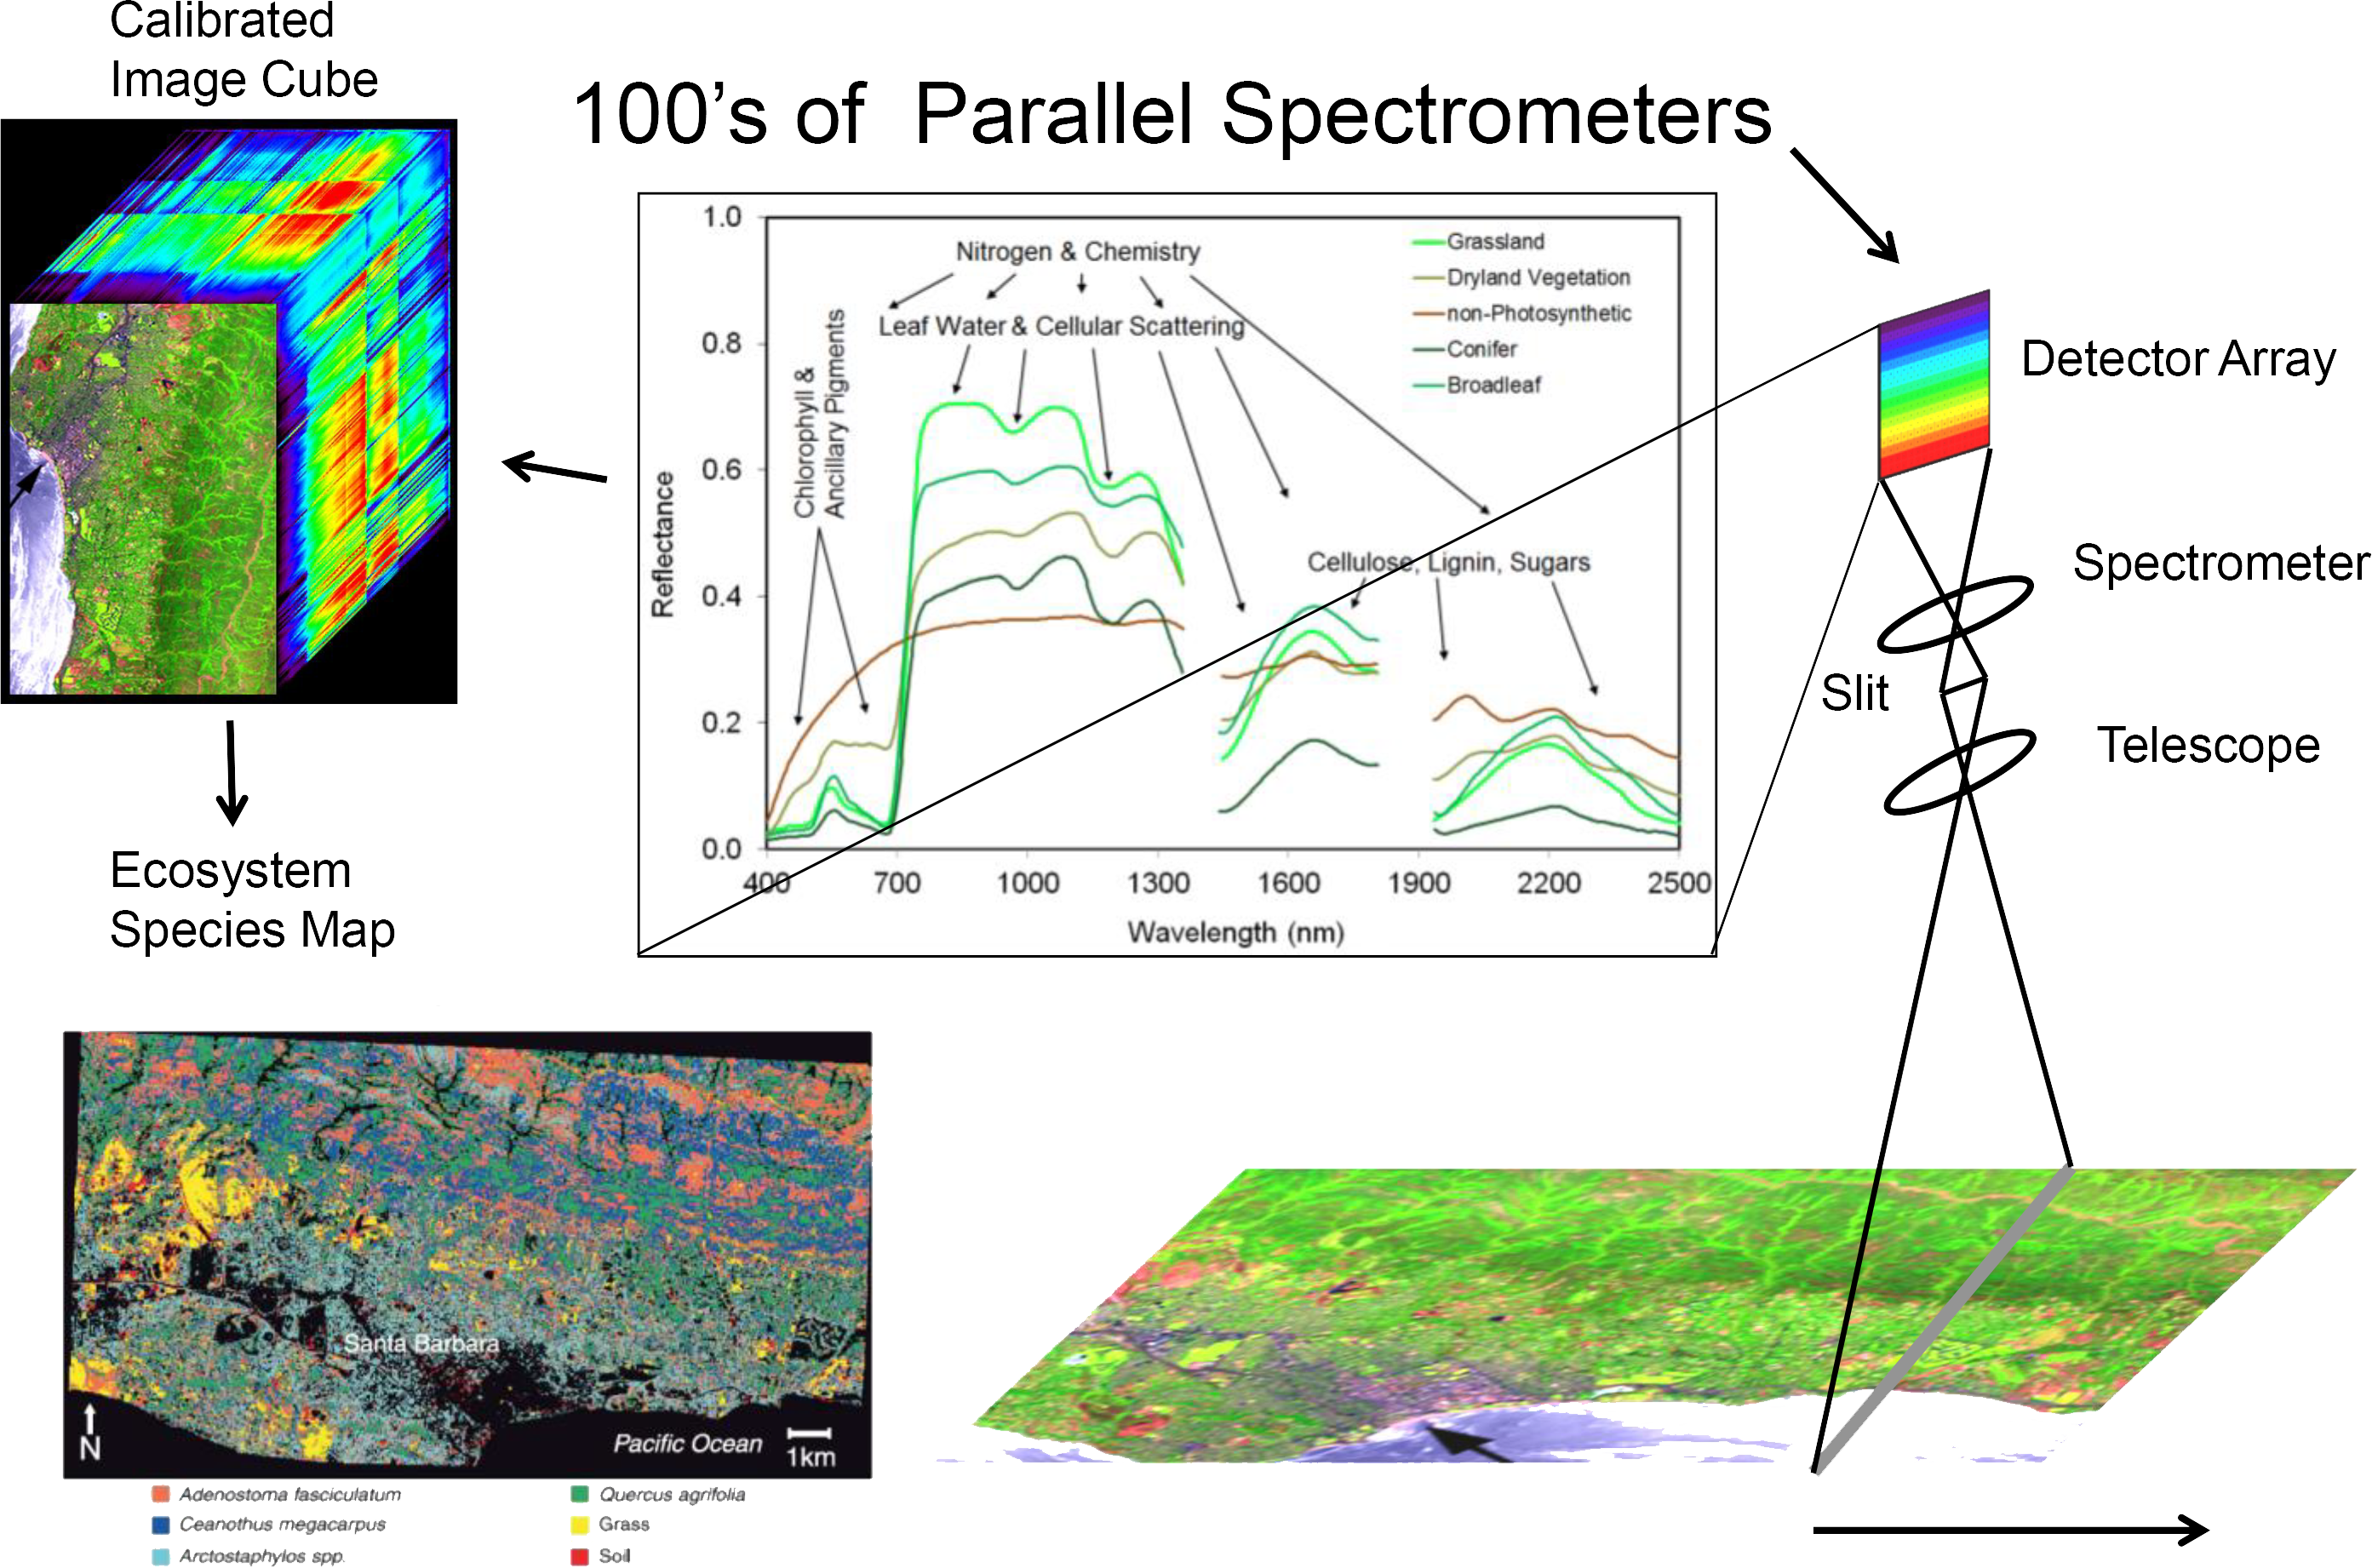
Figure 2. Overview of AVIRIS-NG applications. Source: https://avirisng.jpl.nasa.gov/aviris-ng.html
Beginning in 2009, a new NASA Earth Science airborne sensor called the Next Generation Airborne Visible/Infrared Imaging Spectrometer (AVIRIS-NG) was developed by JPL through the funding support from the American Recovery and Reinvestment Act (ARRA). Technical and programmatic oversight of the AVIRIS-NG development was provided by NASA’s Earth Science Technology Office (ESTO).
AVIRIS-NG has been used to develop algorithms to accurately measure surface reflectances in coastal areas where the mixture of water and terrestrial surfaces, sun glint, atmospheric aerosols are challenging (Thompson et al., 2015b; Thompson et al. 2019). AVIRIS-NG has been calibrated and deployed with a new high-rate data-capture system and a new real-time cloud-screening algorithm (Thompson et al., 2014) to support a methane-release experiment at the Department of Energy’s Rocky Mountain Oil Field Test Center. This instrument’s capability to detect and measure methane point sources (Thorpe et al., 2013a, 2013b) is of interest for both greenhouse gas research and natural resource exploration, and the on-board cloud-screening algorithm is applicable for space imaging spectrometer missions.
Quality Assessment
The AVIRIS-NG calibration procedure addresses electronic effects involving radiometric responses of each detector, optical effects involving the spatial and spectral view of each detector, and radiometric calibration. Detector responsiveness is measured at the beginning of each deployment and mid-flight for particularly long deployments. Instrument artifacts in the spectrometer data, such as striping, are removed statistically by minimizing a Markov Random Field model. Likewise, bad pixels are identified and corrected using statistical methods followed by laboratory and field protocols to evaluate effectiveness. Details of calibration methods are available in Chapman et al. (2019).
Data Acquisition, Materials, and Methods
The Airborne Visible-Infrared Imaging Spectrometer (AVIRIS-NG) was developed to provide continued access to high signal-to-noise ratio imaging spectroscopy measurements in the solar reflected spectral range (Green et al., 1998). AVIRIS-NG is expected to replace the AVIRIS-Classic instrument.
AVIRIS-NG measures the wavelength range from 380 nm to 2510 nm with 5-nm sampling. Spectra are measured as images with 600 cross-track elements and spatial sampling from 0.3 m to 4.0 m. AVIRIS-NG has better than 95% cross-track spectral uniformity and >= 95% spectral instantaneous field of view (IFOV) uniformity. AVIRIS-NG is compatible with a broad array of possible aircraft platforms, such as NASA’s ER-2 jet, the Twin Otter DHC-6 turboprop, and the B200 King Air.
The major components of the AVIRIS-NG flight package, include the sensor encased in a vacuum enclosure, the high precision INS/GPS, the focal plane electronics, the On-Board Calibrator (OBC) electronics source, the heaters boxes, and a vibration isolating aircraft mount (Fig. 3).
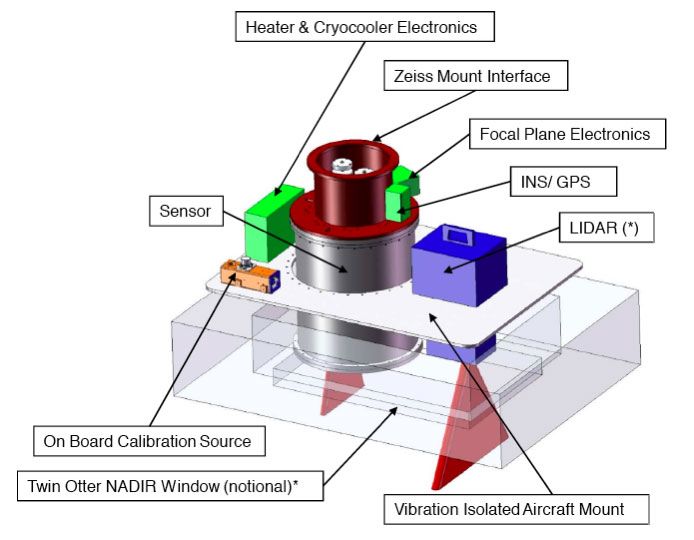
Figure 3. Major components of the AVIRIS-NG airborne flight package. Also shown here is an optional lidar companion instrument. Source: https://avirisng.jpl.nasa.gov/instrument1.html
The AVIRIS-NG sensor is approximately 83 cm tall x 57 cm in diameter. Major sensor components include the optical telescope and spectrometer benches, the detector, the source for the On Board Calibrator (OBC) and kinematic struts which suspend the assembly from the instrument backplate. The sensor is housed with a vacuum container and three thermal shields (Fig. 4) and operated at temperatures of down to -40 C at the detector. Maintenance of stable temperature across the instrument is vital to minimizing thermal distortions which could affect optical alignment. Operational temperature is maintained by the operation of the two coolers. Active cooling allows operation for up to 14 days at a time with only minimal maintenance of vacuum.
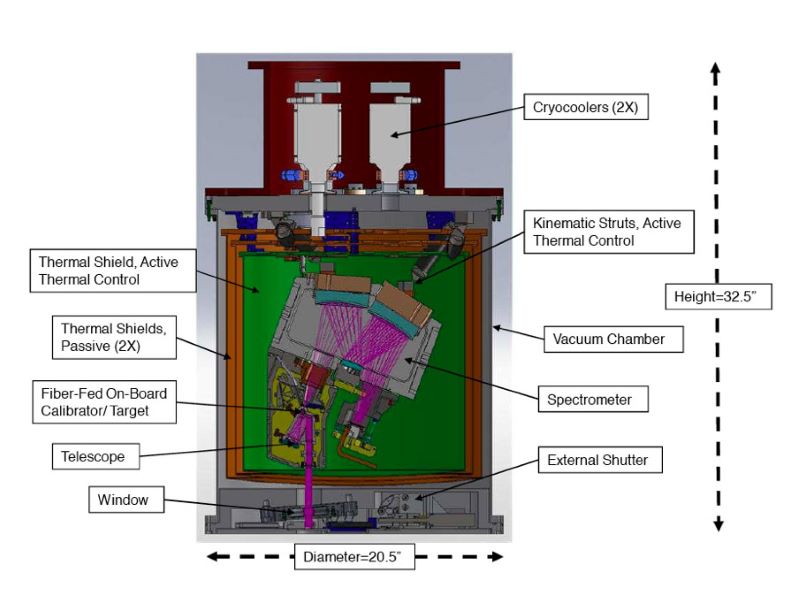
Figure 4. The AVIRIS-NG sensor. Source: https://avirisng.jpl.nasa.gov/instrument1.html
Table 3. Summary of specifications for AVIRIS-NG. Source: https://avirisng.jpl.nasa.gov/specifications.html
| Parameter | Value |
| Wavelength | 380 nm to 2510 nm |
| Spectral Resolution (FWHM, minimum) | 5nm ± 0.5 nm |
| Field of View | 36 ± 2 degrees with 600 resolved elements |
| Instantaneous Field of View | 1.4 mrad ± 1.0 mrad |
| Spatial Sampling (maximum observed at resolved elements) | 1.0 mrad ± 0.1 mrad |
| Spectral Distortion (smile) | Uniformity >97% |
| Spectral Distortion (keystone) | Unformity >97% |
| FPA | 480 (spectral direction) x 640 (cross track) |
| Frame Rate | 10 - 100 frames per second |
| Pixel Size | 27 microns x 27 microns |
| Calibration | On-board calibrator |
| Data Resolution | 14 bits |
| Data Rate | Up to 74 MB/s of throughput |
| Data Volume | Up to 1.0 TB of raw data before disk swap |
| Physical Volume | 83 cm (H) x 57 cm (Dia.) plus electronics boxes and racks |
| Mass | 465 kg |
| Vacuum Requirement | 10-4 torr |
| Ambient Operating Temperature | -40 to +50 C |
| Maximum Altitude | 18 km |
| Cool-Down Time | <48 hours |
| Operational Time / Mission | 14 days |
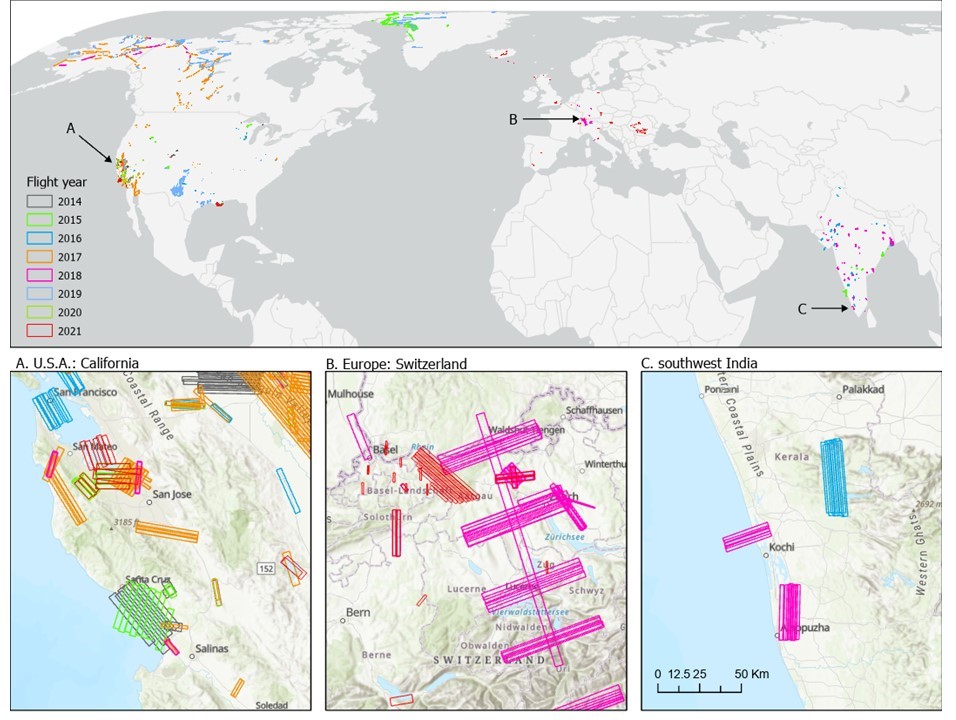
Figure 5. Global distribution of AVIRIS-NG flight lines for 2014-2021. Insets show detailed distribution in (A) vicinity of San Francisco, California, U.S., (B) Switzerland, and (C) southern India. Imagery footprints are represented by rectangular polygons.
Data Access
These data are available through the Oak Ridge National Laboratory (ORNL) Distributed Active Archive Center (DAAC).
AVIRIS-NG L1B Calibrated Radiance, Facility Instrument Collection, V1
Contact for Data Center Access Information:
- E-mail: uso@daac.ornl.gov
- Telephone: +1 (865) 241-3952
References
Chapman, J.W., D.R. Thompson, M.C. Helmlinger, B.D. Bue, R.O. Green, M.L. Eastwood, S. Geier, W. Olson-Duvall, and S.R. Lundeen. 2019. Spectral and radiometric calibration of the Next Generation Airborne Visible Infrared Spectrometer (AVIRIS-NG). Remote Sensing 11: 2129. https://doi.org/10.3390/rs11182129
Green, R.O., M.L. Eastwood, C.M. Sarture, T. G. Chrien, M. Aronsson, B.J. Chippendale, J.A. Faust, B.E. Pavri, C. J. Chovit, M. Solis, M.R. Olah, and O. Williams. 1998. Imaging Spectroscopy and the Airborne Visible/Infrared Imaging Spectrometer (AVIRIS). Remote Sensing of Environment 65:227-248. https://doi.org/10.1016/S0034-4257(98)00064-9
Green, R.O., P.G. Brodrick, J.W. Chapman, M. Eastwood, S. Geier, M. Helmlinger, S.R. Lundeen, W. Olson-Duvall, R. Pavlick, L.M. Rios, D.R. Thompson, and A.K. Thorpe. 2023. AVIRIS-NG L2 Surface Reflectance, Facility Instrument Collection, V1. ORNL DAAC, Oak Ridge, Tennessee, USA. https://doi.org/10.3334/ORNLDAAC/2110
Green, R.O., P.G. Brodrick, J.W. Chapman, M. Eastwood, S. Geier, M. Helmlinger, S.R. Lundeen, W. Olson-Duvall, R. Pavlick, L.M. Rios, D.R. Thompson, and A.K. Thorpe. 2023. AVIRIS Facility Instruments: Flight Line Geospatial Polygons and Contextual Data, V1. ORNL DAAC, Oak Ridge, Tennessee, USA. https://doi.org/10.3334/ORNLDAAC/2140
Thompson, D.R., K. Cawse-Nicholson, Z. Erickson, C.G. Fichot, C. Frankenberg, B.-C. Gao, M.M. Gierach, R.O. Green, D. Jensen, V. Natraj, and A. Thompson. 2019. A unified approach to estimate land and water reflectances with uncertainties for coastal imaging spectroscopy. Remote Sensing of Environment 231:111198. https://doi.org/10.1016/j.rse.2019.05.017
Thompson, D.R., B.C. Gao, R.O. Green, P.E. Dennison, D.A. Roberts, and S. Lundeen. 2015a. Atmospheric correction for global mapping spectroscopy: ATREM advances for the HyspIRI preparatory campaign. Remote Sensing of Environment 167:64-77. https://doi.org/10.1016/j.rse.2015.02.010
Thompson, D.R., R.O. Green, D. Keymeulen, S. Lundeen, Y. Mouradi, R. Castano, S.A. Chien. 2014. Rapid spectral cloud screening onboard aircraft and spacecraft. IEEE Transactions on Geoscience and Remote Sensing 52:6779-6792. https://doi.org/10.1109/TGRS.2014.2302587
Thompson, D.R., F.C. Seidel, B.C. Gao, M. Gierach, R.O. Green, R.M. Kudela, and P. Mouroulis. 2015b. Optimizing irradiance estimates for coastal and inland water imaging spectroscopy. Geophysical Research Letters 42:4116-4123. https://doi.org/10.1002/2015GL063287
Thompson, D. R., D.A. Roberts, B. C. Gao, R. O. Green, L. Guild, K. Hayashi, R. Kudela, and S. Palacios. 2016. Atmospheric correction with the Bayesian empirical line. Optics Express 24: 2134-2144. https://doi.org/10.1364/OE.24.002134
Thorpe, A.K., C. Frankenberg, and D. A. Roberts. 2013a. Retrieval techniques for airborne imaging of methane concentrations using high spatial and moderate spectral resolution: application to AVIRIS. Atmospheric Measurement Techniques: Discussions 6:8543-8588. https://doi.org/ 10.5194/amtd-6-8543-2013
Thorpe, A.K., D.A. Roberts, E.S. Bradley, C.C. Funk, P.E. Dennison, and I. Leifer. 2013b. High resolution mapping of methane emissions from marine and terrestrial sources using a Cluster-Tuned Matched Filter technique and imaging spectrometry. Remote Sensing of Environment 134:305-318. https://doi.org/10.1016/j.rse.2013.03.018
Dataset Revisions
| Version | Release Date | Revision Notes |
|---|---|---|
| 1.0 | 2023-09-22 | Appended data from 2022 |
| 1.0 | 2023-04-17 | First publication that includes data from 2014 - 2021 |