Documentation Revision Date: 2025-06-20
Dataset Version: 1
Summary
There are 177 data files in cloud optimized GeoTIFF format and one file in JSON format with this dataset. The JSON file provides metadata for each of the 177 identified plumes.
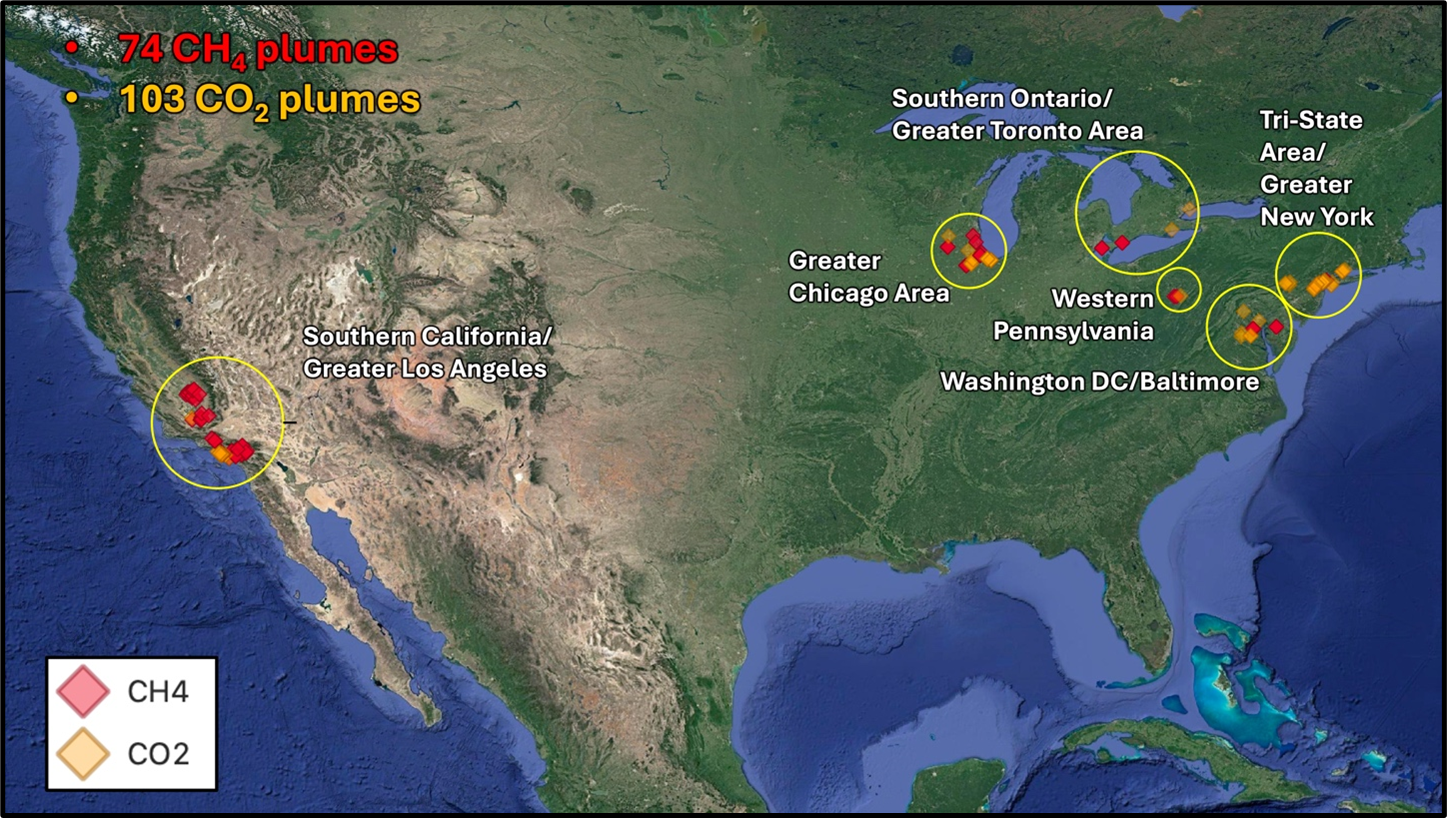
Figure 1. Study areas flown with AVIRIS-NG for the STAQS campaign in 2023 and the locations of the 177 observed methane and carbon dioxide plumes.
Citation
Jensen, D.J., H. Bender, and A.K. Thorpe. 2025. STAQS AVIRIS-NG-derived Methane and Carbon Dioxide Plumes, 2023. ORNL DAAC, Oak Ridge, Tennessee, USA. https://doi.org/10.3334/ORNLDAAC/2406
Table of Contents
- Dataset Overview
- Data Characteristics
- Application and Derivation
- Quality Assessment
- Data Acquisition, Materials, and Methods
- Data Access
- References
Dataset Overview
This dataset contains enhanced column-integrated methane (CH4) and carbon dioxide (CO2) (concentration lengths) acquired from 211 flight lines across North America imaged by the Airborne Visible/Infrared Imaging Spectrometer-Next Generation (AVIRIS-NG) between June 26 and August 15, 2023 for NASA’s Synergistic TEMPO Air Quality Science (STAQS) campaign. Enhanced CH4 and CO2 concentrations were estimated from the L1B radiance measurements (Green et al., 2023) using a cluster matched filter approach (Thorpe et al., 2013). This algorithm searches each pixel's radiance spectrum for deviations that are characteristic of a greenhouses gas's (GHG's) absorption spectrum (Brodrick et al., 2024). A total of 177 greenhouse gas plumes were identified and delineated, of which 74 were CH4 and 103 were CO2.
Projects:
AVIRIS
The Airborne Visible InfraRed Imaging Spectrometer - Classic (AVIRIS-C) and Next Generation (AVIRIS-NG) are two Facility Instruments (FIs) that are part of NASA’s Airborne Science Program (ASP) and the Jet Propulsion Laboratory’s (JPL) Earth Science Airborne Program. The AVIRIS-C is an imaging spectrometer that delivers calibrated images of the upwelling spectral radiance in 224 contiguous spectral channels with wavelengths from 400 to 2500 nanometers (nm). The AVIRIS-NG is the successor to AVIRIS-Classic and provides high signal-to-noise ratio imaging spectroscopy measurements in 425 contiguous spectral channels with wavelengths in the solar reflected spectral range (380-2510 nm). The AVIRIS-NG started operation in 2014 and is expected to replace the AVIRIS-C instrument. Data from AVIRIS-C and AVIRIS-NG have been applied to a wide range of studies in the fields of terrestrial and coastal aquatic plant physiology, atmospheric and aerosol studies, environmental science, snow hydrology, geology, volcanology, oceanography, soil and land management, agriculture, and limnology.
STAQS
NASA’s Synergistic TEMPO Air Quality Science (STAQS) airborne campaign saw the deployment of multiple instruments targeting air quality measurements over large metropolitan areas across the USA and Canada. The AVIRIS-NG was deployed alongside the High Altitude Lidar Observatory (HALO) on NASA’s Gulfstream-3, conducting a series of data collections across North America. While HALO acquired precise concentrations of various atmospheric gases at nadir, AVIRIS-NG’s shortwave infrared (SWIR) coverage and imaging capabilities allow the instrument to map methane (CH4) and carbon dioxide (CO2) emissions and identify their point sources.
Related Datasets
Chlus, A.M., P.G. Brodrick, A.K. Thorpe, J.W. Chapman, D.J. Jensen, R.W. Coleman, J. Fahlen, W. Olson-Duvall, D.R. Thompson, and R.O. Green. 2024. AVIRIS-3 L2B Greenhouse Gas Enhancements, Facility Instrument Collection. ORNL DAAC, Oak Ridge, Tennessee, USA. https://doi.org/10.3334/ORNLDAAC/2358
Green, R.O., P.G. Brodrick, J.W. Chapman, M. Eastwood, S. Geier, M. Helmlinger, S.R. Lundeen, W. Olson-Duvall, R. Pavlick, L.M. Rios, D.R. Thompson, and A.K. Thorpe. 2023. AVIRIS-NG L1B Calibrated Radiance, Facility Instrument Collection, V1. ORNL DAAC, Oak Ridge, Tennessee, USA. https://doi.org/10.3334/ORNLDAAC/2095
Green, R., A. Thorpe, P. Brodrick, D. Chadwick, A. Lopez, C. Elder, C. Villanueva-Weeks, J. Fahlen, R. Coleman, D. Jensen, H. Bender, Q. Vinckier, C. Xiang, W. Olson-Duvall, S. Lundeen, and D.R. Thompson. 2023. EMIT L2B Methane Enhancement Data 60 m V001. NASA EOSDIS Land Processes Distributed Active Archive Center. https://doi.org/10.5067/EMIT/EMITL2BCH4ENH.001
Acknowledgement
The research was carried out at the Jet Propulsion Laboratory, California Institute of Technology, under a contract with the National Aeronautics and Space Administration (80NM0018D0004).
Data Characteristics
Spatial Coverage: Canada and the US
Spatial Resolution: 8.5 to 12 m
Temporal Coverage: 2023-06-26 to 2023-08-15
Temporal Resolution: Irregular
Study Area (All latitude and longitude are given in decimal degrees)
| Study Area | Westernmost Extent | Easternmost Extent | Northernmost Extent | Southernmost Extent |
|---|---|---|---|---|
| Canada and the US | -119.6784 | -73.0944 | 43.6502 | 33.7137 |
Data File Information
There are 177 data files in cloud optimized GeoTIFF (.tif) format and one file in JSON (.json) format with this dataset. The JSON file provides metadata related to each of the 177 identified plumes (files).
GeoTIFF naming convention: ang<YYYYMMDD>t<hhmmss>_<GGG>_<Plume#>.tif , where:
- <YYYYMMDD> = date of AVIRIS-NG data acqusition; year (YYYY), month (MM), day (DD)
- <hhmmss> = UTC time of acqusition; hour (hh), minute (mm), second (ss)
- <GGG> = greenhouse Gas Type (“CH4” or “CO2”)
- <Plume#> = plume ID number corresponding to the “PlumeID” field in the JSON file
Example file name: ang20230815t182857_CO2_Plume177.tif
Properties of the GeoTIFF files
- Coordinate system: UTM projection, zone varies by file, WGS 1984 datum, units = m
- Bands: 1
- Pixel values: greenhouse gas enhancement above background measured as concentration length in parts per million meters (ppm m)
- Data type: Float32
Metadata in STAQS_AVIRIS-NG_GHG_Plumes.json:
- flight line name per plume. This is the first part of the file name (ang<YYYYMMDD>t<hhmmss>).
For example, flightline ang230627t175226 is in file name ang20230627t175226_CH4_Plume1.tif - plume ID number - also found in the .tif file names
- latitude and longitude in decimal degrees for each CH4 and CO2 plume
Application and Derivation
This dataset was collected to detect and quantify methane and carbon dioxide point source emissions. In doing so, this dataset aims to improve regional emission budgets for the surveyed metropolitan areas and to inform planning activities for emission reduction.
Quality Assessment
From 211 flightlines, a total of 177 greenhouse gas plumes were identified and delineated, of which 74 were CH4 and 103 were CO2. Each greenhouse gas enhancement product was visually surveyed for detectable plumes, which were then manually delineated in QGIS (Figure 2). The origin point coordinates were then identified for each plume. Each plume complex was subject to a manual review process by two reviewers, such that low confidence from either reviewer regarding the plume’s authenticity resulted in that plume being discarded.
Data Acquisition, Materials, and Methods
AVIRIS-NG, the Next Generation Airborne Visible/Infrared Imaging Spectrometer, is a pushbroom spectral mapping system with a high signal-to-noise ratio (SNR) designed for high performance spectroscopy. AVIRIS-NG was developed as a successor to the Classic Airborne Visible Infrared Imaging Spectrometer (AVIRIS-C) (Green et al., 1998). The instrument covers the entire solar reflected spectrum from 380-2510 nm with a single Focal Plane Array (FPA), at a spectral sampling of approximately 5 nm. The AVIRIS-NG sensor has a 1 milliradian instantaneous field of view, providing altitude-dependent ground sampling distance ranging from sub-meter to 20 m scales. Its detector has a 640×480-pixel array, from which standard products are generated using the sensor’s 600 cross-track spatial samples and 425 spectral samples. Each acquisition is a “flight line” forming a continuous strip of pushbroom data that typically takes 1-10 minutes to acquire. Multiple aircraft overflights cover the region of interest in these strips, accumulating a combined map of the target area. AVIRIS-NG has four components: 1) a sensor with its mount and camera glass mounted at a nadir port; 2) an onboard calibrator (OBC), mounted in the cabin next to the sensor; 3) a forward operator electronics rack, and 4) an aft thermal-control electronics rack. For the Synergistic TEMPO Air Quality Science (STAQS) campaign, AVIRIS-NG was implemented on NASA’s G-III aircraft alongside the High Altitude LiDAR Observatory (HALO).
211 flightlines across North America were imaged by AVIRIS-NG between June 27 and August 15, 2023 (Figure 1). Enhanced methane and carbon dioxide concentrations were estimated from the L1B radiance measurements (Green et al., 2023) using a cluster matched filter approach (Thorpe et al., 2013). This algorithm searches each pixel’s radiance spectrum for deviations that are characteristic of a greenhouse gas’s absorption spectrum (Brodrick et al., 2024). Each flightline was thus processed to produce column-integrated methane and carbon dioxide enhancements (concentration lengths, ppm m).
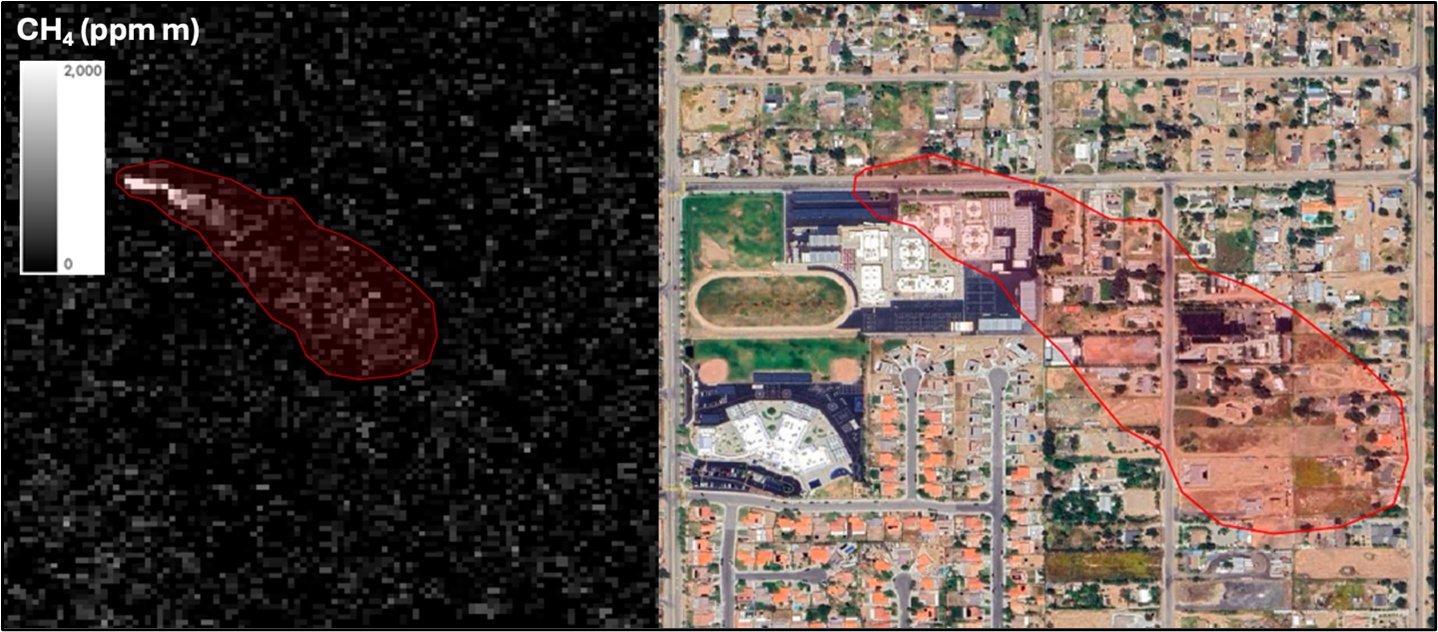
Figure 2. An example methane plume identified from the AVIRIS-NG enhancement data (ang20230627t213915; left). The same plume is shown superimposed on a basemap (right).
Data Access
These data are available through the Oak Ridge National Laboratory (ORNL) Distributed Active Archive Center (DAAC).
STAQS AVIRIS-NG-derived Methane and Carbon Dioxide Plumes, 2023
Contact for Data Center Access Information:
- E-mail: uso@daac.ornl.gov
- Telephone: +1 (865) 241-3952
References
Brodrick, P.G., A.K. Thorpe, C.S. Villanueva-Weeks, C. Elder, J. Fahlen, and D.R. Thompson. 2024. EMIT Greenhouse Gas Algorithms: greenhouse gas point source mapping and related products. Theoretical Basis. Version 0.1. Jet Propulsion Laboratory, California Institute of Technology; Pasadena, California. https://lpdaac.usgs.gov/documents/1696/EMIT_GHG_ATBD_V1.pdf
Chlus, A.M., P.G. Brodrick, A.K. Thorpe, J.W. Chapman, D.J. Jensen, R.W. Coleman, J. Fahlen, W. Olson-Duvall, D.R. Thompson, and R.O. Green. 2024. AVIRIS-3 L2B Greenhouse Gas Enhancements, Facility Instrument Collection. ORNL DAAC, Oak Ridge, Tennessee, USA. https://doi.org/10.3334/ORNLDAAC/2358
Green, R.O., M.L. Eastwood, C.M. Sarture, T.G. Chrien, M. Aronsson, B.J. Chippendale, J.A. Faust, B.E. Pavri, C.J. Chovit, M. Solis, M.R. Olah, and O. Williams. 1998. Imaging spectroscopy and the Airborne Visible/Infrared Imaging Spectrometer (AVIRIS). Remote Sensing of the Environment 65:227-248. https://doi.org/10.1016/S0034-4257(98)00064-9
Green, R.O., P.G. Brodrick, J.W. Chapman, M. Eastwood, S. Geier, M. Helmlinger, S.R. Lundeen, W. Olson-Duvall, R. Pavlick, L.M. Rios, D.R. Thompson, and A.K. Thorpe. 2023. AVIRIS-NG L1B Calibrated Radiance, Facility Instrument Collection, V1. ORNL DAAC, Oak Ridge, Tennessee, USA. https://doi.org/10.3334/ORNLDAAC/2095
Green, R., A. Thorpe, P. Brodrick, D. Chadwick, A. Lopez, C. Elder, C. Villanueva-Weeks, J. Fahlen, R. Coleman, D. Jensen, H. Bender, Q. Vinckier, C. Xiang, W. Olson-Duvall, S. Lundeen, and D.R. Thompson. 2023. EMIT L2B Methane Enhancement Data 60 m V001. NASA EOSDIS Land Processes Distributed Active Archive Center. https://doi.org/10.5067/EMIT/EMITL2BCH4ENH.001
Thorpe, A.K., D.A. Roberts, E.S. Bradley, C.C. Funk, P.E. Dennison, and I. Leifer. 2013. High resolution mapping of methane emissions from marine and terrestrial sources using a Cluster-Tuned Matched Filter technique and imaging spectrometry. Remote Sensing of Environment 134:305-318. https://doi.org/10.1016/j.rse.2013.03.018