Documentation Revision Date: 2024-09-13
Dataset Version: 1
Summary
The AVIRIS-3 sensor has a 40 degree instantaneous field of view with 1234 pixels, providing altitude dependent ground sampling distances from 20 m to sub meter range. This spectrometer measures radiance from surface and atmosphere and is identical in design to the orbital Earth Surface Mineral Dust Source Investigation (EMIT) spectrometer. AVIRIS-3 is flown on a variety of aircraft platforms including the King Air B-200, Gulfstream III, and Gulfstream V.
GHG data are provided in cloud optimized GeoTIFF (COG) format. In addition, ancillary files for each flight line are provided, including a quick look image in GeoTIFF format and text files in YAML format that document processing algorithms and parameters used during production.
Additional AVIRIS-3 facility instrument L2B data will be added as they become available. AVIRIS-3 supports NASA Science and applications in many areas including plant composition and function, geology and soils, greenhouse gas mapping, and calibration of orbital platforms.
NASA facility instruments operate out of a NASA research center and support multiple science disciplines, field investigations, and NASA science objectives. Facility instruments are supported by managers in the Earth Science Division (ESD) Research and Analysis Program, and/or the Earth Observation System (EOS) Project Science Office. The AVIRIS-3 project operates under the Earth Science Airborne Program of the Jet Propulsion Laboratory. In addition to operating and maintaining the sensor, the AVIRIS-3 project works to ensure that experiment requirements are met for each flight and that users are satisfied with data quality and the level of service provided.
This dataset will include all L2B greenhouse gas files from the AVIRIS-3 facility instrument.
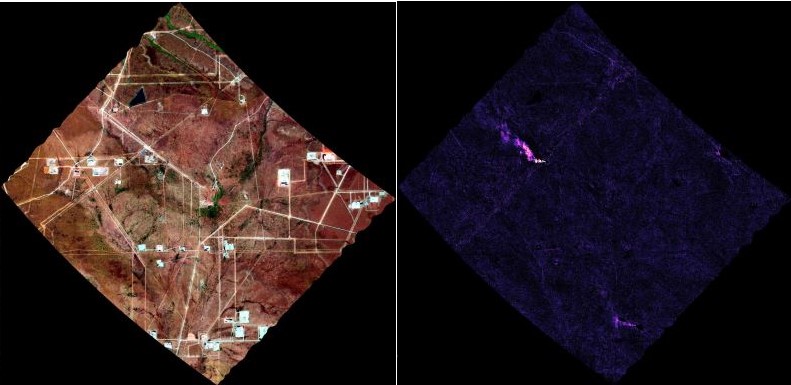
Figure 1. False color image from orthocorrected radiance (left) and methane enhancement (right) derived from AVIRIS-3 data acquired on 2023-10-06 over southeastern New Mexico, U.S., about 75 km east of the Carlsbad, NM (approximately 32.406 latitude, -103.435 longitude). The methane enhancement shows a methane plume upper central portion of the image. Flight scene AV320231006t190153_020.
Citation
Chlus, A.M., P.G. Brodrick, A.K. Thorpe, J.W. Chapman, D.J. Jensen, R.W. Coleman, J. Fahlen, W. Olson-Duvall, D.R. Thompson, and R.O. Green. 2024. AVIRIS-3 L2B Greenhouse Gas Enhancements, Facility Instrument Collection. ORNL DAAC, Oak Ridge, Tennessee, USA. https://doi.org/10.3334/ORNLDAAC/2358
Table of Contents
- Dataset Overview
- Data Characteristics
- Application and Derivation
- Quality Assessment
- Data Acquisition, Materials, and Methods
- Data Access
- References
Dataset Overview
This dataset contains Level 2B (L2b) enhancements of greenhouse gasses (GHG) derived from imagery collected by the Airborne Visible / Infrared Imaging Spectrometer-3 (AVIRIS-3) instrument. Products include methane and carbon dioxide enhancements, each with per-pixel uncertainties and sensitivities to the background. Concentration enhancements are estimated from radiance measurements using a column-wise adaptive matched filter approach, which searches each pixel's radiance spectrum for deviations that are characteristic of a GHG's absorption spectrum.
This is the NASA Earth Observing System Data and Information System (EOSDIS) facility instrument archive of these data. The NASA AVIRIS-3 is a spectral mapping system that measures reflected radiance at 7.4-nm intervals in the Visible to Shortwave Infrared (VSWIR) spectral range from 390-2500 nm.
The AVIRIS-3 sensor has a 40 degree instantaneous field of view with 1234 pixels, providing altitude dependent ground sampling distances from 20 m to sub meter range. This spectrometer measures radiance from surface and atmosphere and is identical in design to the orbital Earth Surface Mineral Dust Source Investigation (EMIT) spectrometer. AVIRIS-3 is flown on a variety of aircraft platforms including the King Air B-200, Gulfstream III, and Gulfstream V.
GHG data are provided in cloud optimized GeoTIFF (COG) format. In addition, ancillary files for each flight line are provided, including a quick look image in GeoTIFF format and text files in YAML format that document processing algorithms and parameters used during production.
This dataset will include all L2B greenhouse files from the AVIRIS-3 facility instrument.
Project: AVIRIS
The Airborne Visible InfraRed Imaging Spectrometer - Classic (AVIRIS-C), Next Generation (AVIRIS-NG), and 3rd Generation (AVIRIS-3) are three Facility Instruments (FIs) that are part of NASA’s Airborne Science Program (ASP) and the Jet Propulsion Laboratory’s (JPL) Earth Science Airborne Program. The AVIRIS-C is an imaging spectrometer that delivers calibrated images of the upwelling spectral radiance in 224 contiguous spectral channels with wavelengths from 400 to 2500 nanometers (nm). The AVIRIS-NG is the successor to AVIRIS-Classic and provides high signal-to-noise ratio imaging spectroscopy measurements in 425 contiguous spectral channels with wavelengths in the solar reflected spectral range (380-2510 nm) with 5 nm sampling. The AVIRIS-NG started operation in 2014 and is expected to replace the AVIRIS-C instrument. The AVIRIS-3 is the third of the AVIRIS spectrometer FI series and has higher signal-to-noise ratio performance than AVIRIS-C or AVIRIS-NG. The core spectrometer of AVIRIS-3 is an optically fast, F/1.8 Dyson imaging spectrometer spanning a wide width (39.5-degree field of view). The AVIRIS-3 provides measurements in 285 contiguous spectral channels with wavelengths in the solar reflected spectral range (390-2500 nm) with 7.4 nm sampling. The AVIRIS-3 started operation in 2023. Data from AVIRIS-C, AVIRIS-NG, and AVIRIS-3 are applicable to a wide range of studies in the fields of terrestrial and coastal aquatic plant physiology, atmospheric and aerosol studies, environmental science, snow hydrology, geology, volcanology, oceanography, soil and land management, agriculture, and limnology.
Related Publications
Fahlen, J.E., P.G. Brodrick, R.W. Coleman, C.D. Elder, D.R. Thompson, A.K. Thorpe, R.O. Green, J.J. Green, A.M. Lopez, and C. Xiang. 2024. Sensitivity and uncertainty in matched-filter-based gas detection with imaging spectroscopy. IEEE Transactions on Geoscience and Remote Sensing 62:1-10. https://doi.org/10.1109/TGRS.2024.3440174
Green, R.O., M.E. Schaepman, P. Mouroulis, S. Geier, L. Shaw, A. Hueini, M. Bernas, I. McKinley, C. Smith, R. Wehbe, M. Eastwood, Q. Vinckier, E. Liggett, S. Zandbergen, D. Thompson, P. Sullivan, C. Sarture, B. Van Gorp, and M. Helmlinger. 2022. Airborne Visible/Infrared Imaging Spectrometer 3 (AVIRIS-3). 2022 IEEE Aerospace Conference (AERO). https://doi.org/10.1109/AERO53065.2022.9843565
Related Datasets
Eckert, R., D.R. Thompson, A.M. Chlus, J.W. Chapman, M. Eastwood, M. Bernas, S. Geier, M. Helmlinger, D. Keymeulen, E. Liggett, S. Nadgauda, L. Rios, L. Shaw, W. Olson-Duvall, P.G. Brodrick, and R.O. Green. 2024. AVIRIS-3 L1B Calibrated Radiance, Facility Instrument Collection. ORNL DAAC, Oak Ridge, Tennessee, USA. https://doi.org/10.3334/ORNLDAAC/2356
- Level 2B greenhouse gas products were developed from these L1B radiance data.
Green, R., A. Thorpe, P. Brodrick, D. Chadwick, A. Lopez, C. Elder, C. Villanueva-Weeks, J. Fahlen, R. Coleman, D. Jensen, H. Bender, Q. Vinckier, C. Xiang, W. Olson-Duvall, S. Lundeen, and D.R. Thompson. 2023. EMIT L2B Methane Enhancement Data 60 m V001. NASA EOSDIS Land Processes Distributed Active Archive Center. https://doi.org/10.5067/EMIT/EMITL2BCH4ENH.001
Data Characteristics
Spatial Resolution: 0.5 to 20 m (altitude dependant)
Temporal Resolution: One-time estimate
Data File Information
This dataset includes greenhouse gas concentrations and related products in cloud optimized GeoTIFF (COG) format, quicklook images, and processing information in text-based YAML format.
The naming convention for the files is <flight prefix>_<id>_<level>_<ver>_<product>.<ext>, where
- <flight prefix> = flight line identifier, AV3YYYMMDDthhmmss, encoding the date and time by year (YYYY), month (MM), day (DD), hour (hh), minute (mm), and second (ss) of the flight (e.g., AV320230711t225833).
- <id> = scene-id from within a flight line.
- <level> = data level: “L2B_GHG” for Level 2B greenhouse gas products.
- <ver> = unique seven character identifier of full heritage versioning.
- <product> = Level 2B data product:
- “CH4_ORT” for methane enhancement, “CH4_ORT_QL” for methane quicklook, “CH4_SNS_ORT” for methane sensitivity, “CH4_UNC_ORT” for methane uncertainty
- CO2_ORT” for carbon dioxide enhancement, “CO2_ORT_QL” for carbon dioxide quicklook, “CO2_SNS_ORT” for carbon dioxide sensitivity, “CO2_UNC_ORT” for carbon dioxide uncertainty. ("ORT" is for orthocorrected.)
- <ext> = file extension indicating file type: “tif” for GeoTIFF, “yaml” for YAML text file.
Example file names for methane products on one flight line are:
- AV320230915t214314_000_L2B_GHG_6395d427_CH4_ORT.tif
- AV320230915t214314_000_L2B_GHG_6395d427_CH4_ORT_QL.tif
- AV320230915t214314_000_L2B_GHG_6395d427_CH4_SNS_ORT.tif
- AV320230915t214314_000_L2B_GHG_6395d427_CH4_UNC_ORT.tif
- AV320230915t214314_000_L2B_GHG_6395d427.yaml
Data File Details
The COG files hold orthocorrected data projected into the UTM coordinate system using WGS-84 datum.
The units for GHG concentrations are “parts per million meter” (total column enhancement, ppm m) representing the path-integrated concentration of the gas. The UNC values are in the same units as the enhancement measurements (ppm m). The SNS values are unitless. UNC and SNS values of -1 indicate location of a gas flare or the buffer region around a flare.
The COG nodata value is -9999.
The quicklook images (*_ORT_QL.tif) are COGs with three bands (RGB) in projected UTM coordinates.
Application and Derivation
The main objective of the AVIRIS project is to identify, measure, and monitor constituents of the Earth's surface and atmosphere based on molecular absorption and particle scattering signatures. Research with AVIRIS data is predominantly focused on understanding processes related to the global environment and climate change.
The Airborne Visible/Infrared Imaging Spectrometer 3 (AVIRIS-3) is the third of the NASA AVIRIS spectrometer series and was developed in parallel with the Compact Wide-swath Imaging Spectrometer II (CWIS-II) for the University of Zurich, Switzerland. The core spectrometer of AVIRIS-3 is a copy of the imaging spectrometer used by the Earth Surface Mineral Dust Source Investigation (EMIT) that has been deployed on the International Space Station (ISS). AVIRIS-Classic and AVIRIS-Next Generation are the two previously developed instruments (Green et al., 1998).
AVIRIS-3 provides state-of-the-art imaging spectroscopy measurements for NASA science and application through the next decade and beyond. It collects data that can be used for characterization of the Earth's surface and atmosphere from geometrically coherent spectroradiometric measurements. This data can be applied to studies in the fields of oceanography, environmental science, snow hydrology, geology, volcanology, soil and land management, atmospheric and aerosol studies, agriculture, and limnology. Applications under development include the assessment and monitoring of environmental hazards such as toxic waste, oil spills, and land/air/water pollution. With proper calibration and correction for atmospheric effects, the measurements can be converted to ground reflectance data which can then be used for quantitative characterization of surface features.
AVIRIS-3’s capabilities for measuring GHG emissions builds on history of GHG measurements from AVIRIS-Classic (Bradley et al., 2011; Thompson et al., 2015) and AVIRIS-NG ((Thorpe et al., 2013a, 2013b; Zhang et al., 2017) .
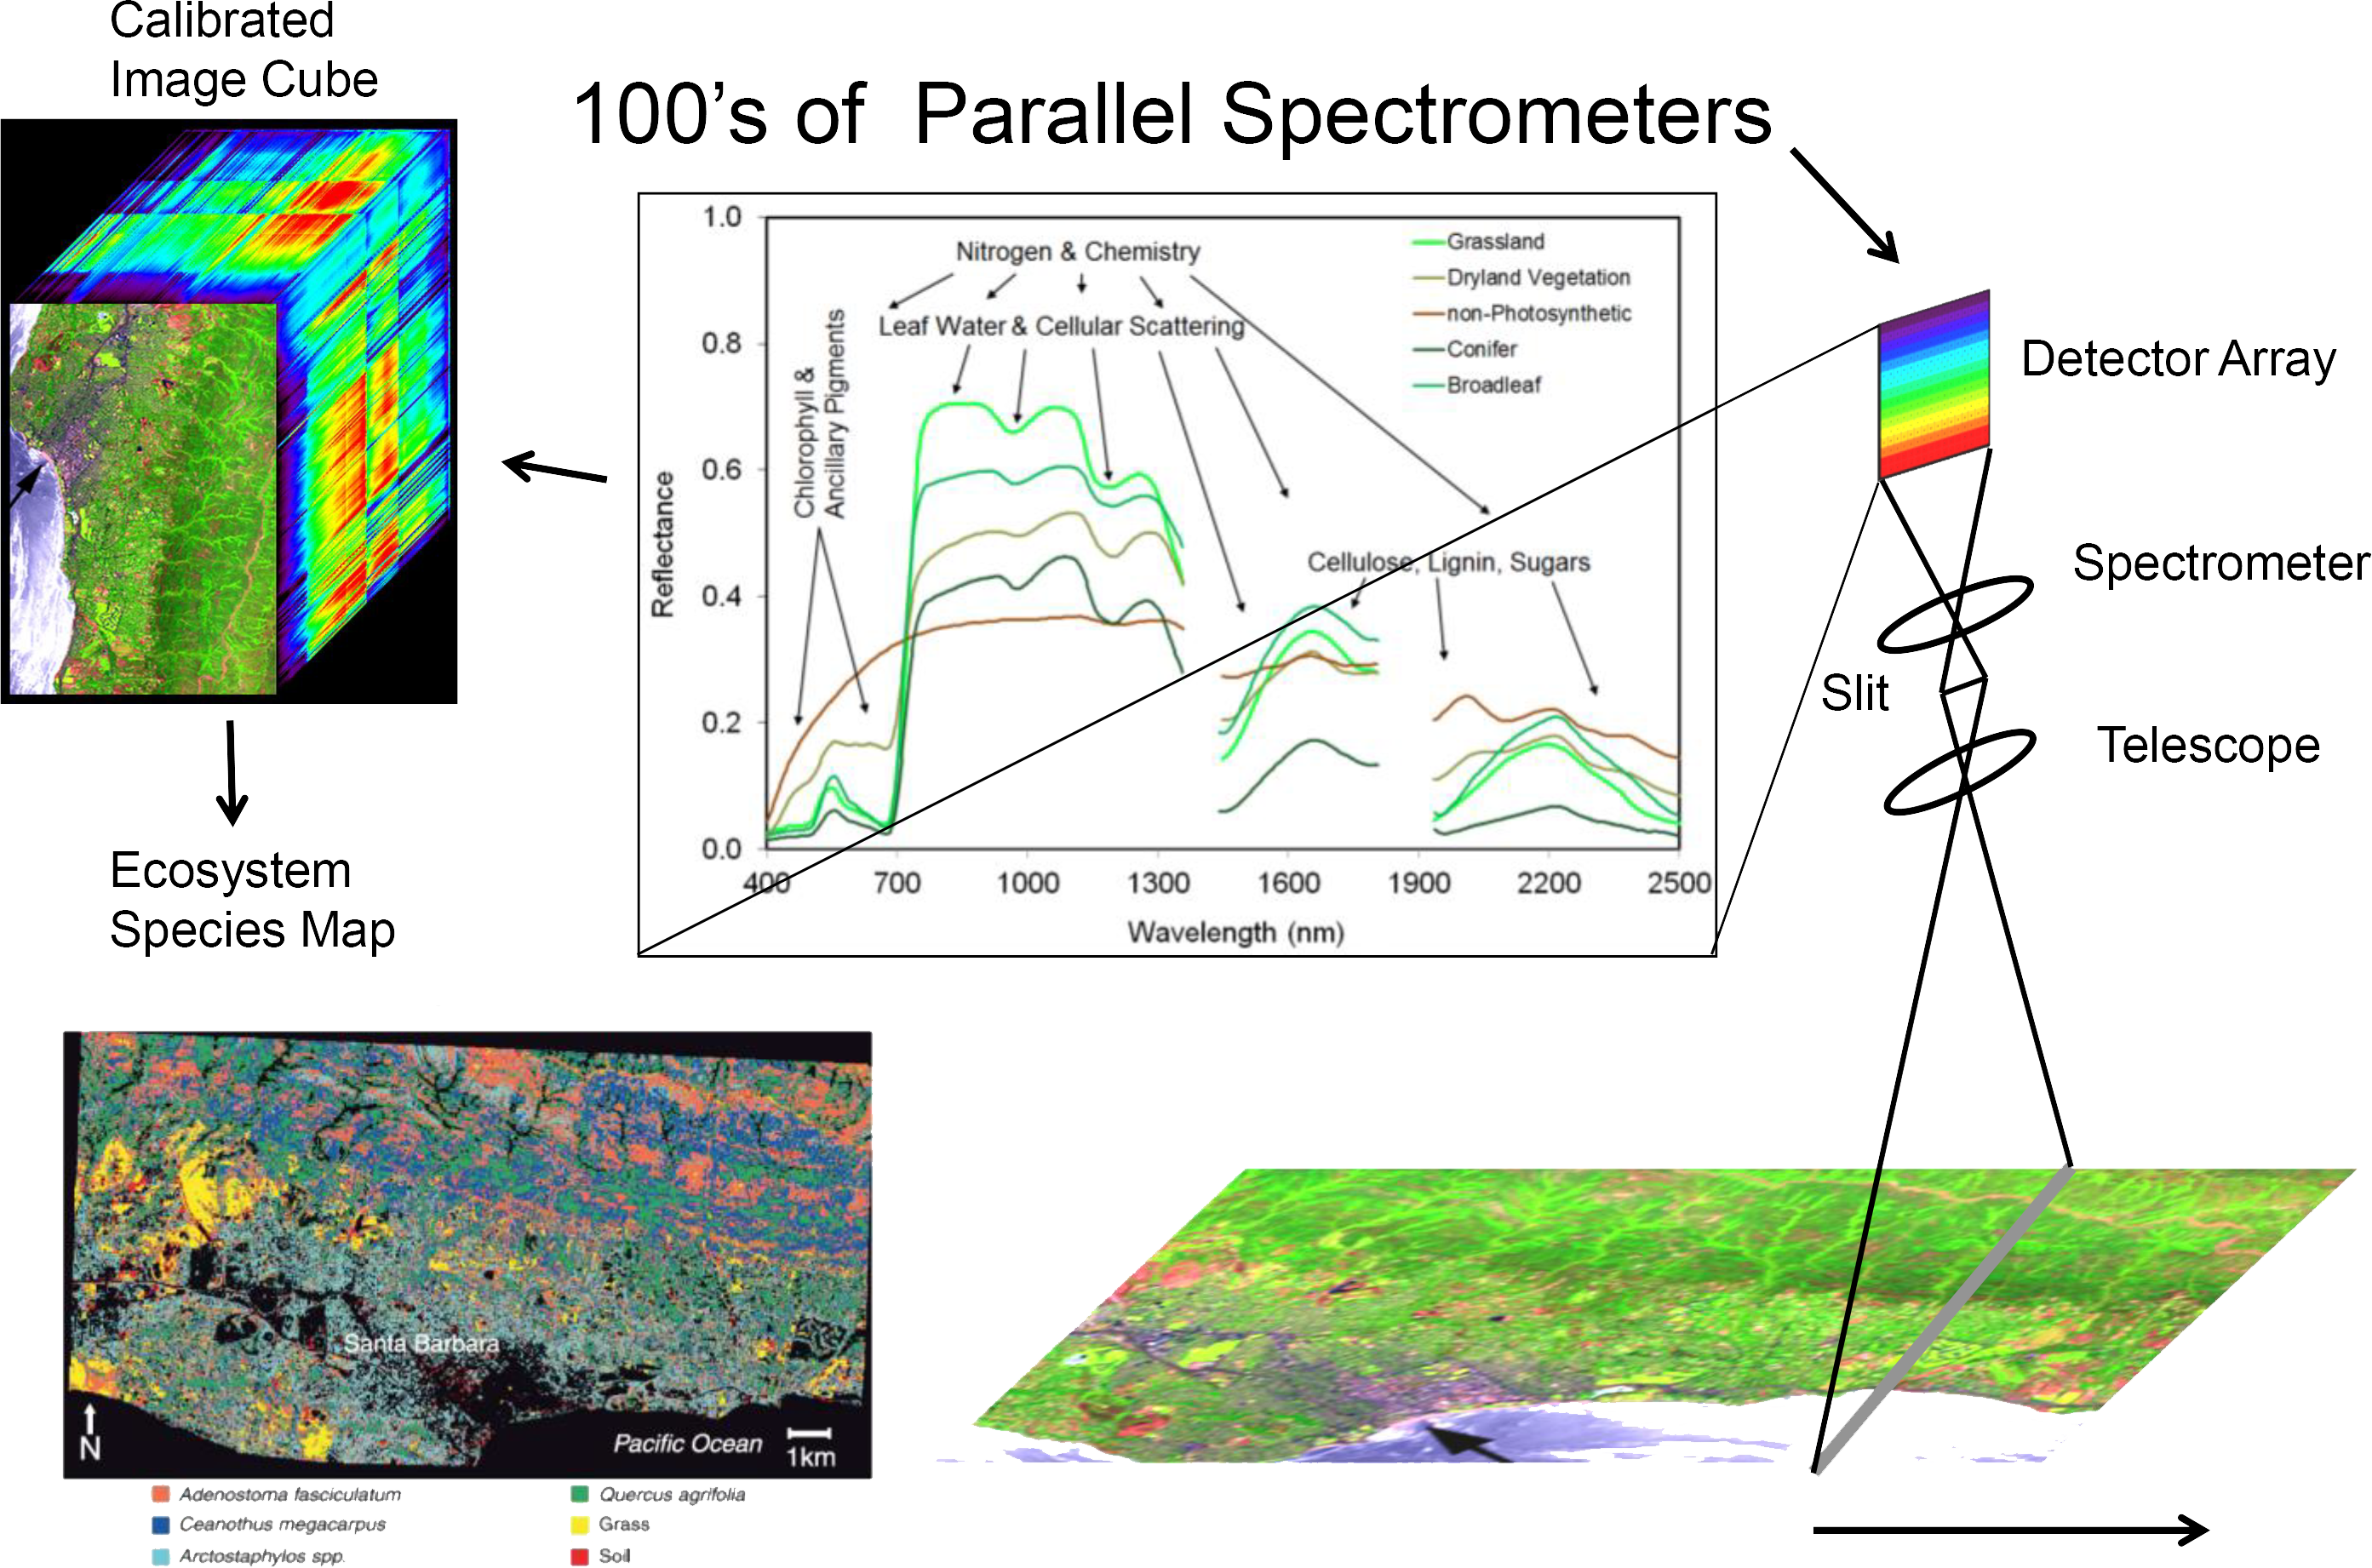
Figure 2. Overview of AVIRIS applications. Source: https://avirisng.jpl.nasa.gov/aviris-ng.html
Quality Assessment
The AVIRIS-3 calibration procedure addresses electronic effects involving radiometric responses of each detector, optical effects involving the spatial and spectral view of each detector, and radiometric calibration. Detector responsiveness is measured at the beginning of each deployment and mid-flight for particularly long deployments. Instrument artifacts in the spectrometer data, such as striping, are removed statistically by minimizing a Markov Random Field model. Likewise, bad pixels are identified and corrected using statistical methods followed by laboratory and field protocols to evaluate effectiveness. The AVIRIS-3 calibration procedure generally follows that for EMIT, described in detail in Thompson et al. (2024).
The methane enhancement data contains elevated values over true methane sources, but also contains false positives induced by various surface or atmospheric characteristics. While the resolution and high signal-to-noise ratio of AVIRIS-3 makes these false positives easier to identify than with other instruments, care must still be taken to exclude such detections from subsequent analyses, particularly in the context of source attribution.
Uncertainty and sensitivity metrics for methane enhancement are included in this dataset.
Data Acquisition, Materials, and Methods
The Airborne Visible-Infrared Imaging Spectrometer 3 (AVIRIS-3) was developed to provide state-of-the-art imaging spectroscopy measurements for NASA science and application through the next decade and beyond (Green et al., 2022). It is deployed on airborne platforms including NASA’s B-200, Gulfstream III, Gulfstream V and potentially other aircraft. The sensor is a copy of an optically fast, F/1.8 Dyson imaging spectrometer used by the Earth Surface Mineral Dust Source Investigation (EMIT) instrument that has been deployed in orbit on the International Space Station (ISS).
AVIRIS-3 measures surface and atmospheric radiances in the wavelength range from 390 nm to 2500 nm with 7.4-nm sampling. Spectra are measured as images with 1234 cross-track elements and spatial sampling from 0.3 m to 10.0 m, depending on sensor-to-surface distance. It is a cryogenic instrument with advanced system control and real-time onboard spectroscopic data processing algorithms evolved from AVIRIS-NG. The radiometric range is from 0 to max terrestrial Lambertian radiance with higher signal-to-noise ratio performance than AVIRIS-Classic or AVIRIS-Next Generation. The spatial field-of-view is 39.5 degrees with 0.56 milliradian sampling (Green et al., 2022).
This Level 2B collection contains concentrations of greenhouse gasses (GHG) derived from imagery collected by the Airborne Visible / Infrared Imaging Spectrometer-3 (AVIRIS-3) instrument. Products include enhancement data and plume complexes for each GHG. Concentrations were estimated from radiance measurements enhanced using a cluster matched filter approach (Thorpe et al., 2013b), which searches each pixel’s radiance spectrum for deviations that are characteristic of a GHG’s absorption spectrum (Brodrick et al., 2024). Plume complexes were identified from the enhanced data and were subject to a manual review process.
Uncertainty was due to measurement noise, while sensitivity accounts for potential bias in the concentration length due to surface and atmospheric variation. Calculation of these values is described in Fahlen et al. (2024). Uncertainty and sensitivity vary per-pixel, and between scenes.
The EMIT GHG ATBD (Brodrick et al., 2024) provides additional information about methods used for these products.
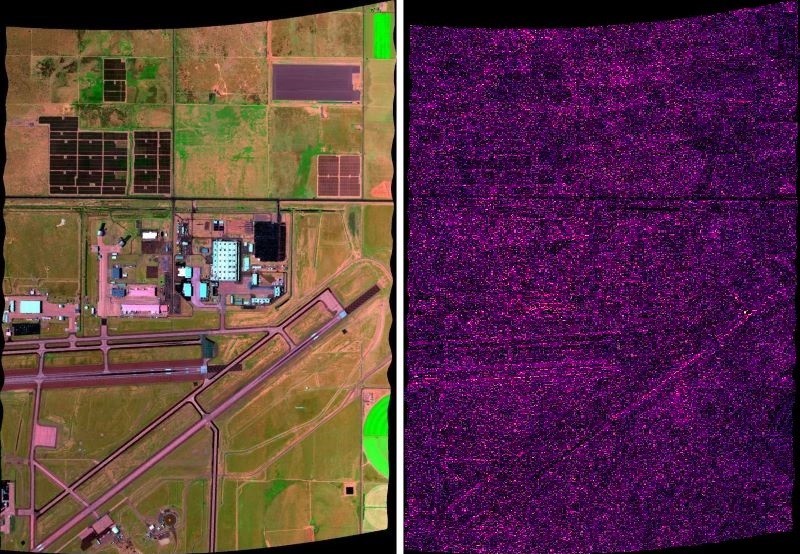
Figure 2. False color image from orthocorrected surface reflectance (left) and methane enhancement from radiance (right) derived from AVIRIS-3 data acquired on 2023-07-11 over Palmdale, California (approximately 34.642 latitude, -118.064 longitude). Flight AV320230711t225833.
Data Access
These data are available through the Oak Ridge National Laboratory (ORNL) Distributed Active Archive Center (DAAC).
AVIRIS-3 L2B Greenhouse Gas Enhancements, Facility Instrument Collection
Contact for Data Center Access Information:
- E-mail: uso@daac.ornl.gov
- Telephone: +1 (865) 241-3952
References
Bradley, E.S., I. Leifer, D.A. Roberts, P.E. Dennison, and L. Washburn. 2011. Detection of marine methane emissions with AVIRIS band ratios. Geophysical Research Letters 38:L10702. https://doi.org/10.1029/2011GL046729
Brodrick, P.G., A.K. Thorpe, C.S. Villanueva-Weeks, C. Elder, J. Fahlen, and D.R. Thompson. 2024. EMIT Greenhouse Gas Algorithms: greenhouse gas point source mapping and related products. Theoretical Basis. Version 0.1. Jet Propulsion Laboratory, California Institute of Technology; Pasadena, California. https://lpdaac.usgs.gov/documents/1696/EMIT_GHG_ATBD_V1.pdf
Chapman, J.W., D.R. Thompson, M.C. Helmlinger, B.D. Bue, R.O. Green, M.L. Eastwood, S. Geier, W. Olson-Duvall, and S.R. Lundeen. 2019. Spectral and radiometric calibration of the Next Generation Airborne Visible Infrared Spectrometer (AVIRIS-NG). Remote Sensing 11:2129. https://doi.org/10.3390/rs11182129
Eckert, R., D.R. Thompson, A.M. Chlus, J.W. Chapman, M. Eastwood, M. Bernas, S. Geier, M. Helmlinger, D. Keymeulen, E. Liggett, S. Nadgauda, L. Rios, L. Shaw, W. Olson-Duvall, P.G. Brodrick, and R.O. Green. 2024. AVIRIS-3 L1B Calibrated Radiance, Facility Instrument Collection. ORNL DAAC, Oak Ridge, Tennessee, USA. https://doi.org/10.3334/ORNLDAAC/2356
Fahlen, J.E., P.G. Brodrick, R.W. Coleman, C.D. Elder, D.R. Thompson, A.K. Thorpe, R.O. Green, J.J. Green, A.M. Lopez, and C. Xiang. 2024. Sensitivity and uncertainty in matched-filter-based gas detection with imaging spectroscopy. IEEE Transactions on Geoscience and Remote Sensing 62:1-10. https://doi.org/10.1109/TGRS.2024.3440174
Green, R.O., M.E. Schaepman, P. Mouroulis, S. Geier, L. Shaw, A. Hueini, M. Bernas, I. McKinley, C. Smith, R. Wehbe, M. Eastwood, Q. Vinckier, E. Liggett, S. Zandbergen, D. Thompson, P. Sullivan, C. Sarture, B. Van Gorp, and M. Helmlinger. 2022. Airborne Visible/Infrared Imaging Spectrometer 3 (AVIRIS-3). 2022 IEEE Aerospace Conference (AERO). https://doi.org/10.1109/AERO53065.2022.9843565
Green, R.O., M.L. Eastwood, C.M. Sarture, T. G. Chrien, M. Aronsson, B.J. Chippendale, J.A. Faust, B.E. Pavri, C. J. Chovit, M. Solis, M.R. Olah, and O. Williams. 1998. Imaging spectroscopy and the Airborne Visible/Infrared Imaging Spectrometer (AVIRIS). Remote Sensing of Environment 65:227- 248. https://doi.org/10.1016/S0034-4257(98)00064-9
Thompson, D.R, P.G. Brodrick, R.O. Green, O. Kalashnikova, S. Lundeen, G. Okin, W. Olson-Duvall, and T. Painter. 2020. EMIT L2A Algorithm: Surface Reflectance and Scene Content Masks: Theoretical Basis. Version 1.0. Jet Propulsion Laboratory, California Institute of Technology; Pasadena, California. https://earth.jpl.nasa.gov/emit/internal_resources/281
Thompson, D.R., R.O. Green, C. Bradley, P.G. Brodrick, N. Mahowald, E.B. Dor, M. Bennett, M. Bernas, N. Carmon, K.D. Chadwick, R.N. Clark, R.W. Coleman, E. Cox, E. Diaz, M.L. Eastwood, R. Eckert, B.L. Ehlmann, P. Ginoux, M.G. Ageitos, K. Grant, L. Guanter, D.H. Pearlshtien, M. Helmlinger, H. Herzog, T. Hoefen, Y. Huang, A. Keebler, O. Kalashnikova, D. Keymeulen, R. Kokaly, M. Klose, L. Li, S.R. Lundeen, J. Meyer, E. Middleton, R.L. Miller, P. Mouroulis, B. Oaida, V. Obiso, F. Ochoa, W. Olson-Duvall, G.S. Okin, T.H. Painter, C. Pérez García-Pando, R. Pollock, V. Realmuto, L. Shaw, P. Sullivan, G. Swayze, E. Thingvold, A.K. Thorpe, S. Vannan, C. Villarreal, C. Ung, D.W. Wilson, and S. Zandbergen. 2024. On-orbit calibration and performance of the EMIT imaging spectrometer. Remote Sensing of Environment 303:113986. https://doi.org/10.1016/j.rse.2023.113986
Thompson, D.R., I. Leifer, H. Bovensmann, M. Eastwood, M. Fladeland, C. Frankenberg, K. Gerilowski, R.O. Green, S. Kratwurst, T. Krings, B. Luna, and A.K. Thorpe. 2015. Real-time remote detection and measurement for airborne imaging spectroscopy: a case study with methane. Atmospheric Measurement Techniques 8:4383-4397. https://doi.org/10.5194/amt-8-4383-2015
Thorpe, A.K., C. Frankenberg, and D. A. Roberts. 2013a. Retrieval techniques for airborne imaging of methane concentrations using high spatial and moderate spectral resolution: application to AVIRIS. Atmospheric Measurement Techniques: Discussions 6:8543-8588. https://doi.org/ 10.5194/amtd-6-8543-2013
Thorpe, A.K., D.A. Roberts, E.S. Bradley, C.C. Funk, P.E. Dennison, and I. Leifer. 2013b. High resolution mapping of methane emissions from marine and terrestrial sources using a Cluster-Tuned Matched Filter technique and imaging spectrometry. Remote Sensing of Environment 134:305-318. https://doi.org/10.1016/j.rse.2013.03.018
Zhang, M., I. Leifer, and C. Hu. 2017. Challenges in methane column retrievals from AVIRIS-NG Imagery over spectrally cluttered surfaces: A sensitivity analysis. Remote Sensing 9:835. https://doi.org/10.3390/rs9080835