Documentation Revision Date: 2024-09-13
Dataset Version: 1
Summary
Additional AVIRIS-3 facility instrument L1B calibrated radiance data will be added as they become available. AVIRIS-3 supports NASA Science and applications in many areas including plant composition and function, geology and soils, wetlands and aquatic ecosystems, greenhouse gas mapping, and calibration of orbital platforms.
NASA facility instruments operate out of a NASA research center and support multiple science disciplines, field investigations, and NASA science objectives. Facility instruments are supported by managers in the Earth Science Division (ESD) Research and Analysis Program, and/or the Earth Observation System (EOS) Project Science Office. The AVIRIS-3 project operates under the Earth Science Airborne Program of the Jet Propulsion Laboratory. In addition to operating and maintaining the sensor, the AVIRIS-3 project works to ensure that experiment requirements are met for each flight and that users are satisfied with data quality and the level of service provided.
This dataset will include all L1B files from the AVIRIS-3 facility instrument.
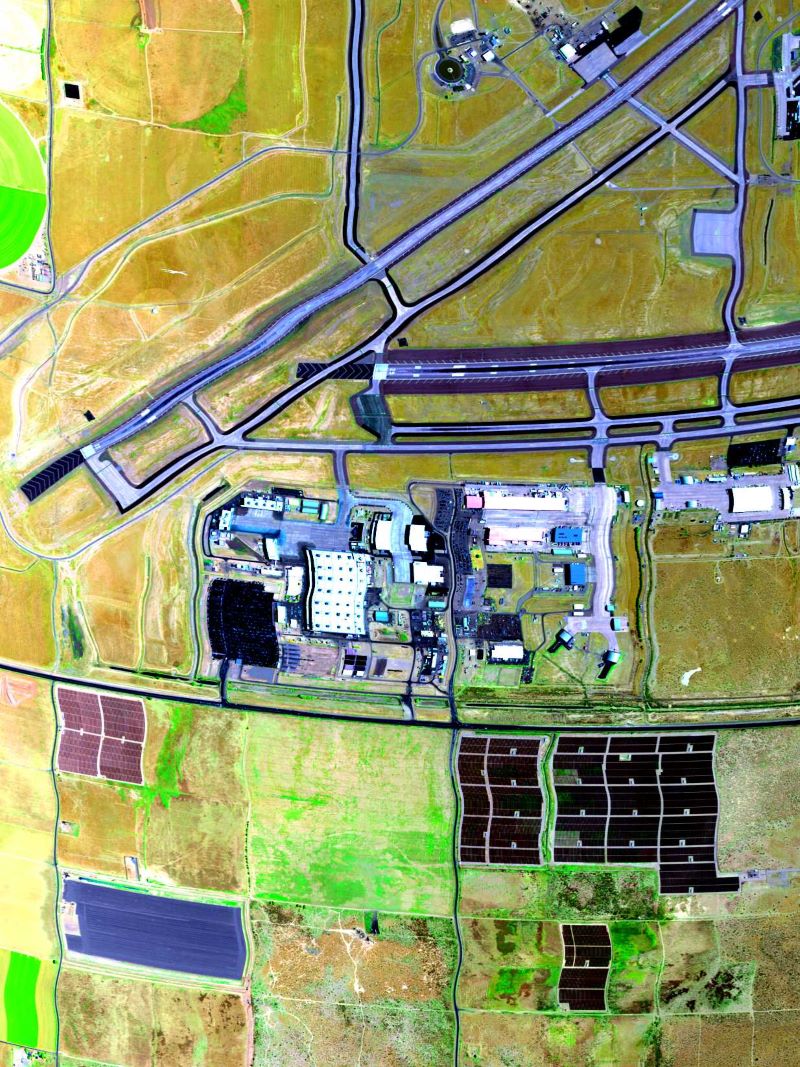
Figure 1. False color image derived from AVIRIS-3 radiance data (R: 1660 nm, G: 850 nm, B: 560 nm) on 2023-07-11 over Palmdale, California (approximately 34.642 latitude, -118.064 longitude); flight AV320230711t225833.
Citation
Eckert, R., D.R. Thompson, A.M. Chlus, J.W. Chapman, M. Eastwood, M. Bernas, S. Geier, M. Helmlinger, D. Keymeulen, E. Liggett, S. Nadgauda, L.M. Rios, L.A. Shaw, W. Olson-Duvall, P.G. Brodrick, and R.O. Green. 2024. AVIRIS-3 L1B Calibrated Radiance, Facility Instrument Collection. ORNL DAAC, Oak Ridge, Tennessee, USA. https://doi.org/10.3334/ORNLDAAC/2356
Table of Contents
- Dataset Overview
- Data Characteristics
- Application and Derivation
- Quality Assessment
- Data Acquisition, Materials, and Methods
- Data Access
- References
Dataset Overview
This dataset contains Level 1B (L1B) calibrated radiance images as well as observational geometry and illumination parameters from the Airborne Visible / Infrared Imaging Spectrometer-3 (AVIRIS-3) instrument. This is the NASA Earth Observing System Data and Information System (EOSDIS) facility instrument archive of these data. The NASA AVIRIS-3 is a spectral mapping system that measures reflected radiance at 7.4-nm intervals in the Visible to Shortwave Infrared (VSWIR) spectral range from 390-2500 nm. The AVIRIS-3 sensor has a 40 degree instantaneous field of view with 1234 pixels, providing altitude dependent ground sampling distances from 12 m to sub meter range. This spectrometer measures radiance from surface and atmosphere and is extremely similar in design to the orbital Earth Surface Mineral Dust Source Investigation (EMIT) spectrometer. AVIRIS-3 has been designed to fly on a variety of aircraft platforms including the King Air B-200, Gulfstream III, Gulfstream V, and ER-2. For each flight line, two file types are included: calibrated radiance (RDN) and orthocorrected observation geometry and illumination (ORT) in netCDF format. Both file types include a geolocation lookup table (GLT) for georeferencing pixels in UTM and geographic coordinates. A band mask file indicates whether wavelengths were interpolated on a per pixel basis. In addition, ancillary files for each flight line are provided, including a quick look image in GeoTIFF format and text files in YAML format that document processing algorithms and parameters used during production.
NASA facility instruments operate out of a NASA research center and support multiple science disciplines, field investigations, and NASA science objectives. Facility instruments are supported by managers in the Earth Science Division (ESD) Research and Analysis Program, and/or the Earth Observation System (EOS) Project Science Office. The AVIRIS-3 project operates under the Earth Science Airborne Program of the Jet Propulsion Laboratory. In addition to operating and maintaining the sensor, the AVIRIS-3 project works to ensure that experiment requirements are met for each flight and that users are satisfied with data quality and the level of service provided.
This dataset will include all L1B files from the AVIRIS-3 facility instrument.
Project: AVIRIS
The Airborne Visible InfraRed Imaging Spectrometer - Classic (AVIRIS-C), Next Generation (AVIRIS-NG), and 3rd Generation (AVIRIS-3) are three Facility Instruments (FIs) that are part of NASA’s Airborne Science Program (ASP) and the Jet Propulsion Laboratory’s (JPL) Earth Science Airborne Program. The AVIRIS-C is an imaging spectrometer that delivers calibrated images of the upwelling spectral radiance in 224 contiguous spectral channels with wavelengths from 400 to 2500 nanometers (nm). The AVIRIS-NG is the successor to AVIRIS-Classic and provides high signal-to-noise ratio imaging spectroscopy measurements in 425 contiguous spectral channels with wavelengths in the solar reflected spectral range (380-2510 nm) with 5 nm sampling. The AVIRIS-NG started operation in 2014 and is expected to replace the AVIRIS-C instrument. The AVIRIS-3 is the third of the AVIRIS spectrometer FI series and has higher signal-to-noise ratio performance than AVIRIS-C or AVIRIS-NG. The core spectrometer of AVIRIS-3 is an optically fast, F/1.8 Dyson imaging spectrometer spanning a wide width (39.5-degree field of view). The AVIRIS-3 provides measurements in 285 contiguous spectral channels with wavelengths in the solar reflected spectral range (390-2500 nm) with 7.4 nm sampling. The AVIRIS-3 started operation in 2023. Data from AVIRIS-C, AVIRIS-NG, and AVIRIS-3 are applicable to a wide range of studies in the fields of terrestrial and coastal aquatic plant physiology, atmospheric and aerosol studies, environmental science, snow hydrology, geology, volcanology, oceanography, soil and land management, agriculture, and limnology.
Related Publications
Green, R.O., M.E. Schaepman, P. Mouroulis, S. Geier, L. Shaw, A. Hueini, M. Bernas, I. McKinley, C. Smith, R. Wehbe, M. Eastwood, Q. Vinckier, E. Liggett, S. Zandbergen, D. Thompson, P. Sullivan, C. Sarture, B. Van Gorp, and M. Helmlinger. 2022. Airborne Visible/Infrared Imaging Spectrometer 3 (AVIRIS-3). 2022 IEEE Aerospace Conference (AERO). https://doi.org/10.1109/AERO53065.2022.9843565
Chapman, J.W., D.R. Thompson, M.C. Helmlinger, B.D. Bue, R.O. Green, M.L. Eastwood, S. Geier, W. Olson-Duvall, and S.R. Lundeen. 2019. Spectral and radiometric calibration of the Next Generation Airborne Visible Infrared Spectrometer (AVIRIS-NG). Remote Sensing 11: 2129. https://doi.org/10.3390/rs11182129
Thompson, D. R., R. O. Green, C. Bradley, P. G. Brodrick, N. Mahowald, E. B. Dor, M. Bennett, M. Bernas, N. Carmon, K. D. Chadwick, R. N. Clark, R. W. Coleman, E. Cox, E. Diaz, M. L. Eastwood, R. Eckert, B. L. Ehlmann, P. Ginoux, M. G. Ageitos, K. Grant, L. Guanter, D. H. Pearlshtien, M. Helmlinger, H. Herzog, T. Hoefen, Y. Huang, A. Keebler, O. Kalashnikova, D. Keymeulen, R. Kokaly, M. Klose, L. Li, S. R. Lundeen, J. Meyer, E. Middleton, R. L. Miller, P. Mouroulis, B. Oaida, V. Obiso, F. Ochoa, W. Olson-Duvall, G. S. Okin, T. H. Painter, C. Pérez García-Pando, R. Pollock, V. Realmuto, L. Shaw, P. Sullivan, G. Swayze, E. Thingvold, A. K. Thorpe, S. Vannan, C. Villarreal, C. Ung, D. W. Wilson, and S. Zandbergen. 2024. On-orbit calibration and performance of the EMIT imaging spectrometer. Remote Sensing of Environment 303:113986. https://doi.org/10.1016/j.rse.2023.113986
Related Datasets
Chlus, A.M., P.G. Brodrick, A.K. Thorpe, J.W. Chapman, D.J. Jensen, R.W. Coleman, J. Fahlen, W. Olson-Duvall, D.R. Thompson, and R.O. Green. 2024. AVIRIS-3 L2B Greenhouse Gas Enhancements, Facility Instrument Collection. ORNL DAAC, Oak Ridge, Tennessee, USA. https://doi.org/10.3334/ORNLDAAC/2358
- Level 2B greenhouse gas products derived from these L1B radiance data.
Acknowledgement
Authors R. Eckert and D.R. Thompson contributed equally to this work.
Data Characteristics
Spatial Resolution: 0.5 to 20 m (altitude dependant)
Temporal Resolution: One-time estimate
Data File Information
This dataset includes calibrated radiance and observational parameters in netCDF format, quicklook images as GeoTIFFs, and processing information in text-based YAML format.
The naming convention for the files is <flight prefix>_<id>_<level>_<ver>_<product>.<ext>, where
- <flight prefix> = flight line identifier, AV3YYYMMDDthhmmss, encoding the date and time by year (YYYY), month (MM), day (DD), hour (hh), minute (mm), and second (ss) of the flight (e.g., AV320230711t225833).
- <id> = scene-id from within a flight line
- <level> = data level: “L1B” for Level 1B. "ORT" for orthocorrected. "RDN" for radiance.
- <ver> = unique seven character identifier of full heritage versioning.
- <product> = Level 1B data product: “RDN'' for radiance, “OBS'' for orthocorrected observational parameters, “RDN_QL” for quicklook image, "BANDMASK" for denoting interpolated wavelengths.
- <ext> = file extension indicating file type: “nc” for netCDF, “tif” for GeoTIFF, “yaml” for YAML text file.
Example file names for scene 001 from the flight line AV320230915t214314 are:
- AV320230915t214314_001_L1B_ORT_b3fdac1b.yaml
- AV320230915t214314_001_L1B_ORT_b3fdac1b_OBS.nc
- AV320230915t214314_001_L1B_RDN_fcf6e2d2_RDN.nc
- AV320230915t214314_001_L1B_RDN_fcf6e2d2_RDN_QL.tif
- AV320230915t214314_001_L1B_RDN_fcf6e2d2_BANDMASK.nc
- AV320230915t214314_001_L1B_RDN_fcf6e2d2.yaml
The radiance (RDN) files hold calibrated radiance in raw spatial format (not orthocorrected). However, both the RDN and ORT files include the geometric lookup table (GLT), which provides a georeferenced location for each pixel in the raw image (Table 3). The GLT is an orthocorrected product with a fixed pixel size projected into a UTM coordinate system that contains the information about which original pixel occupies which output pixel in the final product. Orthocorrected pixels are referenced back to the raw image by the line and sample variables. The line and sample values are sign-coded to indicate if it is a real measurement (indicated by a positive value) or a nearest-neighbor infill (indicated by negative values).
The band mask (BANDMASK) files indicate for each pixel whether a given wavelength was interpolated. Interpolation occurred due to a bad pixel in the focal plane array or from saturation. The per pixel data is provided as a bit-packed unsigned integer array with dimensions of lines x samples, organized across 36 layers. There is one value per pixel for each of 284 wavelengths, ordered from shortest to longest wavelength. Each layer holds the mask values for eight wavelengths, except that the last layer (36) holds mask values for the seven longest wavelengths. For each pixel in a given layer, the bit-packed value is an unsigned integer, ranging 0 to 255, that indicates which of eight wavelengths were interpolated. The integer value represents a boolean vector of eight bits (Table 4); each bit corresponds to a wavelength. An integer value of 0 (also the nodata value) indicates that no wavelengths were interpolated. The value of 1 indicates that the first wavelength was interpolated and the remaining seven were not. A 3 indicates that only the first and second wavelengths were interpolated. See Table 4 for more examples.
Table 1. Variables in Level 1B calibrated radiance (RDN) netCDF files.
| Variable | Description | Units |
|---|---|---|
| radiance | Calibrated radiances in 284 bands covering wavelengths between 390 nm to 2500 nm in approximately 7.4-nm intervals. Image cube dimensions = lines x samples x 284 bands | uW nm-1 cm-2 sr-1 |
| wavelength | Center wavelength for each spectral band (n = 284) | nm |
| fwhm | Full width at half maximum for band (n = 284) | nm |
Table 2. Variables in Level 1B observational parameters (ORT) netCDF files. These parameters are in the raw spatial format matching the corresponding unorthocorrected radiance image. Pixels are referenced by the line and sample variables. Use the geometric lookup table to find the georeferenced location for each pixel.
| Variable | Description | Units |
|---|---|---|
| path_length | Sensor-to-ground distance | m |
| to_sensor_azimuth | Sensor azimuth angle; 0 to 360 degrees clockwise from north | degrees |
| to_sensor_zenith | Sensor zenith angle; 0 to 90 degrees from zenith | degrees |
| to_sun_azimuth | Solar azimuth angle; 0 to 360 degrees clockwise from north | degrees |
| to_sun_zenith | Solar zenith angle; 0 to 360 degrees clockwise from north | degrees |
| solar_phase | Solar phase; degrees between to-sensor and to-sun vectors in principal plane | degrees |
| slope | Local surface slope as derived from DEM in degrees | degrees |
| aspect | Local surface aspect 0 to 360 degrees clockwise from N | degrees |
| cosine_i | Apparent local illumination factor based on DEM slope and aspect and to sun vector; range -1.0 to 1.0 | 1 |
| utc_time | Decimal hours since 2023-07-11 00:00:00Z for mid-line pixels | h |
| earth_sun_distance | Earth-to-sun distance in astronomical units | au |
Table 3. Geolocation variables in both radiance (RDN) and observational parameters (ORT) netCDF files. Coordinates use the WGS 84 ellipsoid.
| Variable | Description | Units |
|---|---|---|
| easting | UTM easting coordinate for center of grid cell for orthocorrected pixel location | m |
| northing | UTM northing coordinate for center of grid cell for orthocorrected pixel location | m |
| transverse_mercator | Details about the projected UTM coordinate system in well-known text (WKT) format. | - |
| lon | Longitude for center of grid cell; EPSG 4326 | degrees east |
| lat | Latitude for center of grid cell; EPSG 4326 | degrees north |
| elev | Elevation for center of grid cell in height above mean sea level (surface elevation) | m |
| line | Pixel identifier in the along-track (flight path) direction, indicating the row location of a pixel from the uncorrected sensor image within the orthocorrected grid. | 1 |
| sample | Pixel identifier in the across-track direction, indicating the column location of a pixel from the uncorrected sensor image within the orthocorrected grid. | 1 |
Table 4. Bit-packing scheme employed in band mask (BANDMASK) files that uses integer values to indicate which of eight wavelengths were interpolated. Potential values range from 0 to 255. This table provides selected examples and does not illustrate all possible values. “-” = not interpolated.
| Wavelength interpolated | ||||||||
|---|---|---|---|---|---|---|---|---|
| Value | 1 | 2 | 3 | 4 | 5 | 6 | 7 | 8 |
| 0 | - | - | - | - | - | - | - | - |
| 1 | yes | - | - | - | - | - | - | - |
| 2 | - | yes | ||||||
| 3 | yes | yes | - | - | - | - | - | - |
| 4 | - | - | yes | - | - | - | - | - |
| 9 | yes | - | - | yes | - | - | - | - |
| 16 | - | - | - | - | yes | - | - | - |
| 25 | yes | - | - | yes | yes | - | - | - |
| 36 | - | - | yes | - | - | yes | - | - |
| 64 | - | - | - | - | - | - | yes | - |
| 128 | - | - | - | - | - | - | - | yes |
| 239 | yes | yes | yes | yes | - | yes | yes | yes |
| 255 | yes | yes | yes | yes | yes | yes | yes | yes |
Application and Derivation
The main objective of the AVIRIS project is to identify, measure, and monitor constituents of the Earth's surface and atmosphere based on molecular absorption and particle scattering signatures. Research with AVIRIS data is predominantly focused on understanding processes related to the global environment and climate change.
The Airborne Visible/Infrared Imaging Spectrometer 3 (AVIRIS-3) is the third of the NASA AVIRIS spectrometer series and was developed in parallel with the Compact Wide-swath Imaging Spectrometer II (CWIS-II) for the University of Zurich, Switzerland. The core spectrometer of AVIRIS-3 is a copy of the imaging spectrometer used by the Earth Surface Mineral Dust Source Investigation (EMIT) that has been deployed on the International Space Station (ISS). AVIRIS-Classic and AVIRIS-Next Generation are the two previously developed instruments (Green et al., 1998).
AVIRIS-3 provides state-of-the-art imaging spectroscopy measurements for NASA science and application through the next decade and beyond. It collects data that can be used for characterization of the Earth's surface and atmosphere from geometrically coherent spectroradiometric measurements. This data can be applied to studies in the fields of oceanography, environmental science, snow hydrology, geology, volcanology, soil and land management, atmospheric and aerosol studies, agriculture, and limnology. Applications under development include the assessment and monitoring of environmental hazards such as toxic waste, oil spills, and land/air/water pollution. With proper calibration and correction for atmospheric effects, the measurements can be converted to ground reflectance data which can then be used for quantitative characterization of surface features.
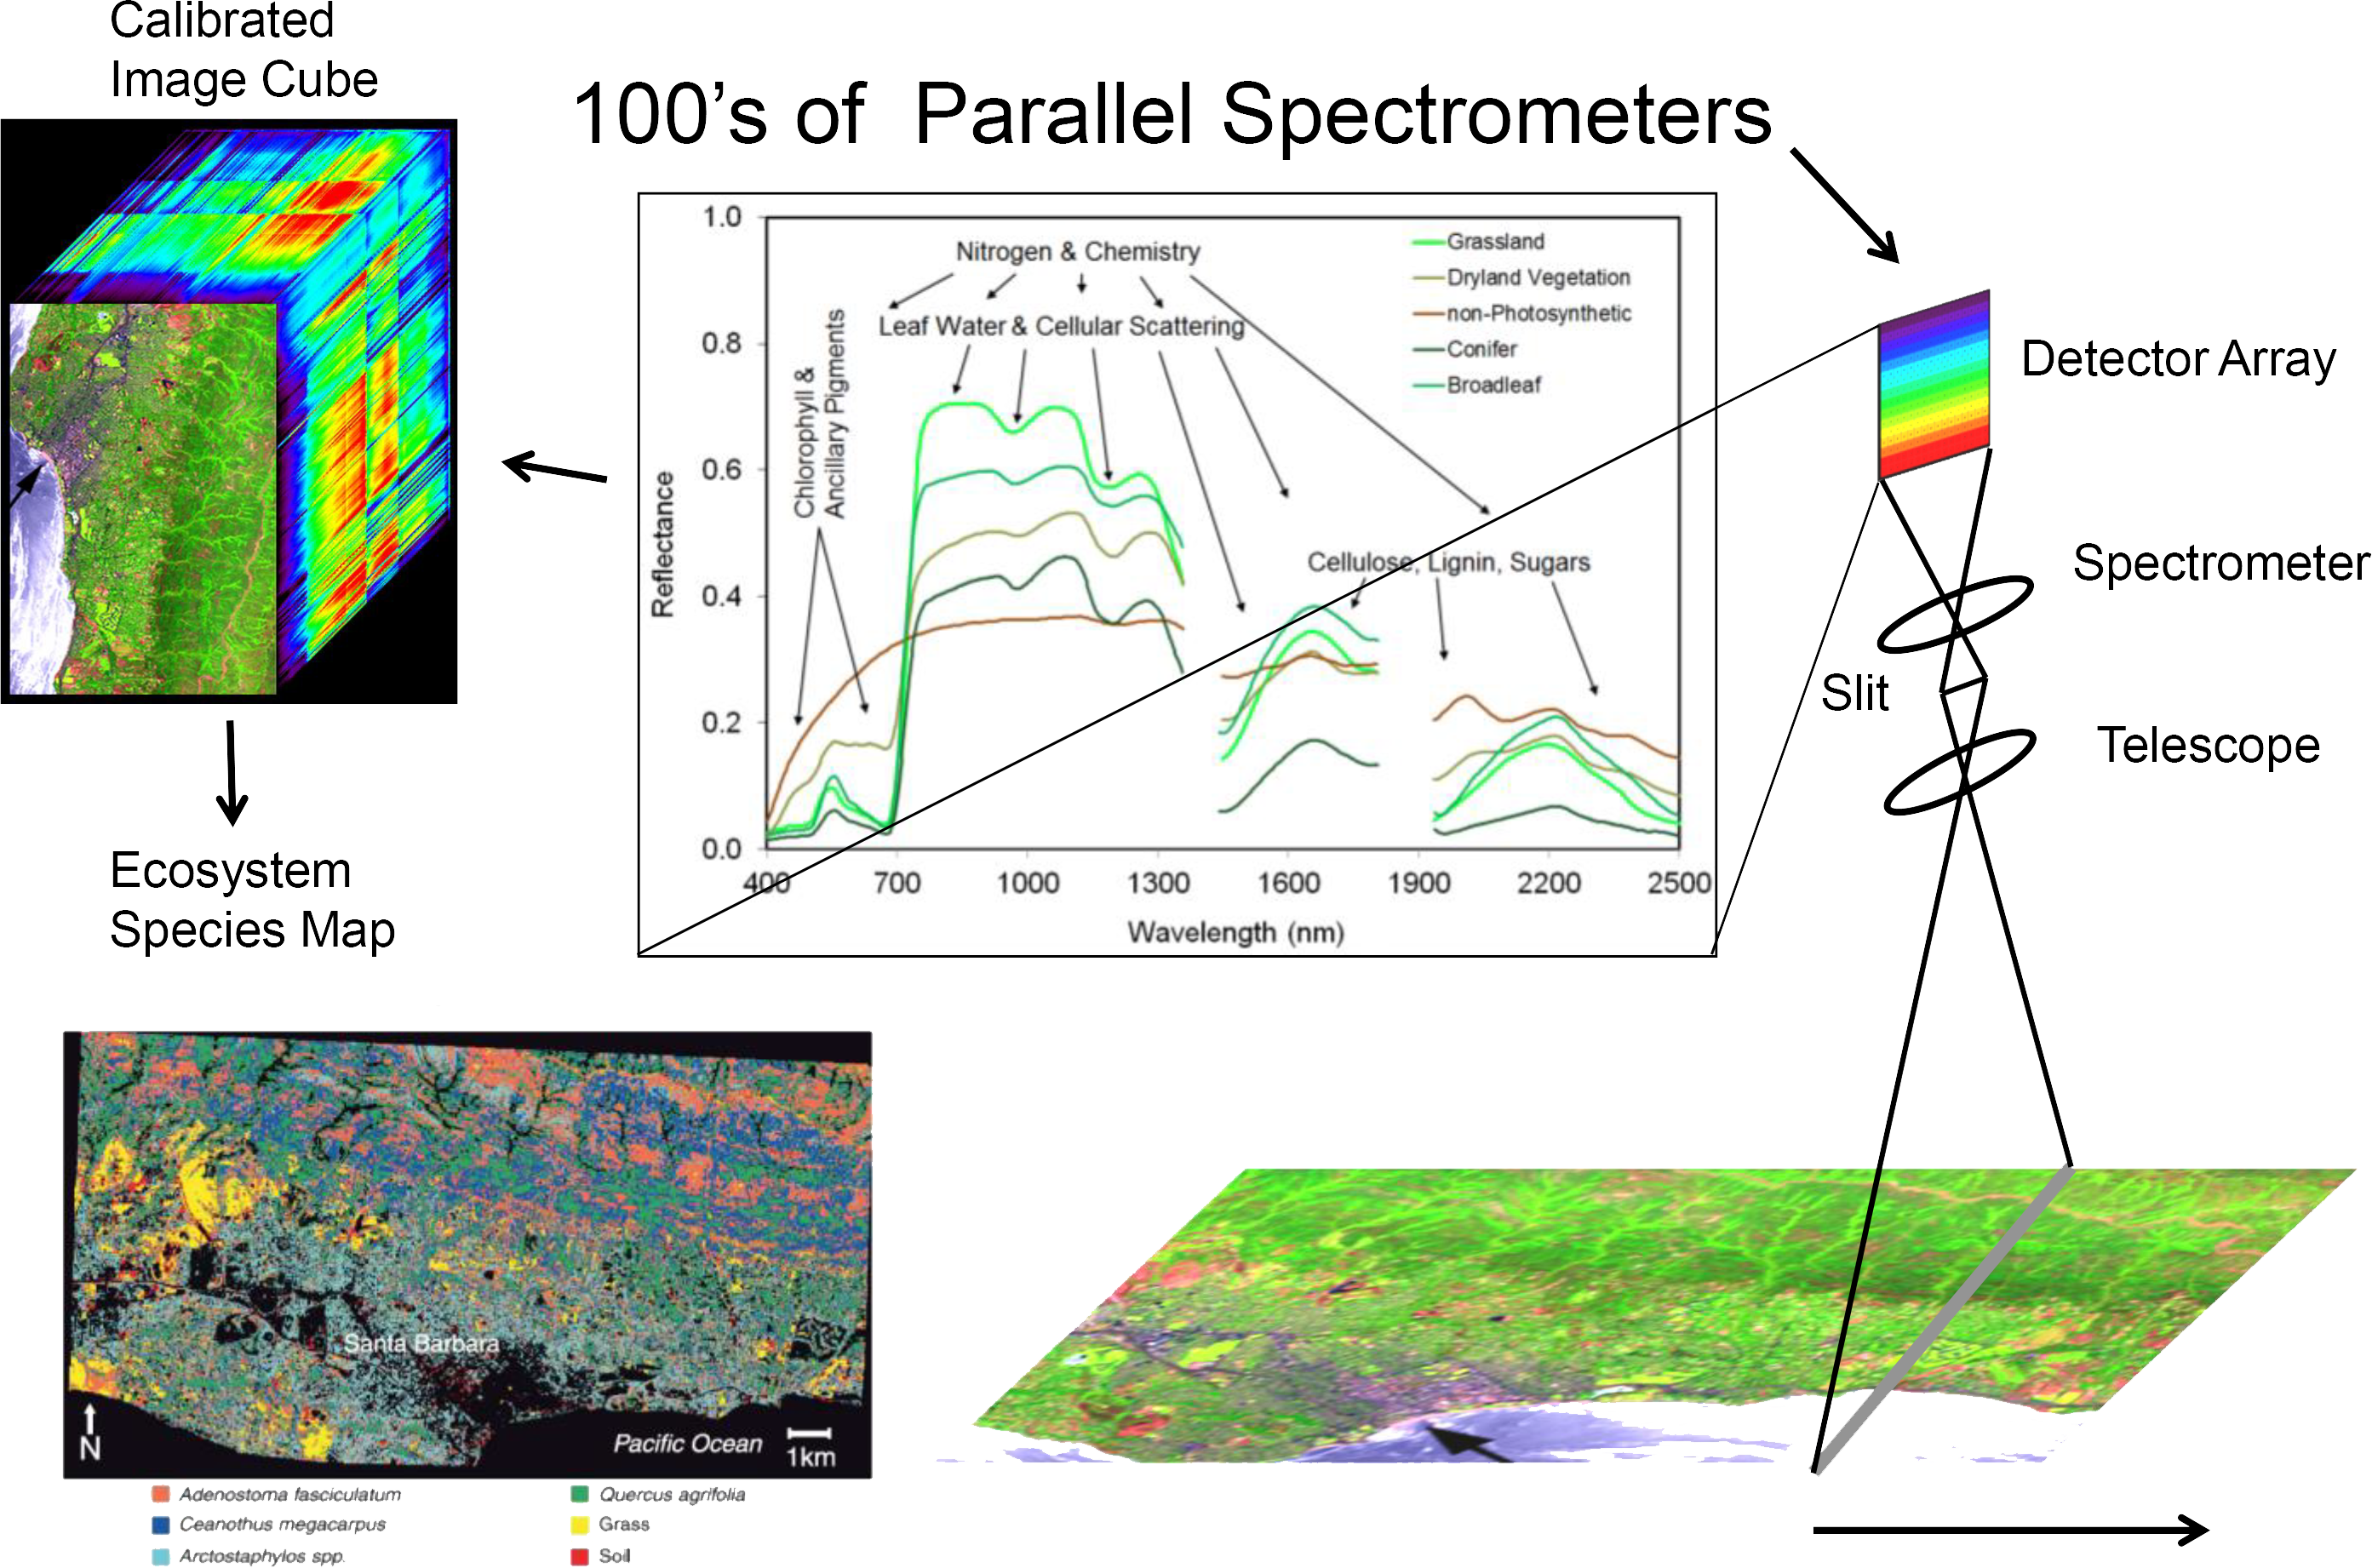
Figure 2. Overview of AVIRIS applications. Source: https://avirisng.jpl.nasa.gov/aviris-ng.html
Quality Assessment
The AVIRIS-3 calibration procedure addresses electronic effects involving radiometric responses of each detector, optical effects involving the spatial and spectral view of each detector, and radiometric calibration. Detector responsiveness is measured at the beginning of each deployment and mid-flight for particularly long deployments. Instrument artifacts in the spectrometer data, such as striping, are removed statistically by minimizing a Markov Random Field model. Likewise, bad pixels are identified and corrected using statistical methods followed by laboratory and field protocols to evaluate effectiveness. Details of calibration methods are available in Chapman et al. (2019).
Data Acquisition, Materials, and Methods
The Airborne Visible-Infrared Imaging Spectrometer 3 (AVIRIS-3) was developed to provide state-of-the-art imaging spectroscopy measurements for NASA science and application through the next decade and beyond (Green et al., 2022). It is deployed on airborne platforms including NASA’s B-200, Gulfstream III, Gulfstream V and potentially other aircraft. The sensor is a copy of an optically fast, F/1.8 Dyson imaging spectrometer used by the Earth Surface Mineral Dust Source Investigation (EMIT) instrument that has been deployed in orbit on the International Space Station (ISS).
AVIRIS-3 measures surface and atmospheric radiances in the wavelength range from 390 nm to 2500 nm with 7.4-nm sampling. Spectra are measured as images with 1234 cross-track elements and spatial sampling from 0.3 m to 10.0 m, depending on sensor-to-surface distance. It is a cryogenic instrument with advanced system control and real-time onboard spectroscopic data processing algorithms evolved from AVIRIS-NG. The radiometric range is from 0 to max terrestrial Lambertian radiance with higher signal-to-noise ratio performance than AVIRIS-Classic or AVIRIS-Next Generation. The spatial field-of-view is 39.5 degrees with 0.56 milliradian sampling (Green et al., 2022).
This Level 1B dataset contains two separate netCDF files: radiance (RDN) and observation parameters (ORT). The radiance file contains calibrated at-sensor radiance measurements in uW nm-1 cm-2 sr-1, while the observational parameters netCDF file contains viewing and solar geometries, timing, topographic, and other information about the observation. Both radiance and observational parameters files contain a geometric lookup table (GLT), a dataset that links relative row and column reference locations (via line and sample variables) with the orthocorrected latitude, longitude and elevation for each pixel. Pixel locations are also provided in projected UTM coordinates. Each image line of the Level 1B data product is also UTC time-tagged. Nodata values are set to -9999.
Data Access
These data are available through the Oak Ridge National Laboratory (ORNL) Distributed Active Archive Center (DAAC).
AVIRIS-3 L1B Calibrated Radiance, Facility Instrument Collection
Contact for Data Center Access Information:
- E-mail: uso@daac.ornl.gov
- Telephone: +1 (865) 241-3952
References
Chapman, J.W., D.R. Thompson, M.C. Helmlinger, B.D. Bue, R.O. Green, M.L. Eastwood, S. Geier, W. Olson-Duvall, and S.R. Lundeen. 2019. Spectral and radiometric calibration of the Next Generation Airborne Visible Infrared Spectrometer (AVIRIS-NG). Remote Sensing 11:2129. https://doi.org/10.3390/rs11182129
Chlus, A.M., P.G. Brodrick, A.K. Thorpe, J.W. Chapman, D.J. Jensen, R.W. Coleman, J. Fahlen, W. Olson-Duvall, D.R. Thompson, and R.O. Green. 2024. AVIRIS-3 L2B Greenhouse Gas Enhancements, Facility Instrument Collection. ORNL DAAC, Oak Ridge, Tennessee, USA. https://doi.org/10.3334/ORNLDAAC/2358
Green, R.O., M.E. Schaepman, P. Mouroulis, S. Geier, L. Shaw, A. Hueini, M. Bernas, I. McKinley, C. Smith, R. Wehbe, M. Eastwood, Q. Vinckier, E. Liggett, S. Zandbergen, D. Thompson, P. Sullivan, C. Sarture, B. Van Gorp, and M. Helmlinger. 2022. Airborne Visible/Infrared Imaging Spectrometer 3 (AVIRIS-3). 2022 IEEE Aerospace Conference (AERO). https://doi.org/10.1109/AERO53065.2022.9843565
Green, R.O., M.L. Eastwood, C.M. Sarture, T. G. Chrien, M. Aronsson, B.J. Chippendale, J.A. Faust, B.E. Pavri, C. J. Chovit, M. Solis, M.R. Olah, and O. Williams. 1998. Imaging spectroscopy and the Airborne Visible/Infrared Imaging Spectrometer (AVIRIS). Remote Sensing of Environment 65:227- 248. https://doi.org/10.1016/S0034-4257(98)00064-9
Thompson, D. R., R. O. Green, C. Bradley, P. G. Brodrick, N. Mahowald, E. B. Dor, M. Bennett, M. Bernas, N. Carmon, K. D. Chadwick, R. N. Clark, R. W. Coleman, E. Cox, E. Diaz, M. L. Eastwood, R. Eckert, B. L. Ehlmann, P. Ginoux, M. G. Ageitos, K. Grant, L. Guanter, D. H. Pearlshtien, M. Helmlinger, H. Herzog, T. Hoefen, Y. Huang, A. Keebler, O. Kalashnikova, D. Keymeulen, R. Kokaly, M. Klose, L. Li, S. R. Lundeen, J. Meyer, E. Middleton, R. L. Miller, P. Mouroulis, B. Oaida, V. Obiso, F. Ochoa, W. Olson-Duvall, G. S. Okin, T. H. Painter, C. Pérez García-Pando, R. Pollock, V. Realmuto, L. Shaw, P. Sullivan, G. Swayze, E. Thingvold, A. K. Thorpe, S. Vannan, C. Villarreal, C. Ung, D. W. Wilson, and S. Zandbergen. 2024. On-orbit calibration and performance of the EMIT imaging spectrometer. Remote Sensing of Environment 303:113986. https://doi.org/10.1016/j.rse.2023.113986