Documentation Revision Date: 2021-09-30
Dataset Version: 1
Summary
This dataset includes 98 data files in ICARTT (*.ict) format.
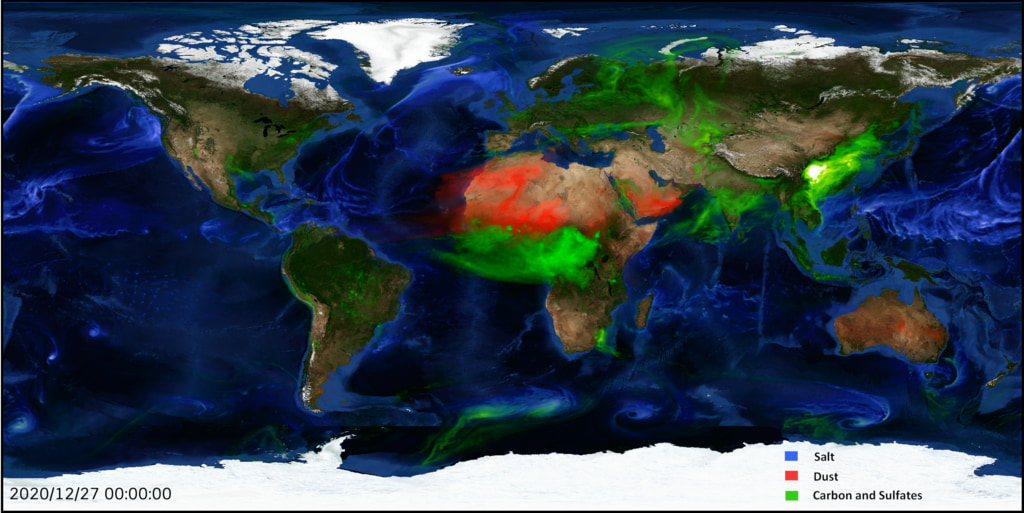
Figure 1. An example of aerosols modeled by GEOS-5. Source: NASA, 2020
Citation
Newman, P.A., and S. Pawson. 2021. ATom: GEOS-5 Derived Meteorological Conditions and Tagged Tracers Along Flight Tracks. ORNL DAAC, Oak Ridge, Tennessee, USA. https://doi.org/10.3334/ORNLDAAC/1876
Table of Contents
- Dataset Overview
- Data Characteristics
- Application and Derivation
- Quality Assessment
- Data Acquisition, Materials, and Methods
- Data Access
- References
Dataset Overview
This dataset provides modeled meteorological conditions and tagged-CO tracer concentrations along ATom flight paths derived from the Goddard Earth Observing System Version 5 (GEOS-5) data assimilation products from the Global Modeling and Assimilation Office (GMAO) at NASA's Goddard Space Flight Center. The GMAO "GEOS fp" forward processing system ingests satellite, ground-based, and airborne data, using a sophisticated model along with the data's statistical properties to obtain global three-dimensional data gridded fields at regular time intervals. These data are from the GMAO model output that were fitted to the ATom flight tracks by interpolating the GMAO model output to the horizontal ATom flight tracks for each of the 4 ATom Deployments. The dataset also provides tagged-CO tracer concentrations, which represent the contribution of specific regional sources to the total simulated CO. The data products produced are consistent with both the original measurements and the physical laws governing the atmosphere. To provide some meteorological context for the ATom flights, the GEOS5 gridded data are interpolated in space and time to the flight tracks.
Project: Atmospheric Tomography Mission
The Atmospheric Tomography Mission (ATom) was a NASA Earth Venture Suborbital-2 mission. It studied the impact of human-produced air pollution on greenhouse gases and on chemically reactive gases in the atmosphere. ATom deployed an extensive gas and aerosol payload on the NASA DC-8 aircraft for systematic, global-scale sampling of the atmosphere, profiling continuously from 0.2 to 12 km altitude. Flights occurred in each of four seasons over a 4-year period.
Related Datasets
Strode, S.A., J. Liu, L. Lait, R. Commane, B.C. Daube, S.C. Wofsy, A. Conaty, P. Newman, and M.J. Prather. 2018. ATom: Observed and GEOS-5 Simulated CO Concentrations with Tagged Tracers for ATom-1. ORNL DAAC, Oak Ridge, Tennessee, USA. https://doi.org/10.3334/ORNLDAAC/1604
- This dataset contains carbon monoxide (CO) observations at 10-second intervals from flights during the ATom-1 campaign and simulated CO concentrations from the Goddard Earth Observing System version 5 (GEOS-5) model for the corresponding locations along the ATom flight tracks.
Wofsy, S.C., S. Afshar, H.M. Allen, E.C. Apel, E.C. Asher, B. Barletta, et. al. 2021. ATom: Merged Atmospheric Chemistry, Trace Gases, and Aerosols, Version 2. ORNL DAAC, Oak Ridge, Tennessee, USA. https://doi.org/10.3334/ORNLDAAC/1925
- Data from all ATom instruments and the four ATom campaigns, including aircraft location and navigation data, merged to several different time bases.
Wofsy, S.C., and ATom Science Team. 2018. ATom: Aircraft Flight Track and Navigational Data. ORNL DAAC, Oak Ridge, Tennessee, USA. https://doi.org/10.3334/ORNLDAAC/1613
- Flightpath (location and altitude) data for each of the four ATom campaigns provided in KML and CSV format.
Data Characteristics
Spatial Coverage: Global. Flights circumnavigate the globe, primarily over the oceans.
Spatial Resolution: Point measurements
Temporal Coverage: Periodic flights occurred during each campaign
Temporal Resolution: 10 seconds
| Deployment | Date Range |
|---|---|
| ATom-1 | July 29 - August 23, 2016 |
| ATom-2 | January 26 - February 21, 2017 |
| ATom-3 | September 28 - October 28, 2017 |
| ATom-4 | April 24 - May 21, 2018 |
Data File Information
This dataset includes 98 data files in ICARTT (*.ict) format. Data files conform to the ICARTT File Format Standards V1.1.
The files are named GEOS5 _DC8_YYYYMMDD_R#.ict or GEOS5-2D_DC8_YYYYMMDD_R#.ict, where YYYYMMDD is the start date (in UTC time) of the flight and R# is the file version or revision number.
Table 1. File names and descriptions.
| File Name | Number of Files | Description |
|---|---|---|
| GEOS5 _DC8_YYYYMMDD_R#.ict | 48 | One-dimensional (1D) meteorological and environmental variables (detailed in Table 2). These files contain assimilated 1D (time) products interpolated to the flight paths of ATom deployments. These products estimate the meteorological and environmental conditions of the DC-8 aircraft flight. |
| GEOS5-2D_DC8_YYYYMMDD_R#.ict | 50 | Two-dimensional (2D) meteorological and environmental variables (detailed in Table 3). These files contain assimilated 2D (time and vertical structure) products interpolated to the flight paths of ATom deployments. Vertical structure is preserved by including 27 pressure levels. These products estimate conditions along a vertical column at a given time point on the flight path. |
Data File Details
Missing data are represented by -9999.99.
GOES-5 Variable and Standard Names
Names of variables provided in the GOES-5 files were constructed from the variable name used in the original GMAO source and appending "_GEOS5" (Tables 2 and 3). In this way, users can see the original source of the data and unambiguously determine exactly which data products from the GMAO were interpolated to obtain the values in the associated ATom file. However, the GMAO variable names are sometimes obscure. For example, "T" is easily interpreted to represent "temperature," but the meaning of "COBBAE" is not obvious to someone unfamiliar with the GMAO products. To make the variables more intelligible, the authors included more descriptive "standard names". However, no single standard nomenclature was adequate to describe all these meteorological quantities. The authors used a sequential approach to specify a “standard name” for each variable: first, if possible, a name was used that conforms to the Langley Atmospheric Composition Variable Standard Name Recommendations document (https://www-air.larc.nasa.gov/missions/etc/AtmosphericCompositionVariableStandardNames_V9.pdf); second, the NCAR/UCAR CF convention was used (http://cfconventions.org/); or third, when needed, CF-like or Langley-like names were adapted. In Tables 2 and 3, the source of the standard naming convention is indicated at the beginning of the standard name string as L= Langley, CF = NCAR/UCAR CF convention, and Non-standard = no convention (most are adapted forms of NCAR/UCAR CF convention).
Table 2. Variables in the data files named GEOS5_DC8_YYYYMMDD_R#.ict with 1D meteorological and environmental variables. The source of the standard naming convention is L= Langley, CF = NCAR/UCAR CF convention, and Non-standard = no convention.
| Variable Name | Units | Description | Standard Name |
|---|---|---|---|
| UTC_Start | Seconds | Seconds since 0000 UTC | Non-standard: UTC_Start |
| UTC_Stop | Seconds | Seconds since 0000 UTC | Non-standard: UTC_Stop |
| T_GEOS5 | K | Temperature | L: MET_StaticAirTemperature_insitu |
| U_GEOS5 | m/s | Zonal wind | L: MET_UWindSpeed_insitu |
| V_GEOS5 | m/s | Meridional wind | L: MET_VWindSpeed_insitu |
| H_GEOS5 | m | Geopotential height | CF: geopotential_height |
| Theta_GEOS5 | K | Potential temperature | L: MET_PotentialTemperature_insitu |
| EPV_GEOS5 | K m2/kg s | Ertel's potential vorticity | L: MET_PotentialTemperature_insitu |
| RH_GEOS5 | % | Relative Humidity | CF: relative_humidity |
| CO_GEOS5 | mol/mol | Carbon monoxide mixing ratio | L: Gas_CO_insitu_S_AMF |
| SO2_GEOS5 | kg/kg | Sulfur dioxide | L: Gas_SO2_insitu_S_AMF |
| SO4_GEOS5 | kg/kg | Sulfate aerosol | L: Aer_sulfate_insitu_Aerodynamic_Total_MassAMB |
| BC_GEOS5 | kg/kg | Black Carbon mass mixing ratio | L: Aer_BC_insitu_Aerodynamic_Total_MassAMB |
| OC_GEOS5 | kg/kg | Organic carbon | Non-standard: Gas_OrganicCarbon_insitu_M_AMF |
| CONBGL_GEOS5 | kg/kg | CO global non-biomass burning | Non-standard: Gas_CO_insitu_S_AMF_TaggedNonBBGlobal |
| CONBAS_GEOS5 | kg/kg | CO Asia non-biomass burning | Non-standard: Gas_CO_insitu_S_AMF_TaggedNonBBAsian |
| CONBNA_GEOS5 | kg/kg | CO North American non-biomass burning | Non-standard: Gas_CO_insitu_S_AMF_TaggedNonBBNorthAmerican |
| CONBEU_GEOS5 | kg/kg | CO European non-biomass burning | Non-standard: Gas_CO_insitu_S_AMF_TaggedNonBBEuropean |
| COBBGL_GEOS5 | kg/kg | CO global biomass burning | Non-standard: Gas_CO_insitu_S_AMF_TaggedBBGlobal |
| COBBAE_GEOS5 | kg/kg | CO Asia and Europe biomass burning | Non-standard: Gas_CO_insitu_S_AMF_TaggedBBAsianEuropean |
| COBBNA_GEOS5 | kg/kg | CO North America biomass burning | Non-standard: Gas_CO_insitu_S_AMF_TaggedBBNorthAmerican |
| COBBAF_GEOS5 | kg/kg | CO Africa biomass burning | Non-standard: Gas_CO_insitu_S_AMF_TaggedBBAfrican |
| COBBLA_GEOS5 | kg/kg | CO Central and South America biomass burning | Non-standard: Gas_CO_insitu_S_AMF_TaggedBBCentralAndSouthAmerican |
| SS_GEOS5 | kg/kg | Sea salt mass mixing ratio | L: Aer_seasalt_insitu_Aerodynamic_Total_MassAMB |
| DU_GEOS5 | kg/kg | Dust mass mixing ratio | L: Aer_mineral_insitu_Aerodynamic_Total_MassAMB |
| PBLH_GEOS5 | m | Planetary boundary layer height | L: MET_BoundaryLayerHeight_insitu |
| TROPPB_GEOS5 | mb | Tropopause pressure | CF: tropopause_air_pressure |
| U50M_GEOS5 | m/s | Near-surface (50-m) zonal wind | Non-standard: eastward_wind_at_50m |
| V50M_GEOS5 | m/s | Near-surface (50-m) meridional wind | Non-standard: eastward_wind_at_50m |
| SLP_GEOS5 | mb | Mean sea level pressure | CF: air_pressure_at_mean_sea_level |
| PS_GEOS5 | mb | Surface pressure | CF: surface_air_pressure |
Table 3. Variables in the data files named GEOS5-2D_DC8_YYYYMMDD_R#.ict with 2D meteorological and environmental variables. The source of the standard naming convention is L= Langley, CF = NCAR/UCAR CF convention, and Non-standard = no convention.
| Variable Name | Units | Description | Standard Name |
|---|---|---|---|
| UTC_Start | Seconds | Seconds since 0000 UTC | Non-standard: UTC_Start |
| NumP | Number | Number of pressure levels | Non-standard: NumP |
| UTC_Stop | Seconds | Seconds since 0000 UTC | Non-standard: UTC_Stop |
| UTC_Mid | Seconds | Seconds since 0000 UTC | Non-standard: UTC_Mid |
| Pressure | hPa | Pressure level | L: MET_StaticPressure_insitu |
| T_GEOS5 | K | Temperature | L: MET_StaticAirTemperature_insitu |
| U_GEOS5 | m/s | Zonal wind | L: MET_UWindSpeed_insitu |
| V_GEOS5 | m/s | Meridional wind | L: MET_VWindSpeed_insitu |
| H_GEOS5 | m | Geopotential height | CF: geopotential_height |
| Theta_GEOS5 | K | Potential temperature | L: MET_PotentialTemperature_insitu |
| EPV_GEOS5 | K m2/kg s | Ertel's potential vorticity | CF: ertel_potential_vorticity |
| RH_GEOS5 | % | Relative Humidity | CF: relative_humidity |
| CO_GEOS5 | mol/mol | Carbon monixide mixing ratio | L: Gas_CO_insitu_S_AMF |
| SO2_GEOS5 | kg/kg | Sulfur dioxide | L: Gas_SO2_insitu_S_AMF |
| SO4_GEOS5 | kg/kg | Sulfate aerosol | L: Aer_sulfate_insitu_Aerodynamic_Total_MassAMB |
| BC_GEOS5 | kg/kg | Black Carbon mass mixing ratio | L: Aer_BC_insitu_Aerodynamic_Total_MassAMB |
| OC_GEOS5 | kg/kg | Organic carbon | Non-standard: Gas_OrganicCarbon_insitu_M_AMF |
| CONBGL_GEOS5 | kg/kg | CO global non-biomass burning | Non-standard: Gas_CO_insitu_S_AMF_TaggedNonBBGlobal |
| CONBAS_GEOS5 | kg/kg | CO Asia non-biomass burning | Non-standard: Gas_CO_insitu_S_AMF_TaggedNonBBAsian |
| CONBNA_GEOS5 | kg/kg | CO North American non-biomass burning | Non-standard: Gas_CO_insitu_S_AMF_TaggedNonBBNorthAmerican) |
| CONBEU_GEOS5 | kg/kg | CO European non-biomass burning | Non-standard: Gas_CO_insitu_S_AMF_TaggedNonBBEuropean |
| COBBGL_GEOS5 | kg/kg | CO global biomass burning | Non-standard: Gas_CO_insitu_S_AMF_TaggedBBGlobal |
| COBBAE_GEOS5 | kg/kg | CO Asia and Europe biomass burning | Non-standard: Gas_CO_insitu_S_AMF_TaggedBBAsianEuropean |
| COBBNA_GEOS5 | kg/kg | CO North America biomass burning | Non-standard: Gas_CO_insitu_S_AMF_TaggedBBNorthAmerican |
| COBBAF_GEOS5 | kg/kg | CO Africa biomass burning | Non-standard: Gas_CO_insitu_S_AMF_TaggedBBAfrican |
| COBBLA_GEOS5 | kg/kg | CO Central and South America biomass burning | Non-standard: Gas_CO_insitu_S_AMF_TaggedBBCentralAndSouthAmerican |
| SS_GEOS5 | kg/kg | Sea salt mass mixing ratio | L: Aer_seasalt_insitu_Aerodynamic_Total_MassAMB |
| DU_GEOS5 | kg/kg | Dust mass mixing ratio | L: Aer_mineral_insitu_Aerodynamic_Total_MassAMB |
Application and Derivation
ATom builds the scientific foundation for mitigation of short-lived climate forcers, in particular, methane (CH4), tropospheric ozone (O3), and Black Carbon aerosols (BC).
ATom Science Questions
Tier 1
- What are chemical processes that control the short-lived climate forcing agents CH4, O3, and BC in the atmosphere? How is the chemical reactivity of the atmosphere on a global scale affected by anthropogenic emissions? How can we improve chemistry-climate modeling of these processes?
Tier 2
- Over large, remote regions, what are the distributions of BC and other aerosols important as short-lived climate forcers? What are the sources of new particles? How rapidly do aerosols grow to CCN-active sizes? How well are these processes represented in models?
- What type of variability and spatial gradients occur over remote ocean regions for greenhouse gases (GHGs) and ozone-depleting substances (ODSs)? How do the variations among air parcels help identify anthropogenic influences on photochemical reactivity, validate satellite data for these gases, and refine knowledge of sources and sinks?
Significance
ATom delivers unique data and analysis to address the Science Mission Directorate objectives of acquiring “datasets that identify and characterize important phenomena in the changing Earth system” and “measurements that address weaknesses in current Earth system models leading to improvement in modeling capabilities.” ATom will provide unprecedented challenges to the CCMs used as policy tools for climate change assessments, with comprehensive data on atmospheric chemical reactivity at global scales, and will work closely with modeling teams to translate ATom data to better, more reliable CCMs. ATom provides extraordinary validation data for remote sensing.
Quality Assessment
Uncertainty information is not provided.
Data Acquisition, Materials, and Methods
Project Overview
ATom makes global-scale measurements of the chemistry of the atmosphere using the NASA DC-8 aircraft. Flights span the Pacific and Atlantic Oceans, nearly pole-to-pole, in continuous profiling mode, covering remote regions that receive long-range inputs of pollution from expanding industrial economies. The payload has proven instruments for in situ measurements of reactive and long-lived gases, diagnostic chemical tracers, and aerosol size, number, and composition, plus spectrally resolved solar radiation and meteorological parameters.
Combining distributions of aerosols and reactive gases with long-lived GHGs and ODSs enables disentangling of the processes that regulate atmospheric chemistry: emissions, transport, cloud processes, and chemical transformations. ATom analyzes measurements using customized modeling tools to derive daily averaged chemical rates for key atmospheric processes and to critically evaluate Chemistry-Climate Models (CCMs). ATom also differentiates between hypotheses for the formation and growth of aerosols over the remote oceans.
Goddard Earth Observing System, Version 5
The Goddard Earth Observing System, Version 5 (GEOS-5) model consists of data assimilation products from the Global Modeling and Assimilation Office (GMAO) at NASA's Goddard Space Flight Center (see https://gmao.gsfc.nasa.gov). Data from the original one-dimensional and two-dimensional GEOS of products are interpolated to ATom flight tracks as available from the Wofsy et al., 2018 dataset. Horizontal interpolation is bi-linear in longitude and latitude, vertical interpolation (where applicable) is linear in log-pressure, and linear interpolation in time is done between six-hourly data snapshots. All fields are interpolated to the flight's UTC_Start time. Flight pressures greater than 1000 hPa are taken as 1000 hPa for purposes of vertical interpolation. An overview of GEOS-5 and user manuals can be found on the NASA Global Modeling and Assimilation Office website and specifics relating to model derivation and documentation can be found in Rienecker et al. (2008).
The GEOS-5 FP system simulates the transport of CO as well as tagged CO tracers from specific regions and sources, which helps track the transport of pollution outflow. Tagged tracers are available for biomass burning (BB) globally as well as biomass burning from Eurasia, North America, Africa, and Central and South America; and for non-BB sources globally and from Europe, Asia, and North America. Non-BB sources include fossil fuels, biofuels, CO from oxidation of biogenic VOCs, and CO from methane oxidation, as described in Ott et al. (2010).
Data Access
These data are available through the Oak Ridge National Laboratory (ORNL) Distributed Active Archive Center (DAAC).
ATom: GEOS-5 Derived Meteorological Conditions and Tagged Tracers Along Flight Tracks
Contact for Data Center Access Information:
- E-mail: uso@daac.ornl.gov
- Telephone: +1 (865) 241-3952
References
NASA. 2020. SVS: Aerosol Optical Thickness Updating Forecast. NASA. https://svs.gsfc.nasa.gov/4582
Ott, L., B. Duncan, S. Pawson, P. Colarco, M. Chin, C. Randles, T. Diehl, and E. Nielsen. 2010. Influence of the 2006 Indonesian biomass burning aerosols on tropical dynamics studied with the GEOS-5 AGCM. Journal of Geophysical Research 115. https://dx.doi.org/10.1029/2009jd013181
Rienecker, M.M., M.J. Suarez, R. Todling, J. Bacmeister, L. Takacs, H.-C. Liu, W. Gu, M. Sienkiewicz, R.D. Koster, R. Gelaro, I. Stajner, and J.E. Nielsen, 2008. The GEOS-5 Data Assimilation System - Documentation of Versions 5.0.1, 5.1.0, and 5.2.0. Technical Report Series on Global Modeling and Data Assimilation, 27. https://gmao.gsfc.nasa.gov/pubs/docs/tm27.pdf
Wofsy, S.C., S. Afshar, H.M. Allen, E.C. Apel, E.C. Asher, B. Barletta, et al. 2018. ATom: Merged Atmospheric Chemistry, Trace Gases, and Aerosols. ORNL DAAC, Oak Ridge, Tennessee, USA. https://doi.org/10.3334/ORNLDAAC/1581