Documentation Revision Date: 2020-06-29
Dataset Version: 1
Summary
The ATom flight data are for ATom-1, ATom-2, and ATom-4 and are from the NASA DC-8 Meteorological Measurement System (MMS) and a second-generation Cloud, Aerosol, and Precipitation Spectrometer (CAPS). CAPS has two primary sensors, the Cloud, and, Aerosol Spectrometer with Depolarization Detection (CAS-DPOL), and a Cloud Imaging Probe (CIP). The SALTRACE data are from the CAS-DPOL instrument and CMET data system. The A-LIFE data are from the DLR Falcon CMET (aircraft-mount flow sensor) data system and a CAPS. Droplet x-axis and y-axis diameters were extrapolated from CIP images.
There are 47 data files in comma-separated format (*.csv) provided in this dataset.
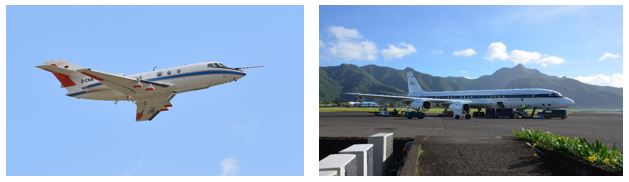
Figure 1. Left: The DLR Falcon used for the SALTRACE 2013 and the A-LIFE 2017 campaigns. (Source: B. Weinzierl, UNIVIE). Right: The NASA DC-8 aircraft used during the ATom missions sitting at the Pago Pago International Airport, American Samoa. (Source: M. Dollner, UNIVIE).
Citation
Spanu, A., M. Dollner, J. Gasteiger, T.P. Bui, and B. Weinzierl. 2020. ATom: In-Situ Measurements of Airflow and Aerosols from Multiple Airborne Campaigns. ORNL DAAC, Oak Ridge, Tennessee, USA. https://doi.org/10.3334/ORNLDAAC/1784
Table of Contents
- Dataset Overview
- Data Characteristics
- Application and Derivation
- Quality Assessment
- Data Acquisition, Materials, and Methods
- Data Access
- References
Dataset Overview
This dataset provides results of selected in-situ measurements of airflow and aerosol particles collected during the following airborne campaigns: NASA Atmospheric Tomography (ATom), Saharan Aerosol Long-range Transport and Aerosol-Cloud-interaction Experiment (SALTRACE), and Absorbing aerosol layers in a changing climate: aging, lifetime and dynamics (A-LIFE). The airborne campaigns were conducted between 2013-06-10 and 2018-05-21. Depending upon the aircraft instrumentation per flight and campaign, the data include aircraft position, relative humidity, temperature, pressure, angle of attack (AOA), the probe location, true and probe air speeds, and aerosol particle diameters as extracted from Cloud Imaging Probe (CIP) images for the ATom and A-LIFE flights. Also provided are the results of combining the airborne data with numerical modeling to simulate particle sampling efficiency. Simulations investigated how airflow around wing-mounted instruments affected sampling efficiency and the induced errors for different realistic flight conditions.
The ATom flight data are for ATom-1, ATom-2, and ATom-4 and are from the NASA DC-8 Meteorological Measurement System (MMS) and a second-generation Cloud, Aerosol, and Precipitation Spectrometer (CAPS). CAPS has two primary sensors, the Cloud, and, Aerosol Spectrometer with Depolarization Detection (CAS-DPOL), and a Cloud Imaging Probe (CIP). The SALTRACE data are from the CAS-DPOL instrument and CMET data system. The A-LIFE data are from the DLR Falcon CMET (aircraft-mount flow sensor) data system and a CAPS. Droplet x-axis and y-axis diameters were extrapolated from CIP images.
Project: Atmospheric Tomography Mission
The Atmospheric Tomography Mission (ATom) is a NASA Earth Venture Suborbital-2 mission to study the impact of human-produced air pollution on greenhouse gases and on chemically reactive gases in the atmosphere. ATom deployed an extensive gas and aerosol payload on the NASA DC-8 aircraft for systematic, global-scale sampling of the atmosphere, profiling continuously from 0.2 to 12 km altitude. Around-the-world flights were conducted in each of four seasons between 2016 and 2018.
Related Publication
Spanu, A., M. Dollner, J. Gasteiger, T.P. Bui, and B. Weinzierl. 2020. Flow-induced errors in airborne in-situ measurements of aerosols and clouds. Atmospheric Measurement Techniques, 13:1963–1987. https://doi.org/10.5194/amt-13-1963-2020
Related Dataset
Wofsy, S.C., S. Afshar, H.M. Allen, E.C. Apel, E.C. Asher, B. Barletta, et al. 2018. ATom: Merged Atmospheric Chemistry, Trace Gases, and Aerosols. ORNL DAAC, Oak Ridge, Tennessee, USA. https://doi.org/10.3334/ORNLDAAC/1581
Acknowledgments
This work was supported by NASA Earth System Science Pathfinder Program (Grant NNH15AB12I), the VERTIGO Marie Curie Initial Training Network through the European Seventh Framework Programme (FP7 2007-2013; Grant 607905), and the A-LIFE European Research Council under the European Community Horizon 2020 Research and Innovation Framework Program (Grant 640458).
Data Characteristics
Spatial Coverage: Global, sampling primarily over the remote oceans
Spatial Resolution: On average, about 200 m
Temporal Coverage
SALTRACE: 2013-06-10 to 2013-07-15
A-LIFE: 2017-04-03 to 2017-04-29
ATom-1, ATom-2, ATom-4: 2016-07-29 to 2018-05-21
Temporal Resolution: 1 second
Study Areas: Latitude and longitude are provided in decimal degrees.
| Site | Northernmost Latitude | Southernmost Latitude | Easternmost Longitude | Westernmost Longitude |
|---|---|---|---|---|
| Global | -180 | 180 | 80.52 | -65.33 |
Data File Information
There are 47 comma-delimited (.csv) data files provided with this dataset; 46 files of measurement data and one file of simulation results.
The files names and data use the acronyms and abbreviations:
- CAPS: Cloud, Aerosol, and Precipitation Spectrometer has two primary sensors: the Cloud and Aerosol Spectrometer with Depolarization Detection (CAS-DPOL), and a Cloud Imaging Probe (CIP)
- CMET: DLR Falcon aircraft-mounted flow sensor data system
- MMS: NASA DC-8 Meteorological Measurement System
- YYYYMMDD: Sampling date in UTC
Table 1. File names and descriptions.
| File Name | Description |
|---|---|
| A-LIFE_YYYMMDD.csv | There are five files with flight data from the CMET and the CAPS instrument collected at two different aircraft locations. |
| ATom-1_YYYYMMDD.csv | There are three files with flight data from the MMS and the CAPS instrument. |
| ATom-2_YYYYMMDD.csv | There are six files with flight data from the MMS and the CAPS instrument. |
| CIP_x-YYYYMMDD.csv | There are six files with Droplet x-axis and y-axis diameters extrapolated from CIP images. x = A-LIFE, ATom-2, or ATom-4 indicated the associated airborne flight. |
| SALTRACE_YYYYMMDDx.csv | There are 26 files with flight data from the CMET and the CAS-DPOL instrument collected at two different aircraft locations. x = a or b indicates that data are from the first or second flight of the day, respectively. |
| simulations.csv | Output data for comparison of the difference between simulated particles' concentration at the free stream and the probe location for different flight conditions. |
Data File Details
The variables gps_lat, gps_lon, and gps_alt in all data files are in WGS84 (EPSG 4326).
Table 2. Variables in the files A-LIFE_YYYYMMDD.csv.
| Variable | Units | Description |
|---|---|---|
| utseconds | s | Sampling time as seconds from midnight on date of sampling in UTC |
| gps_lat | degree | Latitude |
| gps_lon | degree | Longitude |
| gps_alt | m | Altitude |
| AOA | degree | Angle of attack |
| T_CAPS | k | Temperature at the probe |
| T_CMET | k | Temperature |
| relhum | % | Relative humidity over water |
| qc_CAPS | hPa | Calibrated dynamic pressure |
| qc_CMET | hPa | Dynamic pressure |
| ps_CAPS | hPa | Calibrated static pressure |
| ps_CMET | hPa | Static pressure |
| TAS_CAS | m/s | Calibrated true air speed |
| TAS_CMET | m/s | True air speed |
Table 3. Variables in the files ATom-1_YYYYMMDD.csv.
| Variable | Units | Description |
|---|---|---|
| utseconds | s | Sampling time as seconds from midnight on date of sampling in UTC |
| gps_lat | degree | Latitude |
| gps_lon | degree | Longitude |
| gps_alt | m | Altitude |
| AOA | degree | Angle of attack |
| T_CAPS | k | Temperature at the probe |
| T_MMS | k | Temperature |
| qc_CAPS | hPa | Dynamic pressure |
| qc_MMS | hPa | Dynamic pressure |
| ps_CAPS | hPa | Static pressure |
| ps_MMS | hPa | Static pressure |
| PAS_CAPS | m/s | Probe air speed |
| TAS_MMS | m/s | True air speed |
Table 4. Variables in the files ATom-2_YYYYMMDD.csv.
| Variable | Units | Description |
|---|---|---|
| utseconds | s | Sampling time as seconds from midnight on date of sampling in UTC |
| gps_lat | degree | Latitude |
| gps_lon | degree | Longitude |
| gps_alt | m | Altitude |
| AOA | degree | Angle of attack |
| T_MMS | k | Temperature |
| ps_MMS | hPa | Static pressure |
| TAS_CAPS | m/s | Calibrated true air speed |
| TAS_MMS | m/s | True air speed |
Table 5. Variables in the files CIP_x- YYYYMMDD.csv.
| Variable | Units | Description |
|---|---|---|
| time | Sampling time as seconds from midnight on date of sampling in UTC | |
| x | um | Droplet x-axis diameter in micron |
| y | um | Droplet y-axis diameter in micron |
Table 6. Variables in the files SALTRACE_YYMMDDx.csv.
| Variable | Units | Description |
|---|---|---|
| utseconds | s | Sampling time as seconds from midnight on date of sampling in UTC |
| gps_lat | degree | Latitude |
| gps_lon | degree | Longitude |
| gps_alt | m | Altitude |
| AOA | degree | Angle of attack |
| T_CAS | k | Temperature at the probe |
| T_CMET | k | Temperature |
| relhum | % | Relative humidity over water |
| qc_CAS | hPa | Dynamic pressure |
| qc_CMET | hPa | Dynamic pressure |
| ps_CAS | hPa | Static pressure |
| ps_CMET | hPa | Static pressure |
| PAS_CAS | m/s | Probe air speed |
| TAS_CMET | m/s | True air speed |
Table 7: Variables in the file simulations.csv.
| Variable | Units | Description |
|---|---|---|
| U0 | m/s | Free stream air velocity |
| d | 1×10⁻⁶ m | Particle diameter |
| rho | Kg/m3 | Particle density |
| T | K | Temperature |
| p | hPa | Static pressure |
| eff | % | Simulated sampling efficiency |
| Up | m/s | Particle speed |
| U | m/s | Probe air velocity |
User Note: For detailed descriptions of the reported variables and their specific uses refer to Spanu et al. (2020).
Table 8. Spatial extents of the associated airborne campaigns.
| Site | Westernmost Longitude | Easternmost Longitude | Northernmost Latitude | Southernmost Latitude |
|---|---|---|---|---|
| Atom-1, -2, -4 flights | -180 | 180 | 80.52 | -65.33 |
| SALTRACE | -81.51 | 11.45 | 67.02 | -6.02 |
| A-LIFE | 11.2 | 33.4 | 48.4 | 33 |
Application and Derivation
Dusts and other aerosol data are important to climate change studies. The airborne data collections provide insights into the atmospheric chemistry of these aerosols. The modeled results provide an estimation of sampling errors deriving from airflow distortion caused by the instrument and aircraft wing.
Experimental data show that flow speed at the instrument location is smaller than the ambient flow speed. Simulations confirmed
to a 25% overestimation of the number concentration of particles larger than 10 μm diameter and causes distorted images of droplets and ice crystals if the flow values recorded at the instrument are used. With the proposed correction scheme both errors are significantly reduced by a factor of 10. See Spanu et al. (2020) for details.
Quality Assessment
The DLR Falcon was equipped per default with a Rosemount 5-hole pressure probe model R858A on the tip of the nose-boom (Spanu et al., 2020), referred to as the CMET system. CMET was calibrated using a cone trail (Bogel and Baumann, 1991).
For additional information regarding the MMS hardware, refer to Chan et al. (1998).
The CAS-DPOL is equipped with a 17 cm pitot tube, whereas the CAPS has a 24 cm long pitot tube. Pressure sensors were statically calibrated by the manufacturer.
For information on the CAPS, refer to Baumgardner et al. (2001).
Data Acquisition, Materials, and Methods
The following is a brief synopsis of aircraft instrumentation and numerical modeling as described in Spanu et al. (2020).
Airborne Campaigns
Absorbing aerosol layers in a changing climate: aging, lifetime and dynamics (A-LIFE)
The A-LIFE campaign studied the properties of absorbing aerosols (in particular mineral dust – black carbon mixtures) during their atmospheric lifetime (see Weinzierl et al., 2018). The overall aim of A-LIFE is to gather a novel data set of aerosol properties of absorbing aerosol mixtures, to reduce the large uncertainties in estimates of aerosol radiative forcing parameters, and to study potential links between the presence of absorbing particles, aerosol layer lifetime and particle removal. The A-LIFE field experiment used in-situ and remote sensing instruments on board of the DLR research aircraft Falcon to measure properties of absorbing aerosols and their distribution throughout the tropospheric column.
Atmospheric Tomography Mission (ATom)
The Atmospheric Tomography Mission (ATom) was a NASA Earth Venture Suborbital-2 mission. It studied the impact of human-produced air pollution on greenhouse gases and on chemically reactive gases in the atmosphere. During ATom the NASA DC-8 aircraft was used to continuously profile from 0.2 up to 12 km the atmosphere during the four seasons, a different one for each year (see Wofsy et al., 2018). Data were collected using the Meteorological Measurement System MMS and a second-generation CAPS mounted under the wing of the NASA DC-8 research aircraft.
Saharan Aerosol Long-range Transport and Aerosol-Cloud-Interaction Experiment (SALTRACE)
SALTRACE was an airborne and ground-based field experiment investigating the long-range transport of Saharan mineral dust across the Atlantic Ocean into the Caribbean (see Weinzierl et al., 2016). Airborne in situ measurements with the DLR research aircraft Falcon were performed between 10 June and 15 July 2013.
Aircraft Instrumentation
The DLR Falcon used in A-LIFE is equipped per default with a Rosemount 5-hole pressure probe model R858A on the tip of the nose-boom referred to as the CMET system. The CMET system measures inflow velocity and direction and has been calibrated using a cone trail (Bogel and Baumann, 1991).
The CAS-DPOL is equipped with a 17 cm pitot tube, whereas the CAPS has a 24 cm long pitot tube. Pressure sensors have been statically calibrated by the manufacturer.
The MMS hardware consists of three major systems: an air-motion sensing system to measure air velocity with respect to the aircraft, an aircraft-motion sensing system to measure the aircraft velocity with respect to the earth, and a data acquisition system to sample, process, and record the measured quantities (Chan et al., 1998).
Flow Modeling
The flow model is based on time-averaged Navier-Stokes equations for compressible flows (Johnson, 1992). The numerical solution is obtained using a modified version of the rhoSimpleFoam solver from the finite volume code OpenFOAM v4.0.x (Weller et al., 1998). The particle motion is described using an Eulerian-Lagrangian approach where the Eulerian continuum equations are solved for the fluid phase, while Newton’s equations define the particle motion determining their trajectories.
Experimental data show that flow speed at the instrument location is smaller than the ambient flow speed. Simulations confirmed
to a 25 % overestimation of the number concentration of particles larger than 10 μm diameter and causes distorted images of droplets and ice crystals if the flow values recorded at the instrument are used. With the proposed correction scheme both errors are significantly reduced by up to a factor 10. Refer to Spanu et al. (2020) for additional details.
Data Access
These data are available through the Oak Ridge National Laboratory (ORNL) Distributed Active Archive Center (DAAC).
ATom: In-Situ Measurements of Airflow and Aerosols from Multiple Airborne Campaigns
Contact for Data Center Access Information:
- E-mail: uso@daac.ornl.gov
- Telephone: +1 (865) 241-3952
References
Baumgardner, D., H. Jonsson, W. Dawson, W., D. O’Connor, and R. Newton. 2001. The cloud, aerosol and precipitation spectrometer: a new instrument for cloud investigations, Atmospheric Research, 59:251–264. https://doi.org/10.1016/S0169-8095(01)00119-3
Bogel, W. and R. Baumann. 1991. Test and calibration of the DLR Falcon wind measuring system by maneuvers, Journal of Atmospheric and Oceanic Technology, 8:5–18. https://doi.org/10.1175/1520-0426(1991)008<0005:TACOTD>2.0.CO;2
Chan, K.R., J. Dean-Day, S.W. Bowen, and T.P. Bui. 1998. Turbulence measurements by the DC-8 meteorological measurement system. Geophysical Research Letters, 25:1355–1358. https://doi.org/10.1029/97GL03590
Johnson, C. 1992. Streamline diffusion finite-element method for compressible and incompressible fluid flow. In: Finite Elements in Fluids. T.J. Chung (eds) 8:75–96.
Spanu, A., M. Dollner, J. Gasteiger, T.P. Bui, and B. Weinzierl. 2020. Flow-induced errors in airborne in-situ measurements of aerosols and clouds. Atmospheric Measurement Techniques, 13:1963–1987. https://doi.org/10.5194/amt-13-1963-2020
Weinzierl, B. and ALIFE_Team. 2018. Absorbing aerosol layers in a changing climate: aging, lifetime and dynamics (A-LIFE). www.a-life.at
Weinzierl, B., A. Ansmann, J.M. Prospero, D. Althausen, N. Benker, F. Chouza, et al. 2016. The Saharan Aerosol Long-Range Transport and Aerosol–Cloud-Interaction Experiment: Overview and Selected Highlights. Bulletin of the American Meteorological Society, 98(7):1427-1451. https://doi.org/10.1175/BAMS-D-15-00142.1
Weller, H., G. Tabor, H. Jasak, C. Fureby. 1998. A tensorial approach to computational continuum mechanics using object-oriented techniques. Computers in Physics, 12. https://doi.org/10.1063/1.168744
Wofsy, S.C., S. Afshar, H.M. Allen, E.C. Apel, E.C. Asher, B. Barletta, et al. 2018. ATom: Merged Atmospheric Chemistry, Trace Gases, and Aerosols. ORNL DAAC, Oak Ridge, Tennessee, USA. https://doi.org/10.3334/ORNLDAAC/1581