Documentation Revision Date: 2018-11-08
Data Set Version: 1
Summary
The two UHSAS instruments are capable of continuous 1-s measurements of size-resolved particle number concentration with high accuracy and precision over a diameter range of 0.063–1.0 μm from > 1100 to 225 hPa, while simultaneously measuring particle volatility. Precision is limited by counting statistics, especially in the remote free troposphere. The flow system of the UHSAS was modified which allowed direct monitoring of the sample flow rate and eliminated flow measurement issues associated with the pressure variations during aircraft altitude changes.
This dataset supports the publication by Kupc et al. 2018. Each data file corresponds to a publication figure.
There are nine data files in comma-separated format (.csv) with this dataset.
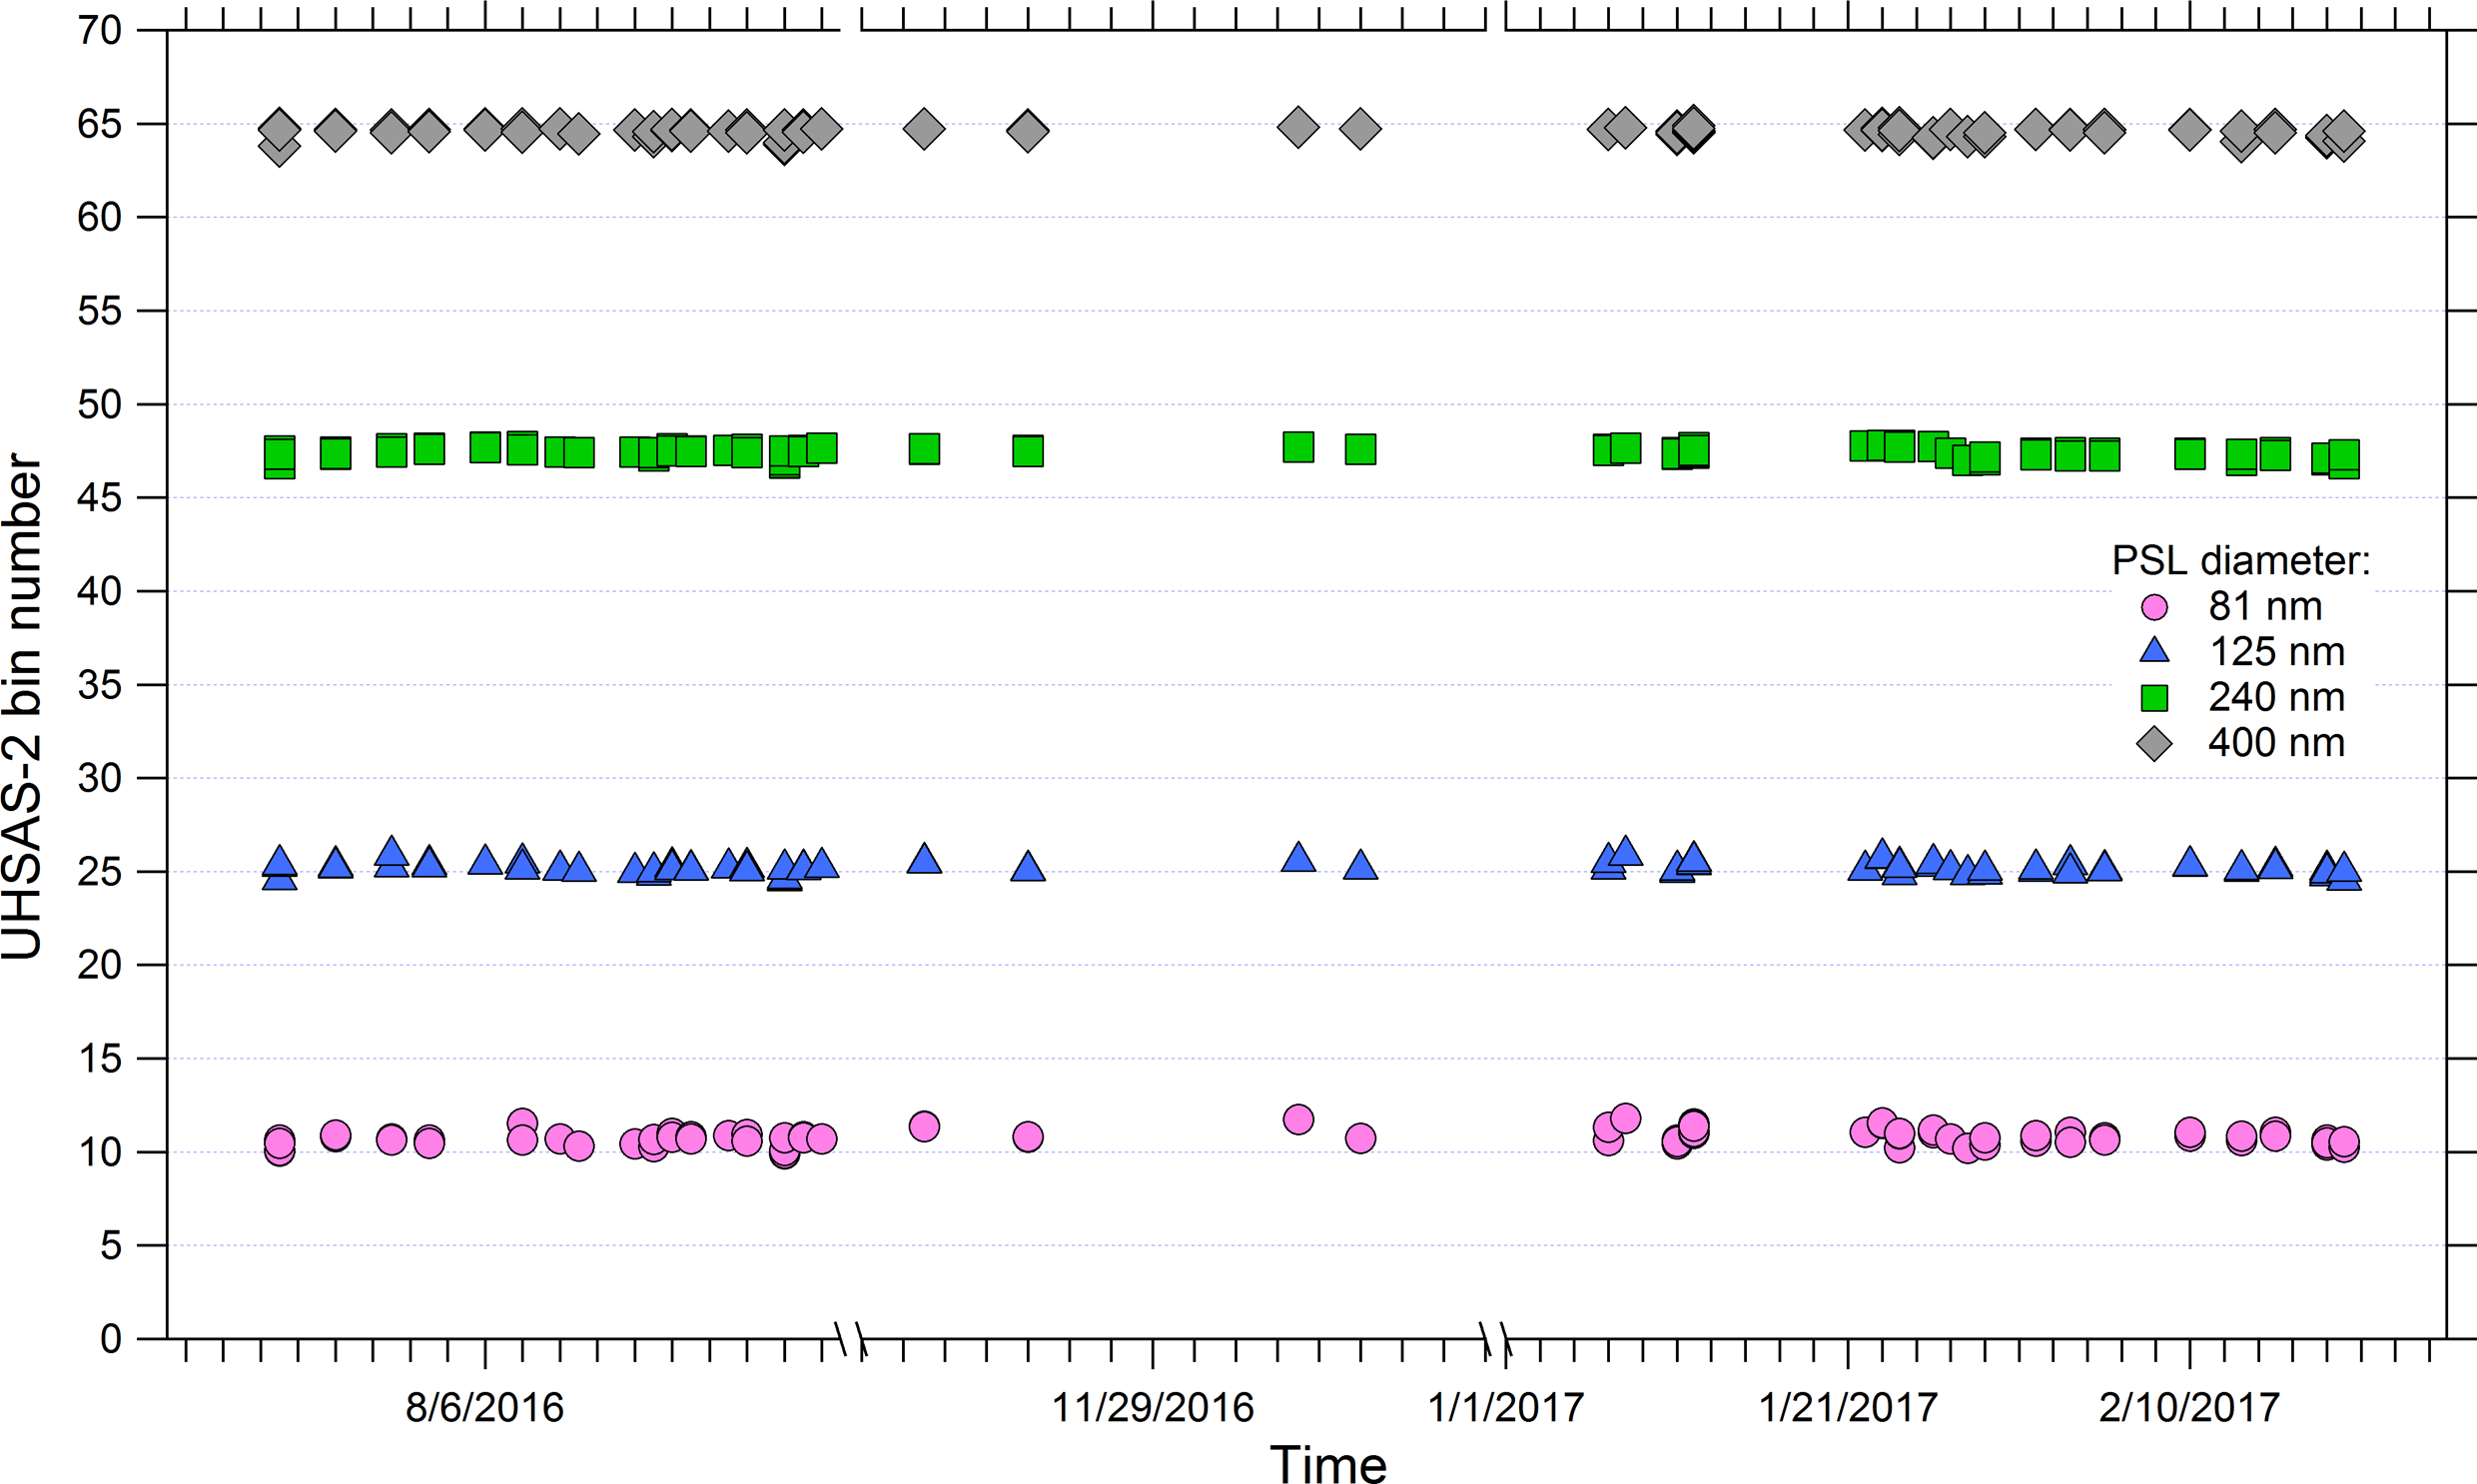
Figure 1. Fitted peak bin number for four polystyrene latex (PSL) spheres size standards and as a function of time from July 2016 to February 2017, showing calibration precision and the stability of the UHSAS-2 sizing during ATom-1 and 2 (Figure 9, Kupc et al., 2018).
Citation
Kupc, A., C.J. Williamson, N.L. Wagner, M. Richardson, and C.A. Brock. 2018. ATom: Ultra-High Sensitivity Aerosol Spectrometer Calibration and Performance Data. ORNL DAAC, Oak Ridge, Tennessee, USA. https://doi.org/10.3334/ORNLDAAC/1619
Table of Contents
- Data Set Overview
- Data Characteristics
- Application and Derivation
- Quality Assessment
- Data Acquisition, Materials, and Methods
- Data Access
- References
Data Set Overview
This dataset provides extensive calibration and in-flight performance data for two Ultra-High Sensitivity Aerosol Spectrometers (UHSAS) used for particle size distribution and volatility measurements during the NASA Atmospheric Tomography Mission (ATom) airborne campaign. UHSAS-1 was equipped with a compact thermodenuder operating at 300 degrees C and UHSAS-2 was operated without a thermodenuder to determine the number and volume fraction of volatile particles. Laboratory studies utilized aerosols from limonene ozonolysis (limon), atomization of ammonium sulfate (AS), and atomization of 2-diethylhexyl (dioctyl) sebacate (DOS). Data include: UHSAS detection efficiency, sizing calibration, performance at a range of pressures and at a range of thermodenuder temperatures, comparison of UHSAS-2 and condensation particle counter (CPC) particle number concentrations, comparisons of UHSAS-1 and UHSAS-2 for dry particle number concentration, surface area and volume collected onboard of a NASA DC-8 aircraft during August 2016, and dry aerosol size distributions for thermodenuded and non-thermodenuded instrument collected in February 2017.
The two UHSAS instruments are capable of continuous 1-s measurements of size-resolved particle number concentration with high accuracy and precision over a diameter range of 0.063–1.0 μm from > 1100 to 225 hPa, while simultaneously measuring particle volatility. Precision is limited by counting statistics, especially in the remote free troposphere. The flow system of the UHSAS was modified which allowed direct monitoring of the sample flow rate and eliminated flow measurement issues associated with the pressure variations during aircraft altitude changes.
Project: Atmospheric Tomography Mission (ATom)
The Atmospheric Tomography Mission (ATom) was a NASA Earth Venture Suborbital-2 mission. It studied the impact of human-produced air pollution on greenhouse gases and on chemically reactive gases in the atmosphere. ATom deployed an extensive gas and aerosol payload on the NASA DC-8 aircraft for systematic, global-scale sampling of the atmosphere, profiling continuously from 0.2 to 12 km altitude. Flights occurred in each of 4 seasons over a 4-year period.
Related Publication:
Kupc, A., C. Williamson, N.L. Wagner, M. Richardson, and C.A. Brock. 2018. Modification, calibration, and performance of the Ultra-High Sensitivity Aerosol Spectrometer for particle size distribution and volatility measurements during the Atmospheric Tomography Mission (ATom) airborne campaign, Atmos. Meas. Tech., 11, 369-383, https://doi.org/10.5194/amt-11-369-2018
Acknowledgements:
This research was funded by the following programs:
- NASA Earth System Science Pathfinder Program, grant number NNH15AB12I
- NOAA’s Health of the Atmosphere and Atmospheric Chemistry, Carbon Cycle, and Climate Programs
- Austrian Science Fund FWF Erwin Schrodinger Fellowship J-3613
Data Characteristics
Spatial Coverage: These data are mostly laboratory-derived; the spatial and temporal coverage reflect the ATom-1 and ATom-2 flights. Flights for the ATom Project begin in California, fly north to the western Arctic, south to the South Pacific, east to the southern Atlantic, north to Greenland, and return to California across central North America.
Spatial Resolution: NA
Temporal Coverage: Periodic flights occurred during each deployment. ATom-1 was from July 29, 2016 - August 23, 2016 and ATom-2 was from January 26, 2017 - February 21, 2017.
Temporal Resolution: NA
Study Area: All latitude and longitude are given in decimal degrees.
| Site | Northern Extent | Southern Extent | Eastern Extent | Western Extent |
|---|---|---|---|---|
| ATom flights | 80.52 | -65.33 | 180 | -180 |
Data File Information
There are nine data files in comma-delimited (.csv) format with this dataset. The files provide calibration and performance data for two UHSAS instruments. Data corresponds to the figures presented in the publication by Kupc et al. (2018)
A list of abbreviations used in the file names, column names, and descriptions is provided below.
Table 1. Frequently used abbreviations
| Abbreviation | Description |
|---|---|
| AS | ammonium sulfate (NH4)2SO4) |
| DOS | dioctyl sebacate (di-2-ethylhexyl (dioctyl)) |
| PSL | polystyrene latex spheres |
| Limon | limonene oxidation product |
| CPC | condensation particle counter |
| TD | thermodenuder |
| MBL | marine boundary layer |
| FT | free troposphere |
Table 2. File names and descriptions.
The file names contain “_figX” to indicate a corresponding figure in the related publication of Kupc et al. (2018). Please refer to the variable descriptions below, the respective figure caption and descriptions in the publication for complete information.
| File name | Description |
|---|---|
| UHSAS2_diam_binnum_PSL_AS_DOS_limon_fig3.csv | Calibration particle diameter as a function of UHSAS-2 (not thermodenuded) bin number for particles composed of PSL, AS, DOS, and limonene ozonolysis products. |
| UHSAS2_mobility_eqv_AS_DOS_fig4.csv | Detection efficiency of the non-thermodenuded UHSAS-2 instrument as a function of mobility equivalent diameter for AS and DOS aerosol. |
| UHSAS2_cpc_AS_conc_fig5.csv | UHSAS-2 and CPC particle number concentration for nearly monodisperse AS aerosol of various sizes (> 0.1 μm) at ambient pressure |
| thermodenuder_temp_AS_NaCL_limon_fig7.csv | Temperature of the thermodenuder for ammonium sulfate particles when diameters are equal to 150, 250, and 500 nm, and concentrations normalized to the concentration measured by UHSAS-1 at room temperature, and also for limon at 250 nm, and AS at 150 nm |
| UHSAS2_vol_AS_DOS_PSL_fig8.csv | Flight data from February 10, 2017, 1 s measurements. The calculated aerosol volume from the UHSAS-2 measured dry size distributions based on calibration particles (AS, DOS, and PSL) with refractive indices between 1.44 and 1.58 |
| UHSAS2_PSL_bin_num_fig9.csv | UHSAS-2 (Flight data from ATom-1 and 2, July 2016 – February 2017) fitted peak bin number corresponding to four PSL size standards (81, 125, 240, and 400 nm) and as a function of time |
| UHSAS1-2_ATom1_particles_fig10.csv | Flight data from UHSAS 1 and 2 on ATom-1 from July 29th to August 8th 2016. The data are for (a) dry particle number, (b) surface area, and (c) and volume concentrations for diameters and uncertainties for a, b, and c, from 0.1 to 0.9 μm. Each point is a 10 s average |
| UHSAS1-2_MBL_aerosolsize_fig11.csv | Diameters corresponding to the number-based and volume- based dry aerosol size distribution, measured by UHSAS -1 TD and UHSAS-2 in the MBL and in the free troposphere |
| UHSAS2_pressure_PSL_figS1.csv | UHSAS-2 bin number corresponding to four PSL size standards (81, 125, 240, and 400 nm) and uncertainties (sizing response to pressure change as a function of bin number) |
Variables in the data files
Blank cells in the files indicate missing or no data values due to in-flight filter checks or sizing validation checks. Periods of in-cloud measurement were excluded from the reported data due to aerosol sampling artifacts caused by droplets or ice crystals impacting the inlet, which produced spurious counts in the UHSAS instruments.
Table 3. Variables in the file UHSAS2_diam_binnum_PSL_AS_DOS_limon_fig3.csv. Note: tests were from UHSAS-2 (not thermodenuded)
| Column name | Units/format | Description |
|---|---|---|
| AS_bin | Bin number of the UHSAS-2 that corresponds to the selected particle diameter, here ammonium sulfate | |
| AS_bin_stdev | Uncertainty of the UHSAS-2 bin number | |
| AS_diam | nm | Ammonium sulfate particle diameter |
| AS_diam_stdev_minus | nm | Uncertainty of the particle diameter (lower) |
| AS_diam_stdev_plus | nm | Uncertainty of the particle diameter (higher) |
| AS_sizingcal_bin | Fitted sizing calibration bin number | |
| AS_sizingcal_diam | nm | Fitted sizing calibration diameter |
| DOS_bin | Bin number of the UHSAS-2 that corresponds to the selected particle diameter, here dioctyl sebacate | |
| DOS_sizingcal_diam | nm | Fitted sizing calibration diameter |
| DOS_diam | nm | Dioctyl sebacate particle diameter |
| DOS_sizingcal_bin | Fitted sizing calibration bin number | |
| Limon_bin | Bin number of the UHSAS-2 that corresponds to the selected particle diameter, here limonene oxidation product | |
| Limon_diam | nm | Limonene oxidation product particle diameter |
| Limon_sizingcal_bin | Fitted sizing calibration bin number | |
| Limon_sizingcal_diam | nm | Fitted sizing calibration diameter |
| PSL_bin | Bin number of the UHSAS-2 that corresponds to the selected particle diameter, here polystyrene latex | |
| PSL_bin_stdev | Uncertainty of the bin number | |
| PSL_diam | nm | Polystyrene latex particle diameter |
| PSL_diam_stdev | nm | Uncertainty of the particle diameter |
| PSL_sizingcal_bin | Fitted sizing calibration bin number | |
| PSL_sizingcal_diam | nm | Fitted sizing calibration diameter |
Table 4. Variables in the file UHSAS2_mobility_eqv_AS_DOS_fig4.csv
| Column name | Units/format | Description |
|---|---|---|
| AS_det_eff | Fitted detection efficiency curve with which UHSAS-2 counts particles of a given diameter (used to guide the eye), here for ammonium sulfate particles | |
| AS_det_eff_diam | Diameter corresponding to the fitted detection efficiency curve | |
| AS_diam | nm | Ammonium sulfate mobility equivalent diameter |
| AS_diam_uncert_minus | nm | Uncertainty of the mobility equivalent particle diameter (lower) |
| AS_diam_uncert_plus | nm | Uncertainty of the mobility equivalent particle diameter (higher) |
| AS_uhsas_cpc_ratio | ratio | Efficiency with which UHSAS-2 counts particles of a given diameter |
| AS_uhsas_cpc_ratio_uncert | ratio | Uncertainty of the efficiency with which UHSAS counts particles of a given diameter |
| DOS_det_eff | Fitted detection efficiency curve with which UHSAS counts particles of a given diameter (used to guide the eye), here for dioctyl sebacate particles | |
| DOS_det_eff_diam | Diameter corresponding to the fitted detection efficiency curve | |
| DOS_diam | nm | Mobility equivalent diameter |
| DOS_diam_uncert_minus | nm | Uncertainty of the mobility equivalent particle diameter (lower) |
| DOS_diam_uncert_plus | nm | Uncertainty of the mobility equivalent particle diameter (higher) |
| DOS_uhsas_cpc_ratio | ratio | Efficiency with which UHSAS-2 counts particles of a given diameter |
| DOS_uhsas_cpc_ratio_uncert | ratio | Uncertainty of the efficiency with which UHSAS-2 counts particles of a given diameter |
Table 5. Variables in the file UHSAS2_cpc_AS_conc_fig5.csv
| Column name | Units/format | Description |
|---|---|---|
| Line1_to_1x | Line showing a 1:1 relationship, x-axis | |
| Line1_to_1y | Line showing a 1:1 relationship, y-axis | |
| Ex_Conc_cpc_uncert | cm-3 | Uncertainty of particle number concentration measured by a CPC |
| Ex_Conc_uhsas_uncert | cm-3 | Uncertainty of particle number concentration measured by UHSAS-2 |
| Ex_Conc_cpc_lt | cm-3 | Particle number concentration measured by CPC (live-time corrected) |
| Ex_Conc_uhsas | cm-3 | Particle number concentration measured by the UHSAS-2 |
| Ex_Conc_uhsas_lt | cm-3 | Particle number concentration live-time corrected measured by the UHSAS-2 |
| Ex_Diam | nm | Particle diameter |
| Conc_cpc_lt | cm-3 | Particle number concentration measured by condensation particle counter (CPC, live-time corrected) |
| Conc_cpc_uncert | cm-3 | Uncertainty of particle number concentration measured by a CPC |
| Conc_uhsas | cm-3 | Particle number concentration measured by the UHSAS |
| Conc_uhsas_lt | cm-3 | Particle number concentration live-time corrected measured by the UHSAS |
| Conc_uhsas_lt_uncert | cm-3 | Uncertainty of particle number concentration measured by UHSAS |
| Diam | nm | Particle diameter |
Table 6. Variables in the file thermodenuder_temp_AS_NaCL_limon_fig7.csv
| Column name | Units/format | Description |
|---|---|---|
| AS_fit_150nm | Fitted curve to guide the eye | |
| AS_TD_temp_150nm | Degrees C | Temperature of the thermodenuder for ammonium sulfate particles with diameters equal to 150 nm |
| AS_uhsas_norm_150nm | ratio | Concentration measured by the UHSAS-1 normalized to the concentration measured by UHSAS-1 at room temperature |
| AS_fit_250nm | Fitted curve to guide the eye | |
| AS_TD_temp_250nm | Degrees C | Temperature of the thermodenuder for ammonium sulfate particles with diameters equal to 250 nm |
| AS_uhsas_norm_250nm | ratio | Concentration measured by the UHSAS-1 normalized to the concentration measured by UHSAS-1 at room temperature |
| TD_300degx | Degrees C | Indicates the operating temperature of the thermodenuder equal to 300 degrees C, x axis |
| TD_300degy | Degrees C | Indicates the operating temperature of the thermodenuder equal to 300 degrees C, y axis |
| AS_fit_500nm | Fitted curve to guide the eye | |
| AS_uhsas_norm_500nm | ratio | Concentration measured by the UHSAS-1 normalized to the concentration measured by UHSAS-1 at room temperature |
| AS_TD_temp_500nm | Degrees C | Temperature of the thermodenuder for ammonium sulfate particles with diameters equal to 500 nm |
| Limon_TD_temp_250nm | degrees C | Temperature of the thermodenuder for limonene oxidation product particles with diameters equal to 250 nm |
| Limon_uhsas_norm_250nm | ratio | Concentration measured by the UHSAS-1 normalized to the concentration measured by UHSAS-1 at room temperature |
| Limon_fit_250nm | Fitted curve to guide the eye | |
| NaCl_fit_150nm | Fitted curve to guide the eye | |
| NaCl_TD_temp_150nm | degrees C | Temperature of the thermodenuder for sodium chloride particles with diameters equal to 150 nm |
| NaCl_uhsas_norm_150nm | ratio | Concentration measured by the UHSAS-1 normalized to the concentration measured by UHSAS-1 at room temperature |
Table 7. Variables in the file UHSAS2_vol_AS_DOS_PSL_fig8.csv
Note: These calculated data are from flight data, February 10, 2017, 1-s measurements. The data are calculated aerosol volume from the UHSAS-2 measured dry size distributions based on calibration particles with refractive indices between 1.44 and 1.58: AS (n D1.52), DOS (n D1.44), and PSL (n D1.58).
| Column name | Units/format | Description |
|---|---|---|
| AS_vol_uhsas | µm3 cm-3 | Calculated aerosol volume from the UHSAS-2 measured dry size distributions based on ammonium sulfate calibration particles |
| DOS_vol_fit_uhsas | Fit to DOS and AS-based aerosol volume | |
| DOS_vol_uhsas | µm3 cm-3 | Calculated aerosol volume from the UHSAS-2 measured dry size distributions based on dioctyl sebacate calibration particles |
| PSL_vol_fit_uhsas | Fit to PSL and AS-based aerosol volume | |
| PSL_vol_uhsas | µm3 cm-3 | Calculated aerosol volume from the UHSAS-2 measured dry size distributions based on polystyrene latex calibration particles |
| Line1_to_1x | Line showing a 1:1 relationship, x-axis | |
| Line1_to_1y | Line showing a 1:1 relationship, y-axis |
Table 8. Variables in the file UHSAS2_PSL_bin_num_fig9.csv
| Column name | Units/format | Description |
|---|---|---|
| U2bin_PSL_81nm | UHSAS-2 fitted peak bin number corresponding to PSL size standard equal 81 nm | |
| U2bin_PSL_125nm | UHSAS-2 fitted peak bin number corresponding to PSL size standard equal 125 nm | |
| U2bin_PSL_240nm | UHSAS-2 fitted peak bin number corresponding to PSL size standard equal 240 nm | |
| U2bin_PSL_400nm | UHSAS-2 fitted peak bin number corresponding to PSL size standard equal 400 nm | |
| U2_Date | Date when sizing calibration check using PSL mix was undertaken |
Table 9. Variables in the file UHSAS1-2_ATom1_particles_fig10.csv
| Column name | Units/format | Description |
|---|---|---|
| Figure 10a | ||
| N_fit_x | Fitted line, x-axis | |
| N_fit_y | Fitted line, y-axis | |
| N_Psamp | hPa | Sample pressure |
| N_U1 | Number of particles measured by UHSAS-1 | |
| N_U1_uncert | Uncertainty of the number of particles measured by UHSAS-1 | |
| N_U2 | Number of particles measured by UHSAS-2 | |
| N_U2_uncert | Uncertainty of the number of particles measured by UHSAS-2 | |
| Figure 10b | ||
| S_fit_x | Fitted correlation between particle surface area from UHSAS-1 and UHSAS-2 instrument, x-axis | |
| S_fit_y | Fitted correlation between particle surface area from UHSAS-1 and UHSAS-2 instrument, z-axis | |
| S_Psamp | hPa | Sample pressure |
| S_U1 | µm2 cm-3 | Calculated particle surface area from UHSAS-1 |
| S_U1_uncert | Uncertainty of the calculated particle surface area from UHSAS-1 | |
| S_U2 | Calculated particle surface area from UHSAS-2 | |
| S_U2_uncert | Uncertainty of the calculated particle surface area from UHSAS-2 | |
| Figure 10c | ||
| V_fit_x | Fitted correlation between the calculated particle volume from UHSAS-1 and UHSAS-2 instrument, x-axis | |
| V_fit_y | Fitted correlation between the calculated particle volume from UHSAS-1 and UHSAS-2 instrument, y-axis | |
| V_Pamp | hPa | Sample pressure |
| V_U1 | µm3 cm-3 | Calculated particle volume from UHSAS-1 |
| V_U1_uncert | Uncertainty of the calculated particle volume from UHSAS-1 | |
| V_U2 | µm3 cm-3 | Calculated particle volume from UHSAS-2 |
| V_U2_uncert | Uncertainty of the calculated particle volume from UHSAS-2 |
Table 10. Variables in the file UHSAS1-2_MBL_aerosolsize_fig11.csv
Note: SD refers to size distribution
| Column name | Units/format | Description |
|---|---|---|
| Figure 11a | ||
| U1_N_MBL_diam | µm | Diameter corresponding to the number-based size distribution (dn/dlogd) measured by UHSAS -1 TD (with thermodenuder) in the marine boundary layer |
| U1_N_MBL_SD_TD | cm-3 | Thermodenuded number-based size distribution (dn/dlogd) measured by UHSAS-1-TD in the marine boundary layer |
| U2_N_MBL_diam | µm | Diameter corresponding to the number-based size distribution (dn/dlogd) measured by UHSAS-2 in the marine boundary layer |
| U2_N_MBL_SD | cm-3 | Number-based size distribution (dn/dlogd) measured by UHSAS-2 in the marine boundary layer |
| Figure 11b | ||
| U1_V_MBL_diam | µm | Diameter corresponding to the volume-based size distribution (dv/dlogd) measured by UHSAS-1-TD (with thermodenuder) in the marine boundary layer |
| U1_V_ MBL_SD_TD | µm3 cm-3 | Thermodenuded volume-based size distribution (dv/dlogd) measured by UHSAS-1-TD in the marine boundary layer |
| U2_V_ MBL_SD | µm3 cm-3 | Volume-based size distribution (dv/dlogd) measured by UHSAS-2 in the marine boundary layer |
| U2_V_ MBL_diam | µm | Diameter corresponding to the volume-based size distribution (dv/dlogd) measured by UHSAS-2 in the marine boundary layer |
| Figure 11c | ||
| U1_N_FT_diam | µm | Diameter corresponding to the number-based size distribution (dn/dlogd) measured by UHSAS-1-TD (with thermodenuder) in the free troposphere |
| U1_N_FT_SD_TD | cm-3 | Thermodenuded number-based size distribution (dn/dlogd) measured by UHSAS-1-TD in the free troposphere |
| U2_N_FT_diam | µm | Diameter corresponding to the number-based size distribution (dn/dlogd) measured by UHSAS-2 in the free troposphere |
| U2_N_FT_SD | cm-3 | Number-based size distribution (dn/dlogd) measured by UHSAS-2 in the free troposphere |
| Figure 11d | ||
| U1_V_FT_diam | µm | Diameter corresponding to the volume-based size distribution (dv/dlogd) measured by UHSAS-1-TD (with thermodenuder) in the free troposphere |
| U1_V_FT_SD_TD | µm3 cm-3 | Thermodenuded volume-based size distribution (dv/dlogd) measured by UHSAS-1-TD in the free troposphere |
| U2_V_FT_diam | µm | Diameter corresponding to the volume -based size distribution (dv/dlogd) measured by UHSAS-2 in the free troposphere |
| U2_V_FT_SD | µm3 cm-3 | Volume -based size distribution (dv/dlogd) measured by UHSAS-2 in the free troposphere |
Table 11. Variables in the file UHSAS2_pressure_PSL_figS1.csv
| Column name | Units/format | Description |
|---|---|---|
| PSL_81nm_bin | UHSAS-2 bin number corresponding to PSL size standard equal 81nm | |
| PSL_125nm_bin | UHSAS-2 bin number corresponding to PSL size standard equal 125nm | |
| PSL_240nm_bin | UHSAS-2 bin number corresponding to PSL size standard equal 240nm | |
| PSL_400nm_bin | UHSAS-2 bin number corresponding to PSL size standard equal 400nm | |
| pressure | hPa | Pressure-tests were performed to evaluate the instrument at reduced pressures. The instrument pressure was adjusted to as low as 250 hPa to investigate possible pressure dependencies |
| PSL_81nm_bin_stdev | Bin uncertainty corresponding to PSL_81nm_bin | |
| PSL_125nm_bin_stdev | Bin uncertainty corresponding to PSL_125nm_bin | |
| PSL_240nm_bin_stdev | Bin uncertainty corresponding to PSL_240nm_bin | |
| PSL_400nm_bin_stdev | Bin uncertainty corresponding to PSL_400nm_bin |
Application and Derivation
Atmospheric aerosol is a key component of the chemistry and climate of the Earth’s atmosphere. Accurate measurement of the concentration of atmospheric particles as a function of their size is fundamental to investigations of particle microphysics, optical characteristics, and chemical processes (Kupc et al., 2018).
The UHSAS instruments are a part of a suite of fast-response aerosol size distribution instruments focusing in particular on the spatial variation in the abundance of particles sized 0.003–4.8 μm (Brock et al., 2018; Williamson et al., 2018). Scientific goals for these instruments include identifying the spatial extent of new particle formation in the remote troposphere and the associated mechanisms and controlling parameters, quantifying the growth of newly formed particles to cloud-active sizes, and determining the importance of aerosols from continental sources to the remote troposphere.
Quality Assessment
Uncertainties in the aerosol volume and surface calculated from atmospheric dry size distributions depend on possible biases associated with the actual refractive index and shape of the particles vs. the calibration aerosol, as well as on random uncertainties associated with counting statistics, flow rate, pressure, sizing precision, and calibration accuracy.
The effect of uncertainty in the refractive index was assessed (n) of ambient particles that are sized by the UHSAS assuming the refractive index of ammonium sulfate (n=1.52). For calibration particles with n between 1.44 and 1.58, the UHSAS diameter varies by +4/-10% relative to ammonium sulfate.
Uncertainties in particle number concentration were limited by counting statistics, especially in the tropical upper troposphere where accumulation-mode concentrations were sometimes < 20 cm-3 (counting rates approx. 5 Hz) at standard temperature and pressure (Kupc et al., 2018).
Data Acquisition, Materials, and Methods
The sizing performance of the UHSAS and the effects of particle composition and concentration were investigated in the laboratory (Fig. 2). Particles with diameters between 0.05 and 1 μm were generated in two ways: (1) by using an atomizer to produce ammonium sulfate (AS), polystyrene latex (PSL) spheres, or dioctyl sebacate (DOS) particles or (2) from new particle formation and condensational growth from limonene ozonolysis products in a flow tube reactor.
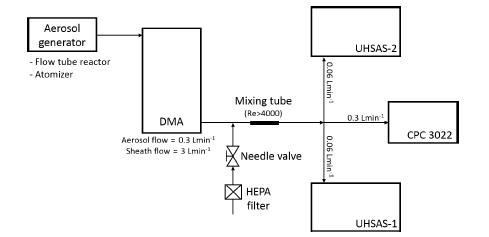
Figure 2. A schematic diagram of the aerosol generation and measurement setup at atmospheric pressure conditions. The calibration aerosol was generated either in a flow tube reactor or the atomizer. Apart from PSL, all atomized particles were sent through a diffusion drier to DMA for size selection, while PSL particles were delivered from the atomizer directly to both UHSAS instruments following dilution with dry air (Kupc et al., 2018).
Modified flow system
The flow system of both UHSAS instruments was modified (Fig. 2). The modifications include installation of a laminar flow element with a differential pressure transducer to directly and precisely measure the time-varying sample volumetric flow rate at the optics block inlet, and replacement of the sheath flow valve with a volumetric flow controller (VFC) to directly monitor and control sheath flow. The Alicat mass flow controller on the exhaust side of the instrument, which is connected to an exhaust line near inlet pressure to control the exhaust flow, was switched to operate in volume flow control mode. The inlet laminar flow meter and differential pressure transducer were calibrated together over a flow range of 0–0.1 L min-1 using a volumetric flow calibration standard (Kupc et al., 2018).
Thermodenuder
A compact thermodenuder was designed and installed in UHSAS-1 to determine the number and volume fraction of volatile particles. This measurement is used to identify particles that are formed from secondary products (e.g., sulfates, nitrates, and organics) from primary particles. Particle losses through the thermodenuder were determined relative to either a TSI 3022A CPC or the second UHSAS instrument.
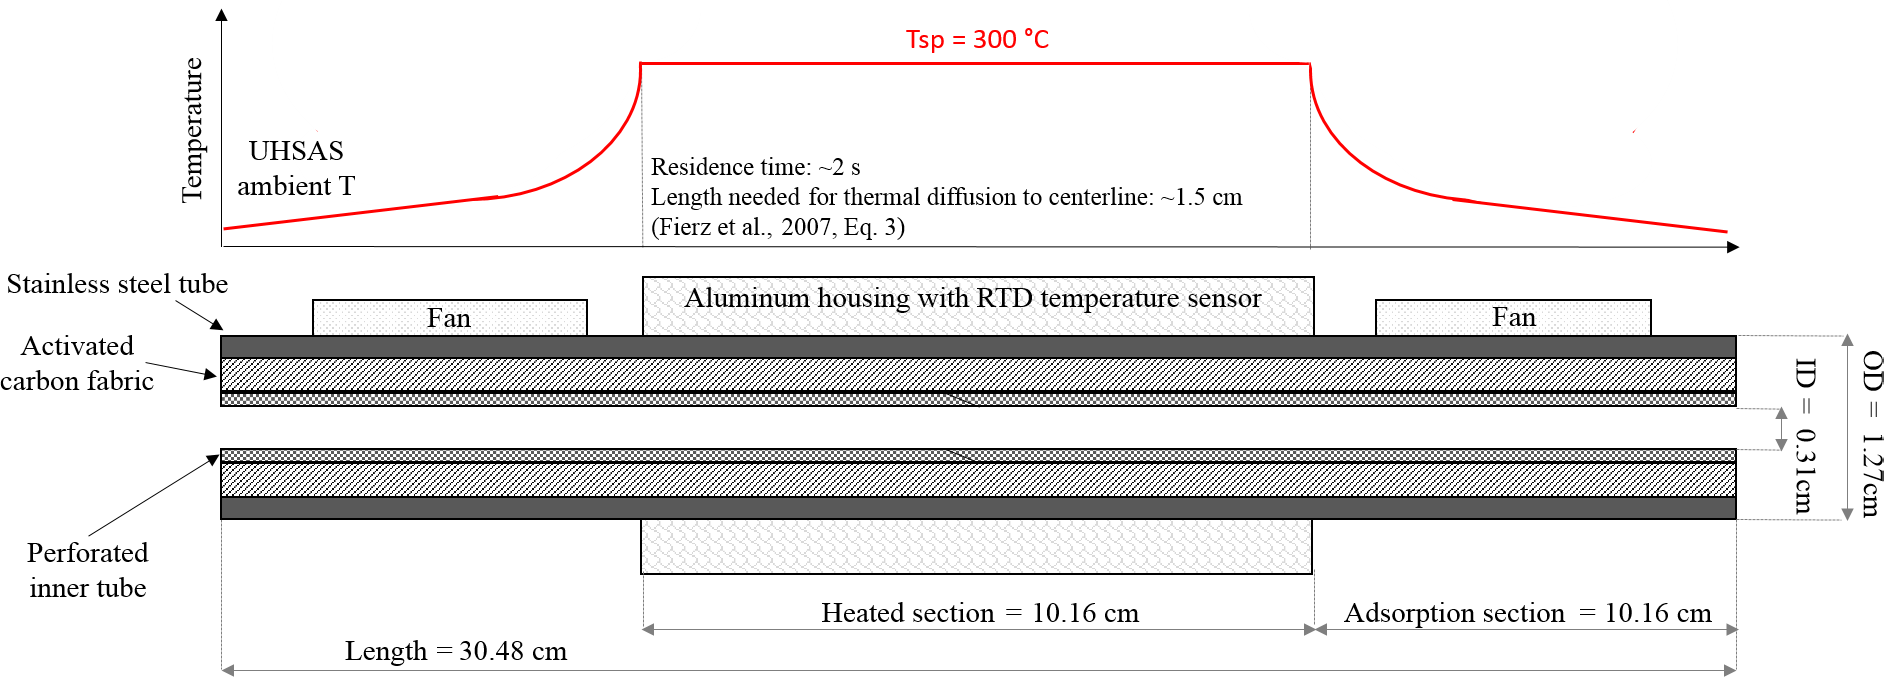
Figure 3. Schematic cross section of the thermodenuder and conceptual temperature profile (Kupc et al., 2018).
The efficiency of volatilizing particles in the thermodenuder was tested using DMA-size-selected particles from the generation of NaCl, AS, and limonene oxidation products at concentrations < 1000 cm-3. The temperature of the thermodenuder was increased in steps from room temperature up to 310 degrees C and the fraction of particles exiting the thermodenuder (relative to the unheated sample) at three different particle sizes was determined. The effect of particle concentration on performance was checked with particles generated from limonene oxidation products at 0.15 μm in diameter and concentrations of up to 11000 cm-3.
Detection efficiency and diameter uncertainties
The detection efficiency, the ratio of concentration of particles of a given size measured by the sum of all bins of the non-thermodenuded UHSAS-2 to that measured by a TSI 3022A CPC, depends on the refractive index of the calibration particles used. The detection efficiency was evaluated for the non-thermodenuded UHSAS as a function of mobility equivalent diameter for AS and DOS particles which varies due to the differing refractive indices of these compounds. The diameter uncertainties were calculated according to the sum in quadrature (square root of the sum of squares) of the sheath flow, pressure, temperature, and voltage uncertainties, and were corrected for the possible sizing bias observed using PSL standards. In a similar manner, the uncertainties in the efficiency were calculated using the UHSAS and CPC uncertainties from the flow and pressure measurements and counting statistics (Kupc et al., 2018).
The effect of pressure on sample flow and particle sizing
Laboratory evaluation of the UHSAS operation at reduced pressure conditions is important for the interpretation and validation of the airborne data during the ATom flights. To investigate possible pressure dependencies, a needle valve and an external pump were used to reduce the instrument pressure. A mixture of four PSL sizes was atomized and measured as instrument pressure was adjusted to as low as 250 hPa. In addition, the effect of changing pressure flow on the sample flow was investigated.
The effect of concentration on particle counting
The UHSAS sensitivity to particle concentration was quantified using atomized AS particles with diameters > 0.1 μm and concentrations between 1 and 104 cm-3. All concentrations and flow rates were at STP conditions.
UHSAS instrument performance measuring dry aerosol size distributions during the ATom-1 and ATom-2 missions
The measured internal UHSAS instrument pressures varied between approximately 1100 (due to ram pressure) and 225 hPa, which corresponded to 0.15-13 km in altitude. The two UHSAS instruments sampled in parallel at 1 Hz downstream of a Nafion dryer that reduced sample RH to < 20 %. Periods of in-cloud measurement were excluded from the reported data due to aerosol sampling artifacts caused by droplets or ice crystals impacting the inlet, which produced spurious counts in the UHSAS instruments.
Consistency of aerosol number concentration, surface, and volume measured by UHSAS-1 and UHSAS-2 were evaluated. During the ATom-1 deployment the thermodenuder on the UHSAS-1 instrument was not operated, allowing for direct comparison between the two UHSAS instruments. Number, surface, and volume concentrations were compared over the diameter range from 0.1 to 0.9 μm to see if the measurements agreed within the estimated uncertainties (Kupc et al., 2018).
Data Access
These data are available through the Oak Ridge National Laboratory (ORNL) Distributed Active Archive Center (DAAC).
ATom: Ultra-High Sensitivity Aerosol Spectrometer Calibration and Performance Data
Contact for Data Center Access Information:
- E-mail: uso@daac.ornl.gov
- Telephone: +1 (865) 241-3952
References
Brock, C., Williamson, C., Kupc, A., Froyd, K., Erdesz, F., Wagner, N., Richardson, M., Schwarz, J. P., Gao, R.-S., Katich, J., Compuzano-Jost, P., Nault, B., Schroder, J. Jimenez, J., Weinzierl, W., Dollner, M., Bui, T., and Murphy D. M. Aerosol size distribution measurements during the Atmospheric Tomography (ATom) mission: methods, uncertainties, and data products, in preparation, Atmos. Meas. Tech., 2018.
Kupc, A., C. Williamson, N.L. Wagner, M. Richardson, and C.A. Brock. 2018. Modification, calibration, and performance of the Ultra-High Sensitivity Aerosol Spectrometer for particle size distribution and volatility measurements during the Atmospheric Tomography Mission (ATom) airborne campaign, Atmos. Meas. Tech., 11, 369-383, https://doi.org/10.5194/amt-11-369-2018
Williamson, C., Kupc, A., Wilson, J., Gesler, D. W., Reeves, J. M., Erdesz, F., McLaughlin, R., and Brock, C. A. 2018. Fast time response measurements of particle size distributions in the 3-60 nm size range with the nucleation mode aerosol size spectrometer, Atmos. Meas. Tech., 11, 3491-3509, https://doi.org/10.5194/amt-11-3491-2018