Documentation Revision Date: 2018-08-06
Data Set Version: 1
Summary
This dataset was generated through an effort to develop a new protocol for merging in situ measurements with 3-D model simulations of atmospheric chemistry so that the most reactive parcels in terms of ozone and methane production and loss can be identified. The six global models were the Community Atmosphere Model (CAM4; National Center for Atmospheric Research), Goddard Earth Observing System-Chem (GEOS-Chem), Geophysical Fluid Dynamics Laboratory (GFDL), Goddard Institute for Space Studies E2.1 (GISS-E2.1), Global Modeling Initiative (GMI; Goddard Space Flight Center), and UCI (UC-Irvine).
This dataset provides one simulated data stream (1 ICARTT format text file), the modeled reactivities for each of the air parcels from the six global atmospheric chemistry models over the 5 days in August (40 tabular text files), and 25 additional text files containing UCI modeled reactivity outputs with varying inputs for sensitivity and uncertainty analyses. For a listing of these sensitivity/uncertainty analyses, see Table 3 in Quality Assessment below.

Figure 1. Latitude by pressure plots of 6 key species from the simulated ATom data stream used in the Prather et al. 2018 study. The data stream was derived by UCI from sampling grid cells intervals for altitudes 0.5 to 12-km (960 to 200 hPa) along the Dateline from an earlier, higher resolution version of the UCI CTM. From Prather et al. 2018.
Citation
Prather, M.J., C.M. Flynn, A. Fiore, G. Correa, S.A. Strode, S.D. Steenrod, L.T. Murray, and J.-F. Lamarque. 2018. ATom: Simulated Data Stream for Modeling ATom-like Measurements. ORNL DAAC, Oak Ridge, Tennessee, USA. https://doi.org/10.3334/ORNLDAAC/1597
Table of Contents
- Data Set Overview
- Data Characteristics
- Application and Derivation
- Quality Assessment
- Data Acquisition, Materials, and Methods
- Data Access
- References
Data Set Overview
This dataset provides a simulated data stream representative of an Atmospheric Tomography mission (ATom) data collection flight and also modeled reactivities for ozone (O3) production and loss and methane (CH4) loss from six global atmospheric chemistry models: CAM, GEOS-Chem, GFDL, GISS-E2.1, GMI, and UCI. The simulated data include concentrations of selected atmospheric trace gases for 14,880 air parcels along a simulated north-south ATom flight path along 180-degrees longitude over the Pacific basin. Each of the six models produced ozone production and loss and methane loss reactivities initialized using the simulated data beginning with five different days in August (8-01, 8-06, 8-11, 8-16, 8-21). Modeled years for each individual model varied from 1997 to 2016.
The Atmospheric Tomography Mission (ATom) is a NASA Earth Venture Suborbital-2 mission. It will study the impact of human-produced air pollution on greenhouse gases and on chemically reactive gases in the atmosphere. ATom deploys an extensive gas and aerosol payload on the NASA DC-8 aircraft for systematic, global-scale sampling of the atmosphere, profiling continuously from 0.2 to 12 km altitude. Flights will occur in each of 4 seasons over a 4-year period.
Related Publications:
Michael J. Prather, Clare M. Flynn, Xin Zhu, Stephen D. Steenrod, Sarah A. Strode, Arlene M. Fiore, Gustavo Correa, Lee T. Murray, Jean-Francois Lamarque. 2018. How well can global chemistry models calculate the reactivity of short-lived greenhouse gases in the remote troposphere, knowing the chemical composition? Atmospheric Measurement Techniques. https://dx.doi.org/10.5194/amt-2017-470.
Michael J. Prather, Xin Zhu, Clare M. Flynn, Sarah A. Strode, Jose M. Rodriguez, Stephen D. Steenrod, Junhua Liu, Jean-Francois Lamarque, Arlene M. Fiore, Larry W. Horowitz, Jingqiu Mao, Lee T. Murray, Drew T. Shindell, and Steven C. Wofsy. 2018. Global atmospheric chemistry – which air matters? Atmos. Chem. Phys., 17, 9081-9102. https://dx.doi.org/10.5194/acp-17-9081-2017.
Acknowledgements:
This work was supported by the National Aeronautics and Space Administration’s Earth Venture program by grants NNX15AJ23G and NNX15AG57A.
Data Characteristics
Spatial Coverage: A simulated north-south ATom flight along 180-degrees longitude, from 60-degrees north to 60-degrees south.
Spatial Resolution: Point measurements
Temporal Coverage:
Simulated data stream was sampled at 00 UTC 15 August 2005.
Model year for each of the simulations were selected by the model based on available meteorological data. Outputs range from 1997-08-01 to 2016-08-21. Model results were produced for each model run for five days in August: 8-01, 8-06, 8-11, 8-16, 8-21.
Temporal Resolution:
1 day as 24-hour integrated reactivities. This set of 14,880 points is similar in number to 10-second data from an aircraft mission logging 50 flight hours in the Pacific basin, such as each seasonal deployment of ATom.
Study Area: (These coordinates are the approximate locations of the study sites and may not match the extent of the data files. All latitude and longitude are given in decimal degrees.)
| Site | Northern Extent | Southern Extent | Eastern Extent | Western Extent |
|---|---|---|---|---|
| Simulated ATom flight | 60 | -60 | 179 | -179 |
Data File Information:
This dataset includes 66 data files: one simulated data stream in ICARTT format (ATomSim_20160816_R1.ict), and 65 files (text tables; *.csv and *.ict) containing reactivities and photolysis rates from six different atmospheric chemistry models for the 14,880 air parcels along the simulated flight path.
Each model produced reactivities initialized using the simulated data beginning with five different days in August (8-01, 8-06, 8-11, 8-16, 8-21). Output years were determined by the model and ranged from 1997 to 2016.
Simulated data stream
The simulated data stream is a tomographic sampling of air parcels selected from a high-resolution chemistry-transport model (UCI model v72a), meant to simulate what the ATom mission might measure. The data represent 14,880 air parcels sampled along a north-south flight track at 180-degrees longitude. Names, units, and descriptions for each of the variables included in the simulated stream are described in Table 1 below.
Table 1. Simulated data stream variable names, units, and descriptions.
| Variable name | Units | Description |
|---|---|---|
| Start_UTC | seconds | number of seconds from 0000 UTC of data stream start |
| Stop_UTC | seconds | number of seconds from 0000 UTC of data stream stop |
| ATom_parcel | unique identifier for air parcel (integer) | |
| ATom_air | kg | air mass of parcel (scientific notation) |
| DLat | degrees north | latitude |
| DLon | degrees east | longitude |
| Pres | hPa | pressure |
| Temp | degrees K | temperature |
| SpecHum | kg H2O per kg air | specific humidity |
| O3_ppb | ppb | mole fraction of ozone |
| NOx_ppt | ppt | mole fraction sum of NO+NO2 |
| HNO3_ppt | ppt | mole fraction of nitric acid [HONO2] |
| HNO4_ppt | ppt | mole fraction of pernitric acid [HO2NO2] |
| PAN_ppt | ppt | mole fraction of peroxyacetylnitrate [C2H3NO5] |
| MeNO3_ppt | ppt | mole fraction of methylnitrate [CH3ONO2] |
| HCHO_ppt | ppt | mole fraction of formaldehyde |
| H2O2_ppt | ppt | mole fraction of hydrogen peroxide |
| MeOOH_ppt | ppt | mole fraction of methyl-hydrogen peroxide [CH3OOH] |
| EtOOH_ppt | ppt | mole fraction of ethyl-hydrogen peroxide [C2H5OOH] |
| CO_ppb | ppb | mole fraction of carbon monoxide |
| CH4_ppb | ppb | mole fraction of methane |
| C2H6_ppt | ppt | mole fraction of hydrogen peroxide |
| CH3COCH3_ppt | ppt | mole fraction of acetone |
| MeCHO_ppt | ppt | mole fraction of acetaldehyde [CH3C(O)H] |
| MeCO3_ppt | ppt | mole fraction of peroxy acetyl [CH3C(O)OO] |
| Alkane_ppt | ppt | mole fraction of all alkanes C3 and higher |
| Alkene_ppt | ppt | mole fraction of all alkenes [ethene, propene, ...] |
| Aromatic_ppt | ppt | mole fraction of all aromatics [benzene, toluene, xylene, ...] |
| Isoprene_ppt | ppt | mole fraction of isoprene [C5H8] |
Modeled reactivities
Reactivities (as defined in Table 2) from each of the 65 model simulations of the simulated data stream of air parcels are provided as tabular text files. Names, units, and descriptions for variables common to all model outputs are described in Table 2, although some model outputs contain more variables than listed in the Table. Every model has a different grid and each model overwrote their restart files, replacing a grid cell nearest the specified parcel (latitude, longitude, pressure) from the data stream without overwriting any previously placed parcel. For most model cases, the reactivities are calculated for five different days in August (8-01, 8-06, 8-11, 8-16, 8-21) in order to account for uncertainty inherent in the day-to-day variability of clouds experienced by each air parcel. Output years were determined by the model and ranged from 1997 to 2016. Participant models are Table 4 below.
The UCI model was run several times under different configurations. Please refer to Prather et al. (2017 & 2018) and Table 3 below for additional information regarding model outputs and simulations.
Model outputs follow the naming conventions prescribed by each of the models
CAM and GEOS-Chem: <Chemical model>_<Meteorology>-<Resolution>_<Date>_ATomA2_0000h.csv
where <Meteorology> is either MERRA or MERRA-2.
GFDL: GFDL_<Date>.AM3.ATom.rr.table.csv
GISS: GISS-ModelE2.1_MERRA_F40_<Date>_ATomA2_0000h.csv
GMI: GMI_<Date>_R2.ict *
UCI: UCI_<Day>T159Q72D<Year>H00.csv
* Note: GMI outputs are in the ICARTT standard text format. The rest of the model outputs are in CSV format.
Table 2. Variable names, units, and descriptions for model outputs.
| Variable name | Units | Description |
|---|---|---|
| Start_UTC | seconds | number of seconds from 0000 UTC of modeled reactivities start |
| Stop_UTC | seconds | number of seconds from 0000 UTC of modeled reactivities stop |
| ATom_parcel | unique identifier for air parcel (integer) | |
| DLat | degrees north | latitude |
| DLon | degrees east | longitude |
| Pres | hPa | pressure |
| O3P | ppt | ozone production through the following reactions: (a) HO2 + NO → NO2 + OH; (b) RO2 + NO → NO2 + RO |
| O3L | ppt | ozone loss through the following reactions: (a) O3 + OH → O2 + HO2; (b) O3 + HO2 → HO + O2 + O2; (c) O3 + HO2 → HO + O2 + O2 |
| CH4L | ppt | methane loss through the following reaction: (a) CH4 + OH → CH3 + H2O |
| JNO2 | ppt/second | photolysis rate: NO2+ hv → NO + O |
| JO31d | ppt/second |
photolysis rate: O3+ hv → O2 + O(1D) |
Companion Files
MATLAB code and figures by Prather et al. (2018) used to generate and analyze this dataset are included in Supplemental_Prather_et_al_2018.zip. The readme.txt included in the zip provides general information about each of the files and points to the specific ICARTT and text data tables to which they pertain. Please refer to Prather et al. 2018 for more information.
Application and Derivation
This dataset was generated as part of an effort to develop a new protocol for merging in situ measurements with 3-D model simulations of atmospheric chemistry so that the most reactive parcels in terms of ozone and methane production and loss can be identified. Future data collected through the ATom campaigns will allow researchers to examine whether models constrained by such measurements agree on chemical budgets for ozone, methane, and other important greenhouse gases and aerosols.
Quality Assessment
One source of uncertainty is inherent is the day-to-day variability of clouds experienced by each air parcel over 24 hours in the model simulations. To smooth this variability, each model provided reactivities using the same chemical initialization for five different days in August: 8/1, 8/6, 8/11, 8/16, and 8/21. The five day variance proved similar across all six models, indicating a lower limit on the detection of model-to-model differences.
Other uncertainties not addressed with the standard protocol of 5-day runs were examined using the additional sensitivity calculations provided only with the UCI model. These are described in Table 3. Please see Prather et al. (2018) for further explanation of uncertainty considerations.
Table 3. Alternate versions of the UCI model result to test uncertainty in the protocol.
| Test | Uncertainty or sensitivity | Description of run | Output files |
|---|---|---|---|
| 1a | How do 5-day means vary from year to year? | Run for model year 2015 | UCI_2xxT159Q72D2015H00.ict (xx = 13, 18, 23, 28, 31) |
| 1b | How do 5-day means vary for a different year? | Run for model year 1997, a big El Niño year | UCI_2xxT159Q72D1997H00.ict (xx = 13, 18, 23, 28, 31) |
| 2 | Model restart files affect ozone and aerosol profiles outside of the overwritten cells for the air parcels. Does this alter results? | Run with a different restart file | UCIv_2xxT159Q72D2016H00_restrt233.ict (xx = 13, 18, 23, 28, 31) |
| 3 | What if 24-hour reactivity integrations begin at midnight rather than noon? | Re-run one day with the sun shifted by 12 hr, keeping the cloud fields at the same sun angles | UCIv_228T159Q72D2016H12.ict |
| 4 | What if the solar declination is held fixed over the 5 days in August? | Re-run year 2015 with the solar declination fixed at that of August 11 | UCIv_2xxT159Q72D2015H00SOLDEC8-11.ict (xx = 13, 18, 23, 28, 31) |
| 5 | What if there were no clouds? | Re-run without clouds. | UCIv_2xxT159Q72D2016H00clear.ict (xx = 13, 18, 23, 28, 31) |
| 6 | What if clouds were simply averaged as in most models? | Re-run using averaged clouds over each grid cell, instead of using UCI’s cloud overlap method. | UCIv_2xxT159Q72D2016H00avcld.ict (xx = 13, 18, 23, 28, 31) |
| 7 | NCAR uses its own temperature and water vapor (T&q) for the air parcels instead of the given parcel values | Re-run one day with UCI using NCAR’s T, and then T&q. | UCIv_228T159Q72D2016H00ncarT.ict UCIv_228T159Q72D2016H00ncarTQ.ict |
| 8 | GFDL uses its own temperature and water vapor (T&q) for the air parcels instead of the given parcel values | Re-run one day with UCI using GFDL’s T, and then T&q. | UCIv_228T159Q72D2016H00gfdlT.ict UCIv_228T159Q72D2016H00gfdlTQ.ict |
Data Acquisition, Materials, and Methods
Simulated ATom Data
The simulated data stream meant to represent data collected by the ATom mission was prepared from an older version of the UCI model (v72a) with higher than usual resolution (~0.55 degrees) and sampled at 00UTC 15 August 2005 at aircraft flight levels along 3 meridians next to 180E. All the model grid cells are used with no attempt to follow ATom profiling. The set of 14,880 points is similar in number to 10-second data from an aircraft mission logging 50 flight hours in the Pacific basin, such as for each seasonal deployment of ATom. Prescribed species are: O3, NOx (=NO+NO2), HNO3, HNO4, PAN (peroxyacetyl nitrate), RNO3 (CH3NO3 and all alkyl nitrates), HOOH, ROOH (CH3OOH and smaller contribution from C2H5OOH), HCHO, CH3CHO (acetaldehyde), C3H6O (acetone), CO, CH4, C2H6, alkanes (all C3H8 and higher), alkenes (all C2H4 and higher), aromatics (benzene, toluene, xylene), C5H8 (isoprene plus terpenes), plus temperature (T) and specific humidity (q).
Chemistry models and simulations
The six global chemical transport models that were used to generate the reactivities are the Community Atmosphere Model (CAM4; National Center for Atmospheric Research), Goddard Earth Observing System-Chem (GEOS-Chem), Geophysical Fluid Dynamics Laboratory (GFDL), Goddard Institute for Space Studies E2.1 (GISS-E2.1), Global Modeling Initiative (GMI; Goddard Space Flight Center), UCI (UC-Irvine). General information about the models is included in Table 4.
Table 4. Participating models and meteorological data (from Prather et al., 2018)
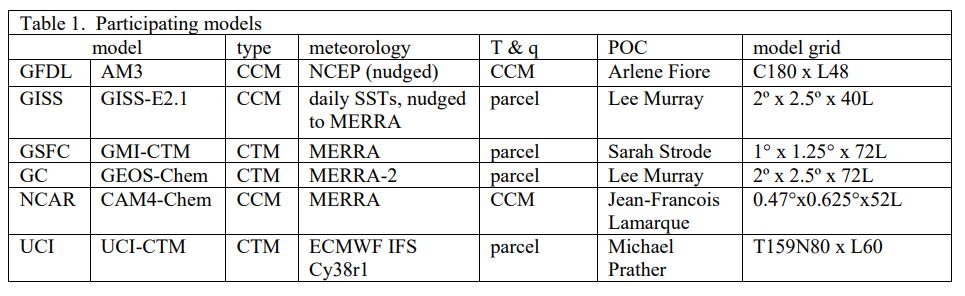
The model outputs included in this dataset were generated to examine the agreement of tropospheric ozone production and loss (O3P, O3L) and methane loss (CH4L) between the six models. A definition and example of these reactivities, plus how they can be calculated within a 3D chemistry-climate or chemistry transport, is found in Prather et al. 2017.
Sensitivity and Uncertainty Testing
Additional model sensitivity and uncertainty test runs were performed by the UCI Team. These model outputs (35 files total) are included in the same folder with the standard UCI runs (UCI_<Day>T159Q72D<Year>H00.csv) but have different filenames that indicate the test being performed. See Table 3.
Data Access
These data are available through the Oak Ridge National Laboratory (ORNL) Distributed Active Archive Center (DAAC).
ATom: Simulated Data Stream for Modeling ATom-like Measurements
Contact for Data Center Access Information:
- E-mail: uso@daac.ornl.gov
- Telephone: +1 (865) 241-3952
References
Michael J. Prather, Clare M. Flynn, Xin Zhu, Stephen D. Steenrod, Sarah A. Strode, Arlene M. Fiore, Gustavo Correa, Lee T. Murray, Jean-Francois Lamarque. 2018. How well can global chemistry models calculate the reactivity of short-lived greenhouse gases in the remote troposphere, knowing the chemical composition? Atmospheric Measurement Techniques. https://dx.doi.org/10.5194/amt-2017-470.
Michael J. Prather, Xin Zhu, Clare M. Flynn, Sarah A. Strode, Jose M. Rodriguez, Stephen D. Steenrod, Junhua Liu, Jean-Francois Lamarque, Arlene M. Fiore, Larry W. Horowitz, Jingqiu Mao, Lee T. Murray, Drew T. Shindell, and Steven C. Wofsy. 2017. Global atmospheric chemistry – which air matters? Atmos. Chem. Phys., 17, 9081-9102. https://dx.doi.org/10.5194/acp-17-9081-2017.