Documentation Revision Date: 2020-04-13
Dataset Version: 1
Summary
The ATom mission deployed an extensive gas and aerosol payload on the NASA DC-8 aircraft for systematic, global-scale sampling of the atmosphere, profiling continuously from 0.2 to 12 km altitude. Flights occurred in each of 4 seasons from 2016 to 2018.
This dataset includes 131 files in comma-delimited text (ICARTT) format, with three data files per flight.
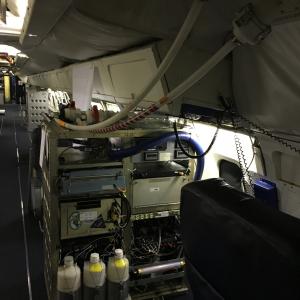
Figure 1. The SAGA installation onboard the DC-8 - AFRC aircraft.
Citation
Dibb, J.E. 2019. ATom: Measurements of Soluble Acidic Gases and Aerosols (SAGA). ORNL DAAC, Oak Ridge, Tennessee, USA. https://doi.org/10.3334/ORNLDAAC/1748
Table of Contents
- Dataset Overview
- Data Characteristics
- Application and Derivation
- Quality Assessment
- Data Acquisition, Materials, and Methods
- Data Access
- References
Dataset Overview
Soluble acidic gases and aerosols (SAGA) were collected with two related installations; a mist chamber/ion chromatography (MC/IC) system and a paired bulk aerosol system. The MC/IC system measures in situ atmospheric distributions of nitric acid (plus < 1 um NO3 aerosol) and fine (< 1 um) aerosol sulfate at an approximately 80-second interval. The paired bulk aerosol system collects particulates onto filters for subsequent analysis. Collected filters were first extracted with water to obtain the water-soluble (WS) constituents and then extracted again using methanol to collect the methanol soluble (MS) fraction. The light absorption of filtered extracts was measured from 300 to 700 nm. Ion chromatography on aqueous extracts of the bulk aerosol samples collected on Teflon filters were used to quantify soluble ions (Cl-, Br-, NO3-, SO42-, C2O42-, Na+, NH4+, K+, Ca+, and Mg+). The SAGA system is provided by the University of New Hampshire (UNH).
The ATom mission deployed an extensive gas and aerosol payload on the NASA DC-8 aircraft for systematic, global-scale sampling of the atmosphere, profiling continuously from 0.2 to 12 km altitude. Flights occurred in each of 4 seasons from 2016 to 2018.
Project: Atmospheric Tomography Mission
The Atmospheric Tomography Mission (ATom) was a NASA Earth Venture Suborbital-2 mission. It studied the impact of human-produced air pollution on greenhouse gases and on chemically reactive gases in the atmosphere. ATom deployed an extensive gas and aerosol payload on the NASA DC-8 aircraft for systematic, global-scale sampling of the atmosphere, profiling continuously from 0.2 to 12 km altitude. Flights occurred in each of four seasons over a 4-year period.
Related Datasets
Wofsy, S.C., et al. 2018. ATom: Merged Atmospheric Chemistry, Trace Gases, and Aerosols. ORNL DAAC, Oak Ridge, Tennessee, USA. https://doi.org/10.3334/ORNLDAAC/1581
Wofsy, S.C., and ATom Science Team. 2018. ATom: Aircraft Flight Track and Navigational Data. ORNL DAAC, Oak Ridge, Tennessee, USA. https://doi.org/10.3334/ORNLDAAC/1581
Data Characteristics
Spatial Coverage: Global. Flights circumnavigate the globe, primarily over the oceans
Spatial Resolution: Point measurements
Temporal Coverage: Periodic flights occurred during each campaign
Temporal Resolution: varies by sample and analysis type
Table 1. Flight campaign schedule
| Deployment | Date Range |
|---|---|
| ATom-1 | July 29 - August 23, 2016 |
| ATom-2 | January 26 - February 21, 2017 |
| ATom-3 | September 28 - October 28, 2017 |
| ATom-4 | April 24 - May 21, 2018 |
Data File Information
This dataset includes 131 files in comma-delimited text (ICARTT) format, with three files per flight date for all four ATom flight campaigns. Data files conform to the ICARTT File Format Standards V1.1.
File names are structured as SAGA-X_DC8_YYYYMMDD_R#.ict, where X is the denotes the measurement type and YYYYMMDD is the start date (in UTC time) of the flight, and R# is the file version or revision number.
The measurements types include:
MC = Measured by Mist Chamber Ion Chromatography, Nitric acid (and submicron NO3 aerosol) and fine aerosol sulfate
Abs = light absorption measurements of filter extracts
AERO = ionic composition of aerosol filter extractions
| Data Files | Description |
|---|---|
| SAGA-MC_DC8_YYYYMMDD_R#.ict. | In situ UNH Mist Chamber/Ion Chromatography measurements include Nitric acid (and submicron NO3 aerosol) and fine (< 1 um) aerosol sulfate. |
| SAGA-Abs_DC8_YYYYMMDD_R#.ict. | Filter extracts light absorption. Water soluble (WS) and methanol soluble (MS) extracts are in the same file. |
| SAGA-AERO_DC8_YYYYMMDD_R#.ict. | Bulk aerosol filter extractions ionic composition by ion chromatography. |
Data File Details
Missing data are indicated by -9999.000.
Table 2. Variables in the data files SAGA-MC_DC8_YYYYMMDD_R#.ict.
| Name | Units | Description |
|---|---|---|
| UTC_Start_SAGA | seconds | seconds since midnight UTC |
| UTC_Stop_SAGA | seconds | seconds since midnight UTC |
| UTC_Mid_SAGA | seconds | seconds since midnight UTC |
| HNO3+submicron-NO3_SAGA | pptv | volume mixing ratio of nitric acid and submicron nitrate |
| Sulfate_lt_1um_MCIC | ug_sm-3 | mass concentration of aerosol sulfate for particle diameter less than 1 um |
Table 3. Variables in the data files SAGA-Abs_DC8_YYYYMMDD_R#.ict. The “WS” prefix denotes values for the Water Soluble Extract. The “MS” prefix denotes values for the Methanol Soluble Extract. Both sets of measurements are in the same file. Water-soluble organic carbon is the last variable in this file.
| Name | Units | Description |
|---|---|---|
| Start_UTC | seconds | seconds since midnight UTC |
| Stop_UTC | seconds | seconds since midnight UTC |
| WS_Abs_300nm | Mm-1 | light absorption at 300 nanometers |
| WS_Abs_320nm | Mm-1 | light absorption at 320 nanometers |
| WS_Abs_340nm | Mm-1 | light absorption at 340 nanometers |
| WS_Abs_360nm | Mm-1 | light absorption at 360 nanometers |
| WS_Abs_380nm | Mm-1 | light absorption at 380 nanometers |
| WS_Abs_400nm | Mm-1 | light absorption at 400 nanometers |
| WS_Abs_420nm | Mm-1 | light absorption at 420 nanometers |
| WS_Abs_440nm | Mm-1 | light absorption at 440 nanometers |
| WS_Abs_460nm | Mm-1 | light absorption at 460 nanometers |
| WS_Abs_480nm | Mm-1 | light absorption at 480 nanometers |
| WS_Abs_500nm | Mm-1 | light absorption at 500 nanometers |
| WS_Abs_520nm | Mm-1 | light absorption at 520 nanometers |
| WS_Abs_540nm | Mm-1 | light absorption at 540 nanometers |
| WS_Abs_560nm | Mm-1 | light absorption at 560 nanometers |
| WS_Abs_580nm | Mm-1 | light absorption at 580 nanometers |
| WS_Abs_600nm | Mm-1 | light absorption at 600 nanometers |
| WS_Abs_620nm | Mm-1 | light absorption at 620 nanometers |
| WS_Abs_640nm | Mm-1 | light absorption at 640 nanometers |
| WS_Abs_660nm | Mm-1 | light absorption at 660 nanometers |
| WS_Abs_680nm | Mm-1 | light absorption at 680 nanometers |
| WS_Abs_700nm | Mm-1 | light absorption at 700 nanometers |
| WS_Abs_365nm | Mm-1 | light absorption at 365 nanometers |
| MS_Abs_300nm | Mm-1 | light absorption at 300 nanometers |
| MS_Abs_320nm | Mm-1 | light absorption at 320 nanometers |
| MS_Abs_340nm | Mm-1 | light absorption at 340 nanometers |
| MS_Abs_360nm | Mm-1 | light absorption at 360 nanometers |
| MS_Abs_380nm | Mm-1 | light absorption at 380 nanometers |
| MS_Abs_400nm | Mm-1 | light absorption at 400 nanometers |
| MS_Abs_420nm | Mm-1 | light absorption at 420 nanometers |
| MS_Abs_440nm | Mm-1 | light absorption at 440 nanometers |
| MS_Abs_460nm | Mm-1 | light absorption at 460 nanometers |
| MS_Abs_480nm | Mm-1 | light absorption at 480 nanometers |
| MS_Abs_500nm | Mm-1 | light absorption at 500 nanometers |
| MS_Abs_520nm | Mm-1 | light absorption at 520 nanometers |
| MS_Abs_540nm | Mm-1 | light absorption at 540 nanometers |
| MS_Abs_560nm | Mm-1 | light absorption at 560 nanometers |
| MS_Abs_580nm | Mm-1 | light absorption at 580 nanometers |
| MS_Abs_600nm | Mm-1 | light absorption at 600 nanometers |
| MS_Abs_620nm | Mm-1 | light absorption at 620 nanometers |
| MS_Abs_640nm | Mm-1 | light absorption at 640 nanometers |
| MS_Abs_660nm | Mm-1 | light absorption at 660 nanometers |
| MS_Abs_680nm | Mm-1 | light absorption at 680 nanometers |
| MS_Abs_700nm | Mm-1 | light absorption at 700 nanometers |
| MS_Abs_365nm | Mm-1 | light absorption at 365 nanometers |
| WSOC | ug m-3 | water-soluble organic carbon absorption |
Table 4. Variables in the data files SAGA-AERO_DC8_YYYYMMDD_R#.ict.
| Name | Units | Description |
|---|---|---|
| UTC_Stop_SAGA_AERO | seconds | seconds_after_midnight_UTC |
| UTC_Mid_SAGA_AERO | seconds | seconds_after_midnight_UTC |
| Cl_SAGA_AERO | ug/m3 | Cloride_in_microgram_per_cubic_meter |
| Br_SAGA_AERO | ug/m3 | Bromide_in_microgram_per_cubic_meter |
| NO3_SAGA_AERO | ug/m3 | Nitrate_in_microgram_per_cubic_meter |
| SO4_SAGA_AERO | ug/m3 | Sulfate_in_microgram_per_cubic_meter |
| C2O4_SAGA_AERO | ug/m3 | Oxalate_in_microgram_per_cubic_meter |
| Na_SAGA_AERO | ug/m3 | Sodium_in_microgram_per_cubic_meter |
| NH4_SAGA_AERO | ug/m3 | Ammonium_in_microgram_per_cubic_meter |
| K_SAGA_AERO | ug/m3 | Potassium_in_microgram_per_cubic_meter |
| Mg_SAGA_AERO | ug/m3 | Magnesium_in_microgram_per_cubic_meter |
| Ca_SAGA_AERO | ug/m3 | Calcium_in_microgram_per_cubic_meter |
| Ca_SAGA_AERO | ug/m3 | Calcium_in_microgram_per_cubic_meter |
Application and Derivation
ATom builds the scientific foundation for mitigation of short-lived climate forcers, in particular methane (CH4), tropospheric ozone (O3), and Black Carbon aerosols (BC).
ATom Science Questions
Tier 1
- What are chemical processes that control the short-lived climate forcing agents CH4, O3, and BC in the atmosphere? How is the chemical reactivity of the atmosphere on a global scale affected by anthropogenic emissions? How can we improve chemistry-climate modeling of these processes?
Tier 2
- Over large, remote regions, what are the distributions of BC and other aerosols important as short-lived climate forcers? What are the sources of new particles? How rapidly do aerosols grow to CCN-active sizes? How well are these processes represented in models?
- What type of variability and spatial gradients occur over remote ocean regions for greenhouse gases (GHGs) and ozone depleting substances (ODSs)? How do the variations among air parcels help identify anthropogenic influences on photochemical reactivity, validate satellite data for these gases, and refine knowledge of sources and sinks?
Significance
ATom delivers unique data and analysis to address the Science Mission Directorate objectives of acquiring “datasets that identify and characterize important phenomena in the changing Earth system” and “measurements that address weaknesses in current Earth system models leading to improvement in modeling capabilities.” ATom will provide unprecedented challenges to the CCMs used as policy tools for climate change assessments, with comprehensive data on atmospheric chemical reactivity at global scales, and will work closely with modeling teams to translate ATom data to better, more reliable CCMs. ATom provides extraordinary validation data for remote sensing.
Quality Assessment
Limit of detection (LOD) and uncertainty information is provided in each *.ict data file.
Uncertainty information for data files SAGA-MC_DC8_YYYYMMDD_R#.ict.
- HNO3+submicron-NO3_SAGA = 10% + 5 pptv
- Sulfate_lt_1um_MCIC= 10% + 0.021 ug_sm-3
Uncertainty information for data files SAGA-Abs_DC8_YYYYMMDD_R#.ict.
- 17.4% for WS measurements
- 20.6% for MS measurements
- 15.9% for WSOC measurements
Uncertainty information for data files SAGA-AERO_DC8_YYYYMMDD_R#.ict.
Mixing ratios are corrected for the amount of analyte found in extracts of blank (non-exposed) filters. Negative values are reported when an ion is quantified in a sample extract but the amount is less than the deployment averaged background. -8888 is used if when it was not possible to quantify the amount of a given ion in a sample extract.
Data Acquisition, Materials, and Methods
ATom makes global-scale measurements of the chemistry of the atmosphere using the NASA DC-8 aircraft. Flights span the Pacific and Atlantic Oceans, nearly pole-to-pole, in continuous profiling mode, covering remote regions that receive long-range inputs of pollution from expanding industrial economies. The payload has proven instruments for in situ measurements of reactive and long-lived gases, diagnostic chemical tracers, and aerosol size, number, and composition, plus spectrally resolved solar radiation and meteorological parameters.
Combining distributions of aerosols and reactive gases with long-lived GHGs and ODSs enables disentangling of the processes that regulate atmospheric chemistry: emissions, transport, cloud processes, and chemical transformations. ATom analyzes measurements using customized modeling tools to derive daily averaged chemical rates for key atmospheric processes and to critically evaluate Chemistry-Climate Models (CCMs). ATom also differentiates between hypotheses for the formation and growth of aerosols over the remote oceans.
Soluble Acidic Gases and Aerosols
| Instrument | Full Name | Contact Person | Type | Measurements | Data Variables |
|---|---|---|---|---|---|
| SAGA | Soluble Acidic Gases and Aerosols | Jack Dibb | ion chromatography | soluble ions | Na, NH4, K, Mg, Ca+2, Cl, Br-, NO3, SO4, C2O4-2, HNO3, Fine Aerosol SO4, Fine Aerosol NO3 |
Two related installations were used to collect SAGA data: a mist chamber/ion chromatograph (MC/IC) sampling/analysis system providing near real-time results for selected species, and a bulk aerosol system that collects particulates onto filters for subsequent analysis. The system has two inlets, allowing the collection of paired samples simultaneously.
MC/IC in situ nitric acid (and submicron NO3 aerosol) and fine (< 1 um) aerosol sulfate
The University of New Hampshire (UNH) Mist Chamber/Ion Chromatography MC/IC system provides in situ atmospheric distributions of nitric acid (HNO3) and fine (< 1 um) aerosol sulfate at approximately 80 second resolution.
Bulk aerosol system collects particulates onto filters for subsequent analysis
Filters are exposed on all level flight legs. Below 3 km exposure, times are 5 minutes or less—increasing at higher altitudes to a maximum sample time of 15 minutes.
Light absorption measurements of filter extracts
Collected filters were first extracted in 15 ml of water (water-soluble, WS), dried and then extracted again using 15 ml of methanol (methanol soluble, MS). Each extract was filtered with a 0.45 um pore size syringe filter and then injected through a 2.5 m path length LWCC and light absorption measured by Ocean Optics USB4000 spectrometer. Absorption from 300 to 700 nm was recorded.
Raw absorption data were processed by the equation Abs=Raw*(Volume of extraction liquid)/(Volume of air collected at STP)/(Optical Path Length, 2.5m here)*ln(10). STP is T=273K and p=1013 mb.
Data reported were averaged over 20 nm wavelength intervals (i.e., absorption at 400 nm was average by absorption data between 390 nm to 410 nm).
Brown carbon absorption was determined by absorption at 365 nm.
Quality Control
The absorption of pure solvent was subtracted from the sample.
Absorption data have been blank corrected by averaging all blank filters in this mission (2-3 blank filters per flight).
Limit of detection (LOD) was determined by three times the standard deviation of blank data. Listed in each data file.
Uncertainty
Specifically, for the Brown carbon absorption -- 19.3% for WS_Abs_365nm and 15.6% for MS_Abs_365nm.
Ionic composition of aerosol filter extractions
Non-size selected ("bulk") aerosols are sampled isokinetically through forward-facing aerosol inlet onto a Teflon filter. Ions are extracted off of the filters into deionized water and ion chromatography analysis is performed to quantify soluble ions (Cl-, Br-, NO3-, SO42-, C2O42-, Na+, NH4+, K+, Ca+, and Mg+). Reported under STP (273 k & 1013 mb).
Quality Control
Mixing ratios are corrected for the amount of analyte found in extracts of blank (non-exposed) filters. Negative values are reported when an ion is quantified in a sample extract but the amount is less than the deployment averaged background. -8888 is used if when it was not possible to quantify the amount of a given ion in a sample extract.
Do not use these data on time scales shorter than those reported here.
Measurement of water-soluble organic carbon
GE Sievers 900 TOC Portable Analyzer was used to measure water-soluble organic carbon in the filter extracts.
Data Access
These data are available through the Oak Ridge National Laboratory (ORNL) Distributed Active Archive Center (DAAC).
ATom: Measurements of Soluble Acidic Gases and Aerosols (SAGA)
Contact for Data Center Access Information:
- E-mail: uso@daac.ornl.gov
- Telephone: +1 (865) 241-3952