Documentation Revision Date: 2019-05-30
Dataset Version: 1
Summary
The ATom CAFS measurements provide an extensive set of statistics on how clouds alter photolysis rates and provide a unique opportunity to test how the chemistry models treat clouds in comparison to the in-situ measurements throughout the remote Pacific and Atlantic Ocean basins.
There are 27 data files included with this dataset in netCDF file format. Model output data files are provided in two formats: (1) Climate and Forecast (CF) compliant and (2) 'as provided' format for use with the included MATLAB scripts. There are seven auxiliary data files, including the in situ CAFS data. Companion files include 12 MATLAB scripts to analyze and produce graphical output of the data and a compressed file (.zip) of all the figures from related publication by Hall et al. (2018).
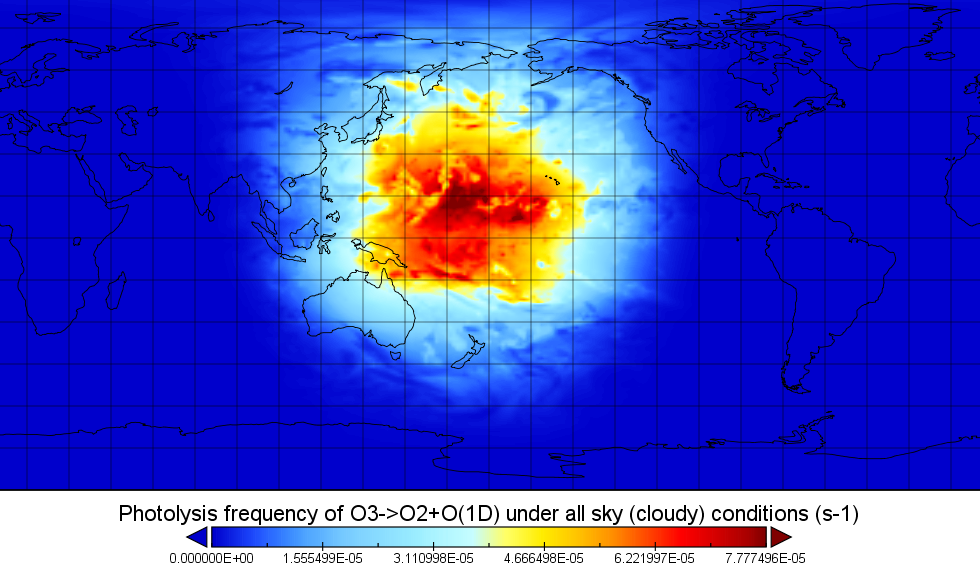
Figure 1: An image of photolysis frequency (J-value) for J-O1D under cloudy conditions from the GSFC GMI model. From provided file Jstat_Kmodel_GMI_CFcompliant.nc
Citation
Hall, S.R., K. Ullmann, M.J. Prather, C.M. Flynn, L.T. Murray, A.M. Fiore, G. Correa, S.A. Strode, S.D. Steenrod, J.-F. Lamarque, J. Guth, B. Josse, J. Flemming, V. Huijnen, N.L. Abraham, and A.T. Archibald. 2019. ATom: Global Modeled and CAFS Measured Cloudy and Clear Sky Photolysis Rates, 2016. ORNL DAAC, Oak Ridge, Tennessee, USA. https://doi.org/10.3334/ORNLDAAC/1651
Table of Contents
- Dataset Overview
- Data Characteristics
- Application and Derivation
- Quality Assessment
- Data Acquisition, Materials, and Methods
- Data Access
- References
Dataset Overview
This dataset provides the results from nine global chemistry-climate or chemistry-transport models that estimated gridded values of atmospheric photolytic rates (J values) for ozone (O3), designated J-O1D, and nitrogen dioxide (NO2), designated J-NO2, under cloudy and clear sky scenarios. Each model produced global 4-D fields (latitude by longitude by pressure for 24 hours) for one day in mid-August 2016 (nominally) of results from two simulations: first using their standard treatment of clouds (all sky or cloudy) and a second with clouds and aerosols removed (clear sky). Model resolution ranges from 0.5 to 2.5 degrees. Observed J-O1D and J-NO2 values from the first ATom deployment (29 July - 23 August 2016) were collected with the Charged-coupled device Actinic Flux Spectroradiometer (CAFS) instrument. The ATom CAFS measurements are 3-second averages along the flight path for selected remote areas over the tropical and northern Pacific Ocean. Both all-sky (cloudy) and synthesized clear-sky J values are provided. Additional data are included for clouds and ozone column plus other cloudy and clear sky parameters for the same remote areas of the tropical and northern Pacific Ocean. These auxiliary data are provided for use with included MATLAB scripts to reproduce the plots and analyses performed in the related publication by Hall et al. (2018). Note that while the analyses in the related publication were limited to the Pacific basin, the global model data are archived with this dataset.
This ATom climatology of J-values is a unique test of how the chemistry models treat clouds and how it compares to in-situ measurements from actinic flux spectroradiometers on board the NASA DC-8 during the Atmospheric Tomography (ATom) mission which provided an extensive set of statistics on how clouds alter photolysis rates (J-values) throughout the remote Pacific and Atlantic Ocean basins.
Project: Atmospheric Tomography Mission (ATom)
The Atmospheric Tomography Mission (ATom) was a NASA Earth Venture Suborbital-2 mission. It studied the impact of human-produced air pollution on greenhouse gases and on chemically reactive gases in the atmosphere. ATom deployed an extensive gas and aerosol payload on the NASA DC-8 aircraft for systematic, global-scale sampling of the atmosphere, profiling continuously from 0.2 to 12 km altitude. Flights occurred in each of 4 seasons over a 4-year period.
Related Publication:
This dataset archives all parameters needed to reproduce the figures and analysis of the related publication:
Hall, S. R., Ullmann, K., Prather, M. J., Flynn, C. M., Murray, L. T., Fiore, A. M., Correa, G., Strode, S. A., Steenrod, S. D., Lamarque, J.-F., Guth, J., Josse, B., Flemming, J., Huijnen, V., Abraham, N. L., and Archibald, A. T.: Cloud impacts on photochemistry: building a climatology of photolysis rates from the Atmospheric Tomography mission, Atmos. Chem. Phys., 18, 16809-16828, https://doi.org/10.5194/acp-18-16809-2018, 2018.
Supplement of Atmos. Chem. Phys., 18, 16809–16828, 2018 https://doi.org/10.5194/acp-18-16809-2018-supplement
Related Dataset:
Wofsy, et al. 2018. ATom: Merged Atmospheric Chemistry, Trace Gases, and Aerosols. ORNL DAAC, Oak Ridge, Tennessee, USA. https://doi.org/10.3334/ORNLDAAC/1581
Data Characteristics
Spatial Coverage:
The model data are global, for each model level, but truncated for altitude above air pressure = 70 hPa.
The ATom CAFS data are limited to the tropical and northern Pacific (20S to 50N).
Spatial Resolution:
Model resolution ranges from 0.5 to 2.5 degrees.
CAFS data are 3-second averages along the flight path covering approximately 750 m horizontally.
Temporal Coverage:
Each model produced global 4-D fields (latitude by longitude by pressure for 24 hours) for one representative day in mid-August 2016. Sometimes model data were for different climatological years as noted within file metadata.
The ATom observations (CAFS) occurred over the month of August 2016.
Temporal Resolution:
The modeled J values are calculated hourly. The ATom CAFS measurements are 3-sec averages along the flight path.
Study Area (Coordinates in decimal degrees):
| Site | Northern Extent | Southern Extent | Western Extent | Eastern Extent |
|---|---|---|---|---|
| Global gridded data and model output | 90 | -90 | -180 | 180 |
| Tropical Pacific Basin (nominal)* | 20 | -20 | 160 (E) | -120 (W) |
| Northern Pacific Basin (nominal)* | 50 | 20 | 170 (E) | -135 (W) |
*Pacific basins extend across 180/-180 meridian.
Data File Information
There are 27 data files included with this dataset in netCDF file format.
- Model output data files are provided in two formats:
- (1) Climate and Forecast (CF) compliant
- (2) the original, 'as provided' format, for use with the MATLAB scripts that require specific formatting.
- There are seven auxiliary data files, including the in situ CAFS data.
Companion files include 12 MATLAB scripts to analyze and produce graphical output of the data and a compressed file (.zip) of all the figures from related publication by Hall et al. (2018).
Model Output Files:
Naming conventions:
Jstat_<model>model_<model_shortname>_< CFcompliant (if applicable)>.nc
Climate model is designated by letters A-I and K (no J) in the file name.
Table 1. Model output file names
| Data file name | Model short name | Model long name |
|---|---|---|
| Jstat_Amodel_GC.nc | GC | GEOS-Chem |
| Jstat_Amodel_GC_CFcompliant.nc | ||
| Jstat_Bmodel_GISS.nc | GISS | GISS Model 2E1 |
| Jstat_Bmodel_GISS_CFcompliant.nc | ||
| Jstat_Cmodel_UCI.nc | UCI | UCI CTM |
| Jstat_Cmodel_UCI_CFcompliant.nc | ||
| Jstat_Dmodel_NCAR.nc | NCAR | CESM |
| Jstat_Dmodel_NCAR_CFcompliant.nc | ||
| Jstat_Emodel_UKCA.nc | UKCA | UKCA |
| Jstat_Emodel_UKCA_CFcompliant.nc | ||
| Jstat_Fmodel_MOCA.nc | MOCA | MOCAGE |
| Jstat_Fmodel_MOCA_CFcompliant.nc | ||
| Jstat_Gmodel_IFS.nc | IFS | ECMWF IFS |
| Jstat_Gmodel_IFS_CFcompliant.nc | ||
| Jstat_Hmodel_GFDL.nc | GFDL | GFDL AM3 |
| Jstat_Hmodel_GFDL_CFcompliant.nc | ||
| Jstat_Imodel_UCIb.nc | UCIb | UCI CTM |
| Jstat_Imodel_UCIb_CFcompliant.nc | ||
| Jstat_Kmodel_GMI.nc | GMI | GSFC GMI |
| Jstat_Kmodel_GMI_CFcompliant.nc |
Data Dictionary:
Table 2. Variables and units for model output files. Note that 'as provided' files do not contain the lat_bnds and lon_bnds variables. No data value: 9.97E+36 .
| Variables CF compliant files |
Variables 'as provided' files |
Unit | Description |
|---|---|---|---|
| lat_bnds | degrees_north | latitude coordinates of cell boundary | |
| lon_bnds | degrees_east | longitude coordinates of cell boundary | |
| lon | lon | degrees_east | longitude coordinate |
| lat | lat | degrees_north | latitude coordinate |
| lev | lev | hPa | air pressure (1D) at center of grid, using global average surface air pressure |
| Plev | Plev<model> | hPA | air pressure (3D) at center of each grid cell, averaged over 24 hours |
| JO31d_cloudy | J1<model> | s-1 | Photolysis frequency of O3->O2+O(1D) under all sky (cloudy) conditions |
| JO31d_clear | J1<model>c | s-1 | Photolysis frequency of O3->O2+O(1D) under artificially clear conditions |
| JNO2_cloudy | J2<model> | s-1 | Photolysis frequency of NO2->NO+O under all sky (cloudy) conditions |
| JNO2_clear | J2<model>c | s-1 | Photolysis frequency of NO2->NO+O under artificially clear conditions |
| time | t24 | hours since 2013-08-16 00:00:00Z | Standard calendar |
Auxiliary Data Files:
Auxiliary files are available as stated in the manuscript publication within "Data Availability" for the plots and analysis performed. The data analysis and plotting codes, as MATLAB scripts, are available as companion files. No data value: 9.97E+36, except for Jstat_obs_CAFS.nc which is "NaNf".
Table 3. Auxiliary files and description (variables and units are self-described within netCDF each file)
| File | Description |
|---|---|
| Jstat_cloudODCF.nc | Cloud Fraction and Optical Depth by Model and Geographic Block |
| Jstat_cosSZA.nc | Solar Zenith Angle |
| Jstat_O3col.nc | Column O3 (DU) for August from 9 models and OMI observations for August (zonal monthly means where possible) |
| Jstat_ODmetUCI.nc | Frequency of Cloud OD from UCI model for various resolutions and cloud overlap assumptions |
| Jstat_RMcldyclr.nc |
24-hour Reactivities and Js from UCI model for grid cells along the Dateline using standard cloud overlap, clear skies, and averaged clouds. |
| Jstat_TPac_subsample.nc | Fractional occurrence of cloud-dimming, cloud-brightening and neutral impact on J for 9 models and UCI variant using subsampling of the Tropical Pacific block |
| Jstat_obs_CAFS.nc |
Observed (CAFS) data of J-cloudy (all sky) and J-clear (synthesized) at 10-sec intervals along the flight path from ATom-1 deployment. No data value is "NaNf". The CAFS statistics are derived from the ATom-1 deployment and selected for 2 remote geographic blockes in order to compare with the models: (block 1) Tropical Pacific, 20S-20N x 160E-240E; and (block 2) North Pacific, 20N-50N x 170E-225E. Collected from ATom-1 during its 10 research flights from 29 Jul to 23 Aug 2016. |
Companion Files:
Companion files include 12 MATLAB scripts to analyze and produce graphical output of the data and a compressed file (Jstats_final-figs.zip) of all the figures from the related publication by Hall et al. (2018).
Table 4. MATLAB/Dataset script name and description. Note, Scripts 1-4 and 11 should be run in sequence. Scripts 5-10, and 12 are independent of other data or scripts.
| Script # | MATLAB/Data Processing Script | Description |
|---|---|---|
| 1 | Pmat_Jstat_1obs_input.txt | Observations INPUT - CAFS (121,123 total points) |
| 2 | Pmat_Jstat_2mdl_input.txt | Model INPUT – 9 models, +alternates, various grids |
| 3 | Pmat_Jstat_3stats.txt | Generate J stats and TABLES from models and observations |
| 4 | Pmat_Jstat_4plots.txt | Primary PLOTS of J stats (many) |
| 5 | Pmat_Jstat_5O3colm.txt | INPUT and PLOT O3 column data |
| 6 | Pmat_Jstat_6OSAlbedo.txt | Combined dataset and script of J stats PDFs of J-cld/J-clr for more realistic Ocean Surface Albedos. Run the script attached at end of the dataset to generate PLOTS. |
| 7 | Pmat_Jstat_7ODmetUCI.txt | INPUT cloud OD distributions from different UCI met fields and resolutions, and generate PLOTS. |
| 8 | Pmat_Jstat_8cldy-rates.txt | INPUT UCI std 5-day averages of reactivities for 14,880 air parcels, PLOT compares clear, averaged cloud rates vs standard cloud fields. (see Prather et al., 2018) |
| 9 | Pmat_Jstat_9cloudODCF.txt | INPUT 9 model cloud OD and Cloud Fraction data and PLOT |
| 10 | Pmat_Jstat_10rlnJ-COD.txt | Combined dataset and script of rlnJ values as function of low-cloud OD (stratus deck, J sampled at 300 hPa). Run the script attached at end of the dataset to generate PLOT. |
| 11 | Pmat_Jstat_11freqSZA.txt | Calculate and PLOT frequency of SZA's in 3 geographic blocks for UCI, NCAR, CAFS. |
| 12 | Pmat_Jstat_12TPac-subsample.txt | INPUT and PLOT the horizontal whisker-bar charts of rlnJ distributions for different sampling within the Tropical Pacific block. For 3 pressure layers and all 9 models. |
Application and Derivation
This dataset provides the ability to use CAFS “all-sky” measurements made under a semi-objective sampling strategy (i.e., ATom's tomographic profiling makes pre-planned slices through the troposphere, limited by available airports, diverting only for dangerous weather). We test the collective treatment of clouds and radiation in models insofar as they can match the observed statistics of J values. This approach gets to the core of atmospheric photochemistry by combining the range of assumptions and parameterizations for clouds in the models including, among others, cloud optical depths (CODs) and scattering phase functions, two-stream or multi-stream radiative transfer, cloud overlap, or even just parametric correction factors. See Hall et al. (2018) for details.
For example, Hall et al. (2018) compared the disparate models and datasets, for the impact of clouds on J values using the ratio of J-cloudy (standard, sometimes cloudy conditions) to J-clear (artificially cleared of clouds).
The data and MATLAB scripts to produce this and other figures from the paper are provided with the dataset.
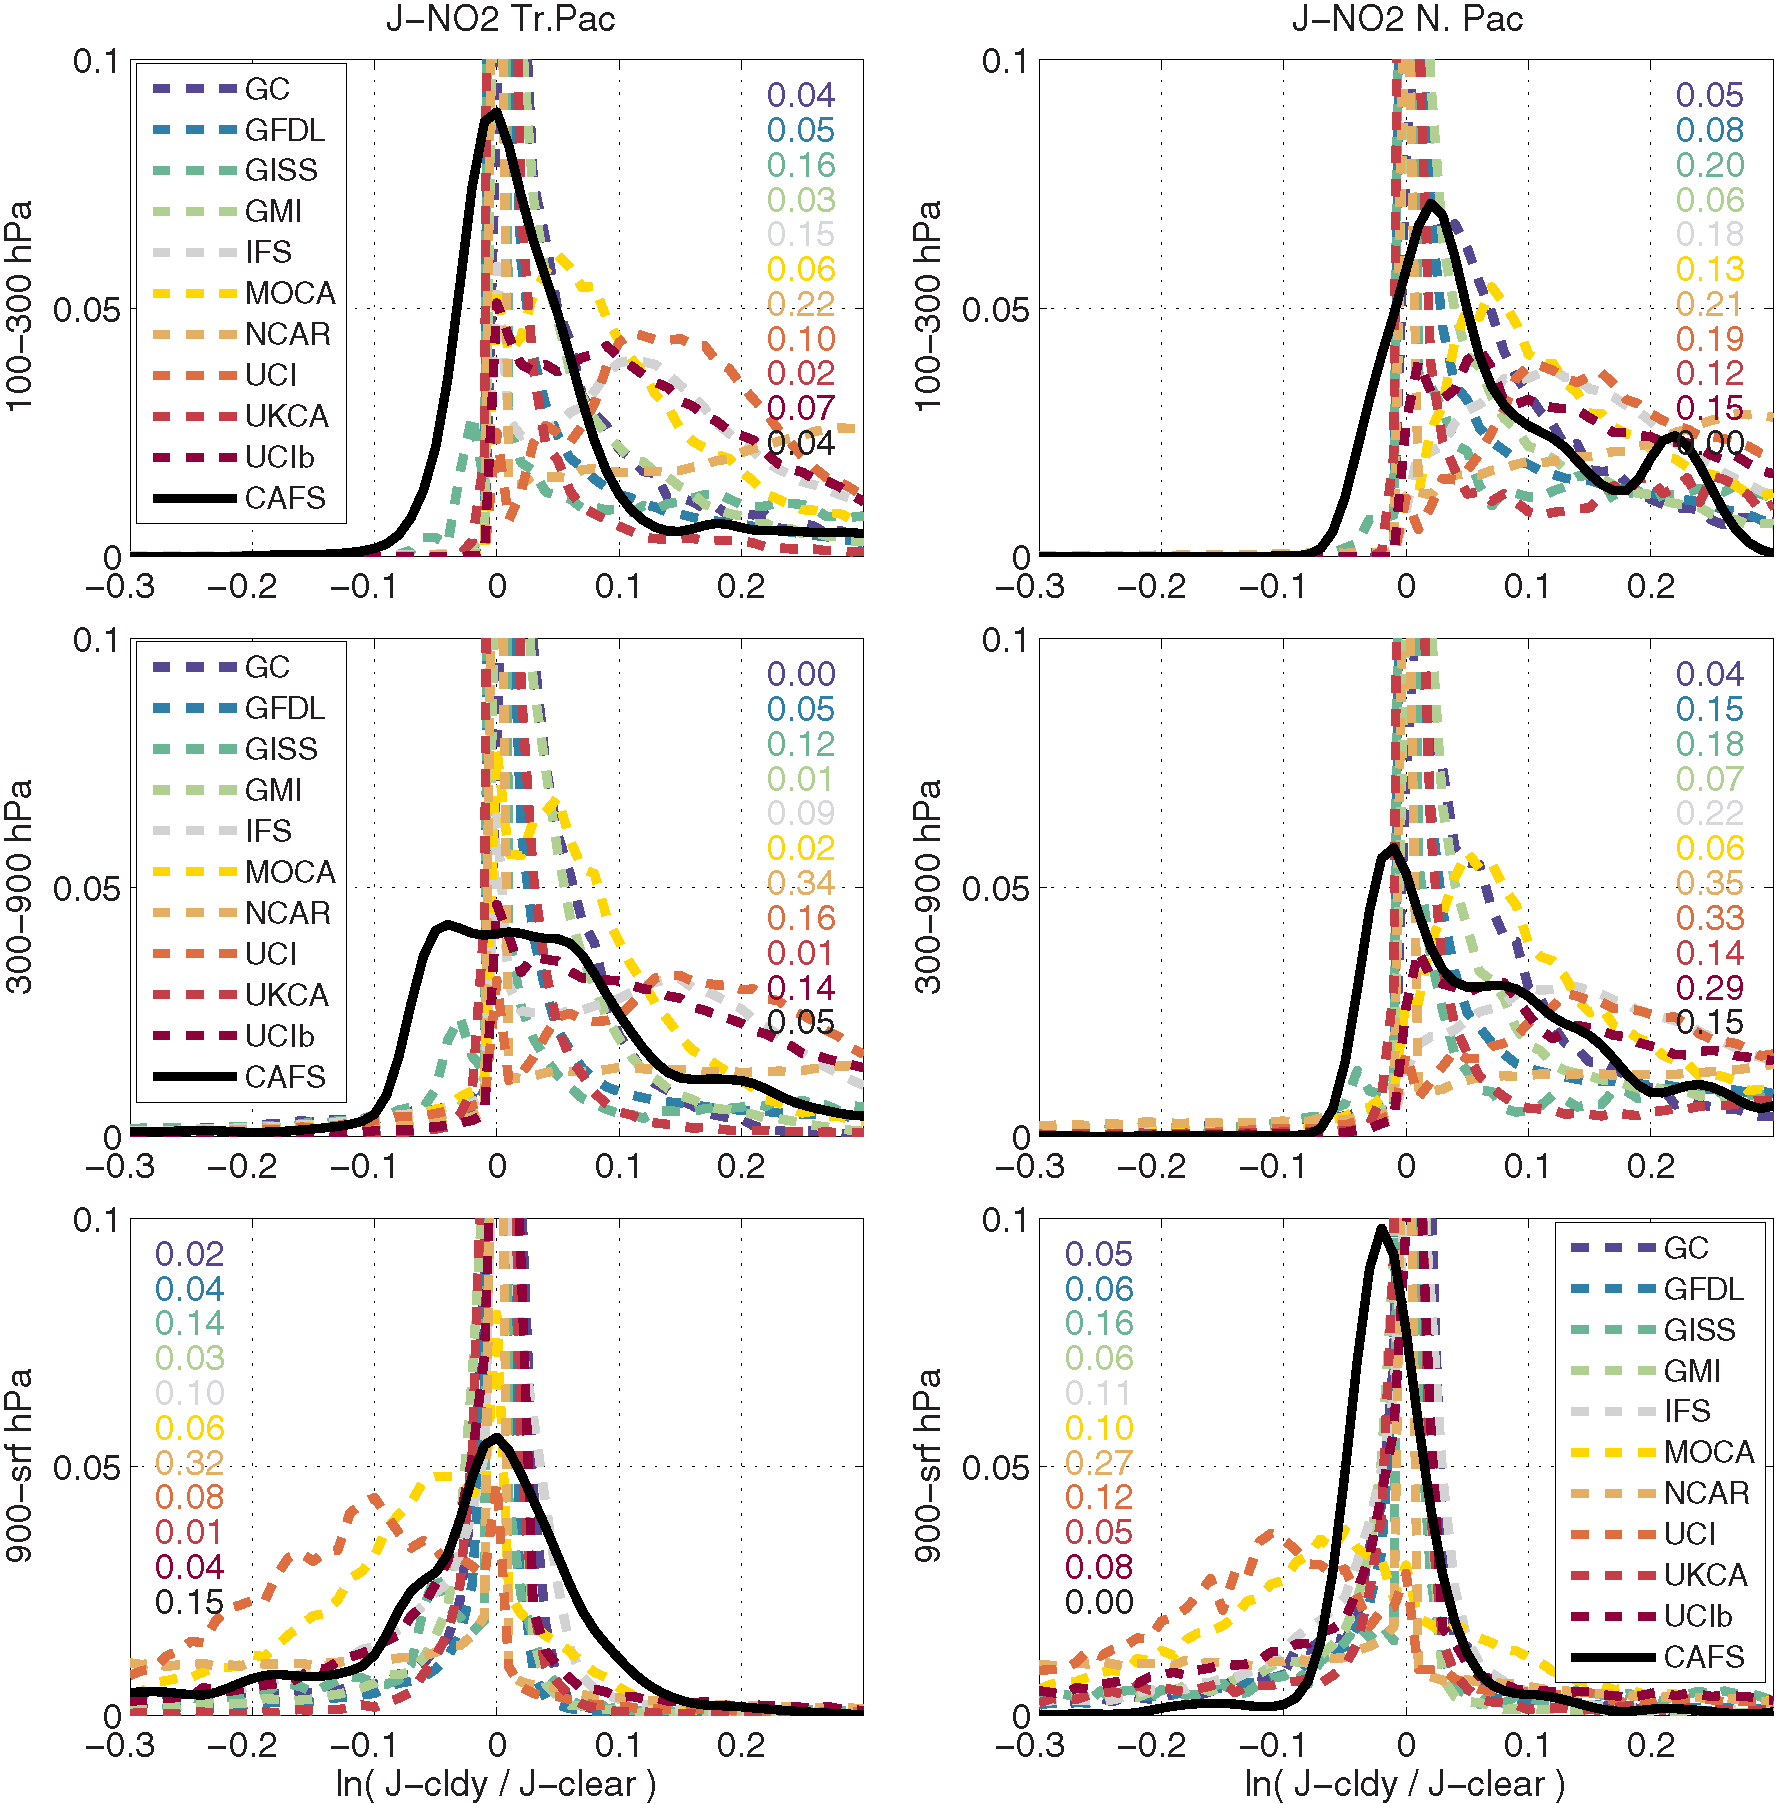
Figure 2. From Hall et al. (2018), Figure 4(b). Probability distribution of the natural log of the ratio of cloudy–clearJ-NO2 values (rlnJ) from 10 models and from CAFS during ATom-1. The columns correspond to the two geographic blocks (tropical Pacific, 20S–20N×160–240E, and North Pacific,20–50N×170–225E). The rows are the three pressure layers (100–300, 300–900, 900–surface hPa).
Quality Assessment
No specific quality assessment information is provided.
Data Acquisition, Materials, and Methods
Models
The models here include the six original ones used in the ATom reactivity studies (Prather et al., 2017) plus three additional European global chemistry models. They are described more fully in Table 1 of corresponding journal article, Hall et al., 2018, and are designated as GEOS-Chem (GC), GFDL AM3 (GFDL), GISS Model 2E1 (GISS), GSFC GMI (GMI), ECMWF IFS (IFS), MOCAGE (MOCA), CESM (NCAR), UCI CTM (UCI), and UM-UKCA (UKCA).
Additional model information and contacts are given in the Supplement Table S1 of Hall et al., 2018.
Modelling Details
All models submitted global 4-D fields (latitude by longitude by pressure for 24 h) for a day in mid-August using their standard treatment of clouds (designated all sky or cloudy here) and then a parallel simulation with clouds and aerosols removed (designated clear sky or clear). In addition to its correlated cloud-overlap model with multiple quadrature column atmospheres to calculate an average J value, UCI also contributed a model version using the B-averaging of cloud fractions (CFs) (Briegleb, 1992) used by most models, designated UCIb (see Prather, 2015). Several models ran the clear-sky case without clouds but with their background aerosols.
Not all of the models could run with 2016 meteorology, and thus we asked for a day in mid-August and treat that (rightly or wrongly) as typical of the cloud statistics during ATom-1. The meteorological dates are listed in Table 1 of Hall et al., 2018. This simplification made it possible to attract large participation, but of course it limits the ability to claim that the model statistics are a robust climatology.
ATom CAFS Data Collection and Processing
The CAFS data were collected from ATom-1 during its 10 research flights from 29 July to 23 August 2016. Two photolytic rates were observed and calculated under a wide range of conditions:
J-O1D (/sec): O3 + hv >> O2 + O(1D)
J-NO2 (/sec): NO2 + hv >> NO + O
Spectrally resolved CAFS measurements of actinic flux (280–650 nm) are used to calculate in situ J-O1D and J-NO2. These observed J values are all-sky J values and include incidences when the sky is effectively clear of clouds. All-sky J values were designated as J-cloudy in both measurements and models to contrast them with the artificially cloud-cleared J values denoted J-clear. For J-clear, CAFS uses the Tropospheric Ultraviolet and Visible (TUV) radiative transfer model (Madronich and Flocke, 1999). The model is run with an eight-stream discrete ordinate radiative transfer method with a pseudo-spherical modification to generate actinic fluxes with a 1 nm wavelength grid from 292–700 nm. The calculation is run with no clouds and no aerosols and a fixed surface albedo of 0.06, and applies ozone columns from the satellite Ozone Monitoring Instrument (Levelt et al., 2006; Veefkind et al., 2006). CAFS and TUV spectra are processed using the same photolysis frequency code to ensure that the same quantum yield, absorption cross section, and temperature and pressure dependence relationships are applied to the measured and modeled spectra.
Model and Data Comparison
As described in Hall et al. (2018), a statistical comparison of the ratio J-cloudy to J-clear is used as a climatological test to compare global chemistry models with individual CAFS observations. It is difficult for the models to simulate CAFS global data unless there is a very careful sampling strategy to match albedos from the ATom flights over land and cryosphere. Thus, a focus on the two oceanic blocks in the Pacific for which there are a large number of measurements with high sun in ATom-1. The CAFS statistics are derived from the ATom-1 deployment and selected for two remote geographic blocks in order to compare with the models: (block 1) tropical Pacific, 20° S–20° N × 160–240°E, and (block 2) North Pacific, 20–50° N × 170–225° E.
Although the analyses described here are limited to the Pacific blocks, the global model data are archived in the dataset.
Data Access
These data are available through the Oak Ridge National Laboratory (ORNL) Distributed Active Archive Center (DAAC).
ATom: Global Modeled and CAFS Measured Cloudy and Clear Sky Photolysis Rates, 2016
Contact for Data Center Access Information:
- E-mail: uso@daac.ornl.gov
- Telephone: +1 (865) 241-3952
References
Briegleb, B. P.: Delta-Eddington approximation for solar radiation in the NCAR community climate model, J. Geophys. Res., 97, 7603–7612, 1992. https://doi.org/10.1029/92JD00291
Levelt, P. F., van den Oord, G. H. J., Dobber, M. R., Malkki, A., Visser, H., de Vries, J., Stammes, P., Lundell, J. O. V., and Saari, H.: The ozone monitoring instrument, IEEE T. Geosci. Remote, 44, 1093–1101, https://doi.org/10.1109/TGRS.2006.872333, 2006.
Madronich, S. and Flocke, S.: The Role of Solar Radiation in Atmospheric Chemistry, in: Environmental Photochemistry, The Handbook of Environmental Chemistry (Reactions and Processes), edited by: Boule, P., vol. 2/2L, Springer, Berlin, Heidelberg, 1999.
Prather, M. J., Zhu, X., Flynn, C. M., Strode, S. A., Rodriguez, J. M., Steenrod, S. D., Liu, J., Lamarque, J.-F., Fiore, A. M., Horowitz, L. W., Mao, J., Murray, L. T., Shindell, D. T., and Wofsy, S. C.: Global atmospheric chemistry – which air matters, Atmos. Chem. Phys., 17, 9081–9102,https://doi.org/10.5194/acp-17-9081-2017, 2017.
Michael J. Prather, Clare M. Flynn, Xin Zhu, Stephen D. Steenrod, Sarah A. Strode, Arlene M. Fiore, Gustavo Correa, Lee T. Murray, and Jean-Francois Lamarque (2018) How well can global chemistry models calculate the reactivity of short-lived greenhouse gases in the remote troposphere, knowing the chemical composition, Atmos. Meas. Tech., 11, 2653–2668, 2018, doi: 10.5194/amt-11-2653-2018
Wofsy, S.C., Afshar, S., Allen, H. M., Apel, E., Asher, E. C., Barletta, B., Bent, J., Bian, H., Biggs, B. C., Blake, D. R., Blake, N., Bourgeois, I., Brock, C. A., Brune, W. H., Budney, J. W., Bui, T. P., Butler, A., Campuzano-Jost, P., Chang, C. S., Chin, M., Commane, R., Correa, G., Crounse, J. D., Cullis, P. D., Daube, B. C., Day, D. A., Dean-Day, J. M., Dibb, J. E., DiGangi, J. P., Diskin, G. S., Dollner, M., Elkins, J. W., Erdesz, F., Fiore, A. M., Flynn, C. M., Froyd, K., Gesler, D. W., Hall, S. R., Hanisco, T. F., Hannun, R. A., Hills, A. J., Hintsa, E. J., Hoffman, A., Hornbrook, R. S., Huey, L. G., Hughes, S., Jimenez, J. L., Johnson, B. J., Katich, J. M., Keeling, R., Kim, M. J., Kupc, A., Lait, L. R., Lamarque, J.-F., Liu, J., McKain, K., Mclaughlin, R. J., Meinardi, S., Miller, D. O., Montzka, S. A., Moore, F. L., Morgan, E. J., Murphy, D. M., Murray, L. T., Nault, B. A., Neuman, J. A., Newman, P. A., Nicely, J. M., Pan, X., Paplawsky, W., Peischl, J., Prather, M. J., Price, D. J., Ray, E., Reeves, J. M., Richardson, M., Rollins, A. W., Rosenlof, K. H., Ryerson, T. B., Scheuer, E., Schill, G. P., Schroder, J. C., Schwarz, J. P., St.Clair, J. M., Steenrod, S. D., Stephens, B. B., Strode, S. A., Sweeney, C., Tanner, D., Teng, A. P., Thames, A. B., Thompson, C. R., Ullmann, K., Veres, P. R., Vieznor, N., Wagner, N. L., Watt, A., Weber, R., Weinzierl, B., Wennberg, P., Williamson, C. J., Wilson, J. C., Wolfe, G. M., Woods, C. T., and Zeng, L. H.: ATom: Merged Atmospheric Chemistry, Trace Gases, and Aerosols, ORNL DAAC, Oak Ridge, Tennessee, USA, available at: https://doi.org/10.3334/ORNLDAAC/1581, last access: 25 October 2018.
Veefkind, J. P., Haan, J. F., Brinksma, E. J., Kroon, M., and Levelt, P. F.: Total ozone from the ozone monitoring instrument (OMI) using the DOAS technique, IEEE T. Geosci. Remote, 44, 1239–1244, 2006. https://doi.org/10.1109/TGRS.2006.872333