Documentation Revision Date: 2020-06-30
Dataset Version: 1
Summary
There are two data files in ICARTT (.ict) format included with this dataset; one file per ATom mission.
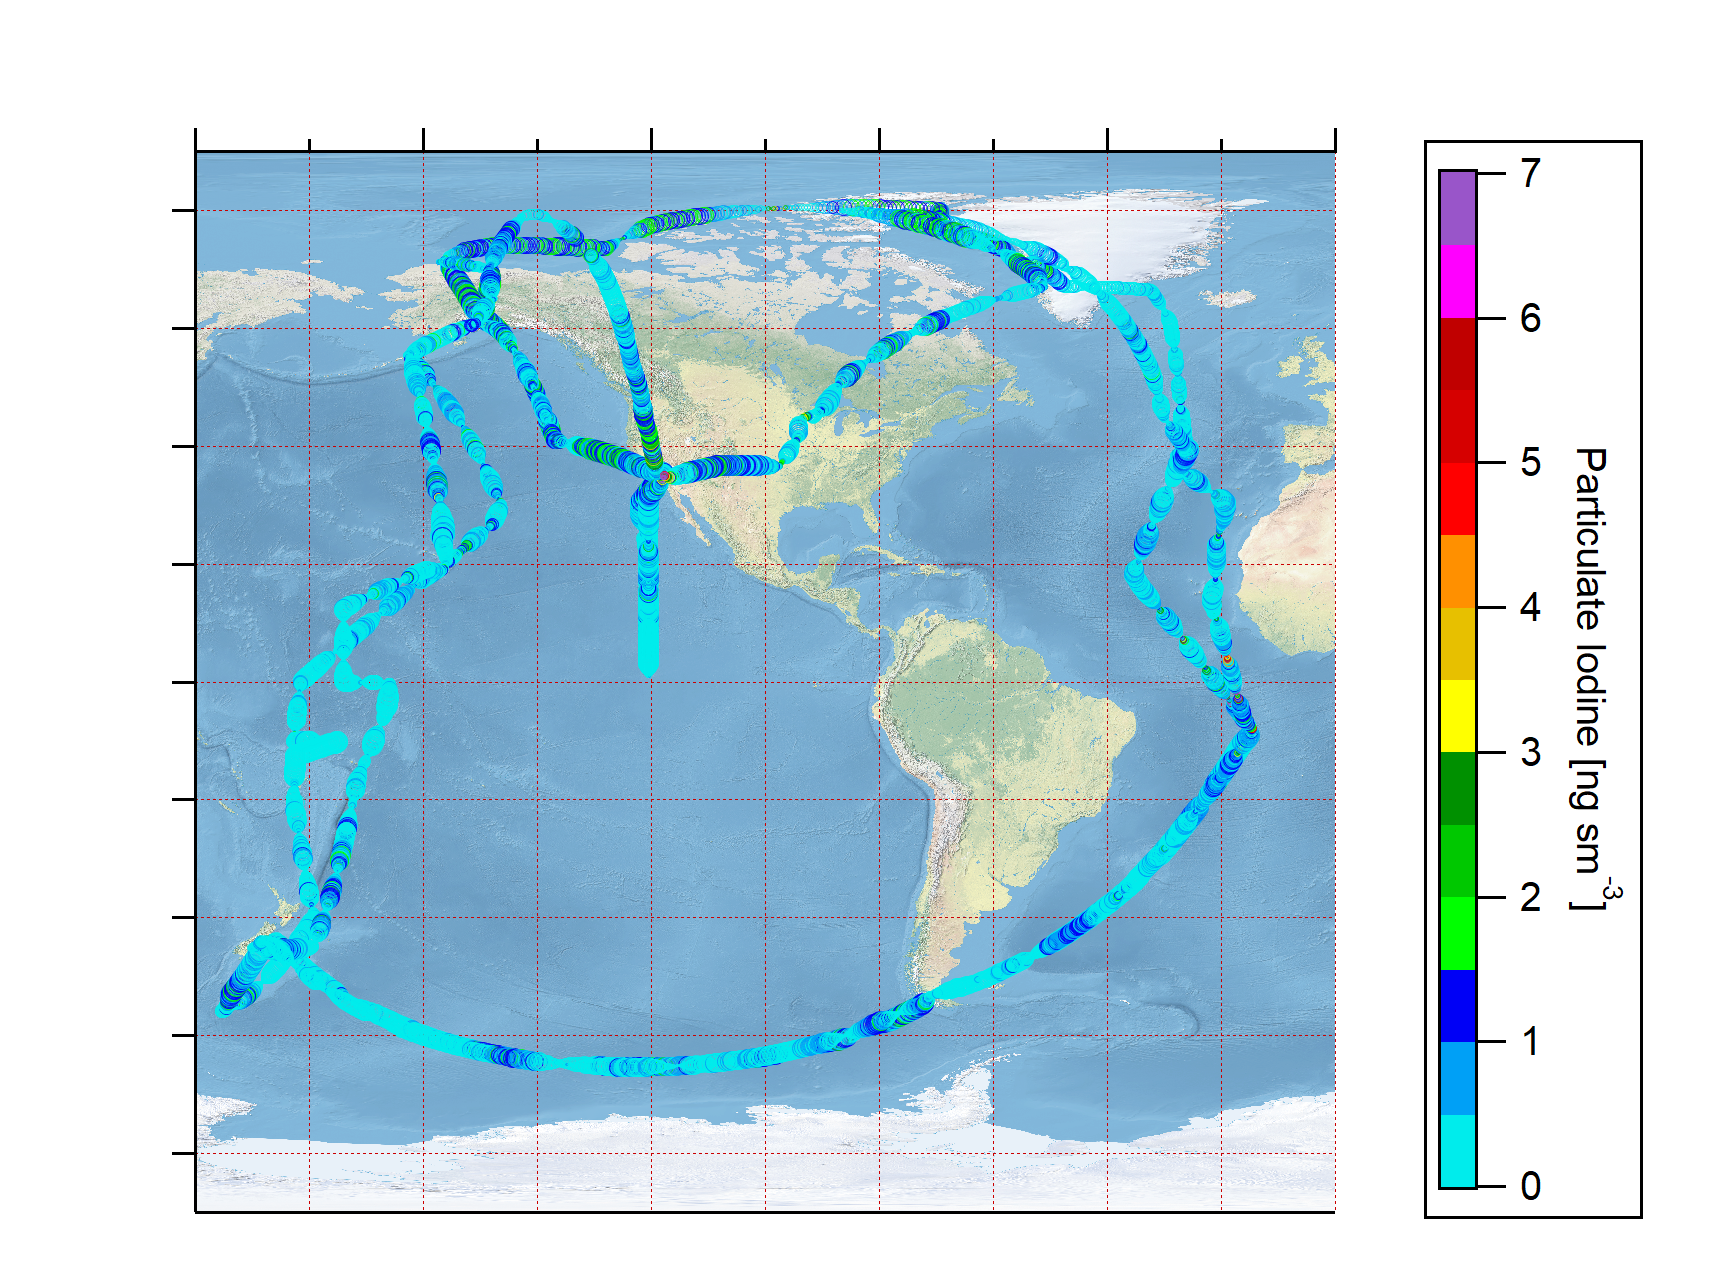
Figure 1: Particulate Iodine measured along flight paths in ATom1 and ATom2. Image courtesy J.L. Jimenez.
Citation
Jimenez, J.L., P. Campuzano-Jost, D.A. Day, B.A. Nault, and J.C. Schroder. 2020. ATom: L2 Particulate Iodine from High-Resolution Aerosol Mass Spectrometer (HR-AMS). ORNL DAAC, Oak Ridge, Tennessee, USA. https://doi.org/10.3334/ORNLDAAC/1773
Table of Contents
- Dataset Overview
- Data Characteristics
- Application and Derivation
- Quality Assessment
- Data Acquisition, Materials, and Methods
- Data Access
- References
Dataset Overview
This dataset provides the mass concentrations of particulate iodine as measured by the High-Resolution Aerosol Mass Spectrometer (HR-AMS) for the first two deployments of the NASA airborne Atmospheric Tomography mission (ATom-1 and ATom-2) at 1 min resolution, from a reanalysis of the data based on post-mission calibrations. This dataset also includes the fractions of the main ions (I+, HI+ and I2+) that can be used to ascertain the oxidation state of iodine, and a classification flag to screen for stratospheric conditions, based on collocated in-situ water vapor and ozone measurements. For details on those analyses please see Koenig et al, (2020). In addition, it also includes positional data from the HR-AMS data feed. The reanalysis will be repeated at 1 Hz resolution and particulate iodine concentrations will be added to the main L2 HR-AMS data repository, Jimenez et al (2019). Please consult the user guide in that repository for further details on HR-AMS operation and data acquisition during ATom.
Project: Atmospheric Tomography Mission
The Atmospheric Tomography Mission (ATom) was a NASA Earth Venture Suborbital-2 mission. It studied the impact of human-produced air pollution on greenhouse gases and on chemically reactive gases in the atmosphere. ATom deployed an extensive gas and aerosol payload on the NASA DC-8 aircraft for systematic, global-scale sampling of the atmosphere, profiling continuously from 0.2 to 12 km altitude. Flights occurred in each of 4 seasons over a 4-year period.
Related Publication
This dataset archives L2 HR-AMS products that are not part of the primary L2 HR-AMS archive and are needed to reproduce the figures and analysis provided in the manuscript:
Koenig, T. K., S. Baidar, P. Campuzano-Jost, C.A. Cuevas, B. Dix, R.P. Fernandez, H. Guo, S.R. Hall, D. Kinnison, B.S. Nault, K. Ullmann, J.L. Jimenez, A. Saiz-Lopez, and R. Volkamer. 2020. Quantitative detection of iodine in the stratosphere. Proceedings of the National Academy of Sciences, 117(4): 1860-1866. https://doi.org/10.1073/pnas.1916828117
Related Datasets
Diskin, G.S., and J.P. DiGangi. 2019. ATom: L2 In Situ Atmospheric Water Vapor from the Diode Laser Hygrometer (DLH). ORNL DAAC, Oak Ridge, Tennessee, USA. https://doi.org/10.3334/ORNLDAAC/1710
Jimenez, J.L., P. Campuzano-Jost, D.A. Day, B.A. Nault, D.J. Price, and J.C. Schroder. 2019. ATom: L2 Measurements from CU High-Resolution Aerosol Mass Spectrometer (HR-AMS). ORNL DAAC, Oak Ridge, Tennessee, USA. https://doi.org/10.3334/ORNLDAAC/1716
Ryerson, T.B., C.R. Thompson, J. Peischl, and I. Bourgeois. 2019. ATom: L2 In Situ Measurements from NOAA Nitrogen Oxides and Ozone (NOyO3) Instrument. ORNL DAAC, Oak Ridge, Tennessee, USA. https://doi.org/10.3334/ORNLDAAC/1734
Wofsy, et al., 2018. ATom: Merged Atmospheric Chemistry, Trace Gases, and Aerosols. ORNL DAAC, Oak Ridge, Tennessee, USA. https://doi.org/10.3334/ORNLDAAC/1581
Data Characteristics
Spatial Coverage: Global. Flights circumnavigate the globe, primarily over the oceans.
Spatial Resolution: Point measurements. At the time resolution of the reprocessed data (46 s), with an average airspeed of 200 m/s and 2000 ft/min climb/sink rate for the NASA DC-8, this results in about 9 km horizontal resolution and ~10 to 600 m vertical resolution when in level/not level flight.
Temporal Coverage: The ATom-1 campaign covered the period July 29 - August 23, 2016. ATom-2 covered the period January 26 - February 21, 2017.
Temporal Resolution: These reanalyzed data are reported at 60-second resolution. Original data were recorded in continuous, 46-s intervals out of every minute of the flight, except for periodic blanks and calibrations.
Data File Information
This dataset archives L2 HR-AMS products and includes two files in ICARTT (*.ict) format. Data files conform to the ICARTT File Format Standards V1.1. The files include AMS-Iodine_DC8_20160729_R0.ict (ATom-1) and AMS-Iodine_DC8_20170126_R0.ict (ATom-2).
Data File Details
Table 1. Variables include in both data files: AMS-Iodine_DC8_20160729_R0.ict and AMS-Iodine_DC8_20170126_R0.ict. Missing data are indicated by -9999.
| Variable Name | Units | Description |
|---|---|---|
| StartTime_UTC | seconds | Start of sampling/reporting interval as seconds since midnight UTC from start of mission
|
| Stoptime_UTC | seconds | End of sampling/reporting interval as seconds since midnight UTC from start of mission |
| MidTime_UTC | seconds | Midpoint of sampling/reporting interval as seconds since midnight UTC from start of mission |
| LAT | deg | Aircraft latitude at time of sampling (*) |
| LON | deg | Aircraft longitude at time of sampling (*) |
| ALT | m | Aircraft GPS altitude at time of sampling (*) |
| AirmassClass | Coded according to Koenig et al., 2020.
|
|
| Iodine_PM1_AMS | ug sm-3 | Mass concentration of PM1 iodine aerosol in air by HR-AMS (AMS_PMCut=~1 um). Note that μg sm-3 are μg m-3 converted to standard pressure and temperature (STP) conditions of 1013 mbar, 273K without any evaporation/condensation. |
| Iodine_PM1_AMS_DL | ug sm-3 | Detection limit for the mass concentration of PM1 iodine aerosol in air by HR-AMS (AMS_PMCut=~1 um). |
| fI | Fractional contribution of I+ ion to the total iodine mass signal in the HR-AMS | |
| fHI | Fractional contribution of HI+ ion to the total iodine mass signal in the HR-AMS | |
| fI2 | Fractional contribution of I2+ ion to the total iodine mass signal in the HR-AMS |
(*) Reported by the AMS GPS at 1 Hz time resolution and averaged to the AMS time-base. For multisensor comparisons based on the campaign-wide mergers, use of the positional data from the MMS instrument reported in the main merge (Wofsy et al., 2018) is recommended.
Application and Derivation
ATom makes global-scale measurements of the chemistry of the atmosphere using the NASA DC-8 aircraft. Flights span the Pacific and Atlantic Oceans, nearly pole-to-pole, in continuous profiling mode, covering remote regions that receive long-range inputs of pollution from expanding industrial economies.
The HR-AMS instrument provides a high-quality, contiguous tropospheric dataset of quantitative particulate iodine concentrations with global coverage of the Pacific and Atlantic Ocean basins and seasonal variation. These data will be used to evaluate the contribution of particulate iodine to the total halogen budget in the lower stratosphere and its implications for ozone depletion.
Quality Assessment
Total accuracy estimate for the iodine concentration (2 standard deviations): +/-50% dominated by uncertainty in particle collection efficiency due to particle bounce (Bahreini et al., 2009) and the uncertainty in the relative ionization efficiency of ambient iodine compounds. Precision error (1 standard deviation) is around 10%, except close to the detection limit. Continuous detection limits and precision are provided as a variable (based on the method described in Drewnick et al., 2009) and were corrected by comparison with frequent, periodic blanks.
Iodine fractions are relative measurements and, for this dataset, are mostly influenced by precision (i.e., about 30% for a single data point). The calibration data in Koenig et al. (2020) is better than 5%.
Data Acquisition, Materials, and Methods
Instrument Information
The HR-AMS is an in-situ instrument that measures chemically speciated submicron particulate mass (excluding dust and black carbon). Ambient aerosol is sampled from a dedicated aircraft inlet and introduced into the instrument with minimal delay (0.4 s in the boundary layer), inlet performance was tested regularly by sampling at times from the Aerosol Microphysical Properties (AMP) instrument package inlet (Brock et al., 2019). The sample was not actively dried but inlet relative humidity is typically low due to the temperature gradient between ambient and cabin conditions. The instrument inlet is kept at constant pressure and has a well-characterized aerosol size-dependent transmission function (available upon request from authors) that needs to be taken into account for comparisons (Guo et al., 2020). Chemical analysis is performed by electron impact mass spectrometry of the volatilized aerosol (DeCarlo et al., 2006).
Data were acquired at 1 Hz. Instrumental background was taken every minute, while blanks were recorded every 15-20 min. Raw data were analyzed in 1-min cycles. For further details on these measurements and their interpretation, as well as the meaning of the intensive properties (ion fractions) and air mass classification flags, consult Koenig et al. (2020) and the FAQ for data users provided in Jimenez et al., (2020).
Data Processing
The following is a lightly edited excerpt from the “DATA_INFO” section of the header provided in the data files. Valuable information on instrument operating conditions, calibrations, and uncertainty can also be found in the header.
DATA_INFO: Only brief explanations are provided here. Please refer to http://tinyurl.com/FAQ-AMS-Data for additional topics and more detailed explanations or contact the authors. Both the web page and the file header are updated regularly in response to questions from data users and/or new information about the instrument and data interpretation.
All concentration data are reported under STP (273 K & 1013 MB); use the provided conversion factor to calculate under ambient temperature and pressure. Note that several other definitions of standard conditions are in use by others in the community, and some groups and models report under ambient and not standard conditions—check carefully before comparing!
Data were taken on a 1 min clock with 6 s background and 46 s ambient measurements, reported in 60 s increments. The remaining time was either instrument overhead or was spent taking particle size segregated data. Timebase is corrected for inlet lag (about 0.4 s in the BL). Latitude and longitude are provided (inlet lag adjusted) from the instruments' own GPS data feed, and pressure altitude from the aircraft data feed.
IMPORTANT: All reported data in the files were derived by analyzing the averaged raw data at 60 s resolution. It is NOT an arithmetic average of the data reported under the AMS dataset (https://doi.org/10.3334/ORNLDAAC/1716). Hence, it has a higher S/N than the simple average and should be preferentially used for longer timescales. All reported data (including the individual f_x marker fractions) are derived from fitting individual HR ions using PIKA 1.21F.
All reported data (including the individual f_x marker fractions) are derived from fitting individual HR ions using PIKA, and NOT by using the unit mass resolution (UMR) signal (Squirrel in AMS parlance). Iodine is reported for the first time based on RIE calibrations with I- and Ion- salts. Note that only the halogen is detected for the haloxides and the sensitivity is comparable regardless of oxidation state. Oxidation state can be inferred by evaluating the relative ion fractions of the main ions I+, HI+ and I2+ and comparing them to the calibrated values, with high I+ and I2+ indicating a positive oxidation state of iodine. Note that the ion fractions are not thresholded by iodine detection limit, and hence will exhibit both negative and values >1 in those cases. Longer, weighted (by iodine mass) averaging for such periods is needed and will provide unbiased averages.
AirmassClass is coded according to Koenig et al. (2020). For values of H2O/O3 greater than 100, air is unambiguously tropospheric, and is further differentiated into the upper troposphere (UT) (100<H2O/O3<1000, AirMassClass=0) and free troposphere (FT) (H2O/O3>1000, AirMassClass=-1), Values of H2O/O3 less than 20 identify unambiguously stratospheric air (AirmassClass=2). Intermediate values (20<H2O/O3<100) are assigned to AirMassClass=1. Airmasses with a significant biomass burning (BB) influence (as determined by the PALMS BB marker >0.4) are flagged as AirMassClass=-2
High-Resolution (Time-of-Flight) Aerosol Mass Spectrometer (HR-AMS):
| Instrument | Full Name | Contact Person | Type | Measurements |
|---|---|---|---|---|
| HR-AMS | CU Aircraft High-Resolution Aerosol Mass Spectrometer | Jose-Luis Jimenez | spectrometer (in situ) | aerosol mass |
The High-Resolution (Time-of-Flight) Aerosol Mass Spectrometer (HR-AMS) detects non-refractory submicron aerosol composition by impaction on a vaporizer at 600°C, followed by electron ionization and time-of-flight mass spectral analysis. Size-resolved composition can be quantified by measuring the arrival times of the aerosol at the vaporizer. For more information, see DeCarlo et al. (2006).
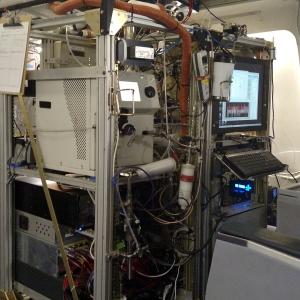
Figure 2. The HR-AMS instrument installed on the NASA DC-8 for the ATom-1 deployment.
Data Access
These data are available through the Oak Ridge National Laboratory (ORNL) Distributed Active Archive Center (DAAC).
ATom: L2 Particulate Iodine from High-Resolution Aerosol Mass Spectrometer (HR-AMS)
Contact for Data Center Access Information:
- E-mail: uso@daac.ornl.gov
- Telephone: +1 (865) 241-3952
References
Bahreini, R., B. Ervens, A.M. Middlebrook, C. Warneke, J.A. de Gouw, P.F. DeCarlo, J.L. Jimenez, C.A. Brock, J.A. Neuman, T.B. Ryerson, H. Stark, E. Atlas, J. Brioude, A. Fried, J.S. Holloway, J. Peischl, D. Richter, J. Walega, P. Weibring, A.G. Wollny, and F.C. Fehsenfeld. 2009. Organic aerosol formation in urban and industrial plumes near Houston and Dallas, Texas. Journal of Geophysical Research Atmospheres, 114:d7. https://doi.org/10.1029/2008JD011493
Brock, C., C. Williamson, A. Kupc, K. Froyd, F. Erdesz, N.L. Wagner, M.S. Richardson, J. Schwarz, R. Gao, J. Katich, P. Campuzano-Jost, B. Nault, J.C. Schroder, J. Jimenez-Palacios, B. Weinzierl, M. Dollner, T.P. Bui, and D. Murphy. 2019. Aerosol size distributions during the Atmospheric Tomography Mission (ATom): methods, uncertainties, and data products, Atmospheric Measurement Techniques, 12:3081-3099. https://doi.org/10.5194/amt-12-3081-2019
DeCarlo, P.F., J.R. Kimmel, A. Trimborn, M.J. Northway, J.T. Jayne, A.C. Aiken, M. Gonin, K. Fuhrer, T. Horvath, K.S. Docherty, and D.R. Worsnop. 2006. Field-deployable, high-resolution, time-of-flight aerosol mass spectrometer. Analytical Chemistry, 78(24): 8281-8289. https://doi.org/10.1021/ac061249n
Diskin, G.S., and J.P. DiGangi. 2019. ATom: L2 In Situ Atmospheric Water Vapor from the Diode Laser Hygrometer (DLH). ORNL DAAC, Oak Ridge, Tennessee, USA. https://doi.org/10.3334/ORNLDAAC/1710
Drewnick, F., S.S. Hings, M.R. Alfarra, A.S.H. Prevot, and S. Borrmann. 2009. Aerosol quantification with the Aerodyne Aerosol Mass Spectrometer: detection limits and ionizer background effects. Atmospheric Measurement Techniques, 2(1):33–46. https://doi.org/10.5194/amtd-1-169-2008
Guo, H, P. Campuzano-Jost, B. A. Nault, D. A. Day, J. C. Schroder, J.E. Dibb, M. Dollner, B. Weinzierl, and Jose L. Jimenez, 2020. The Importance of Size Ranges in Aerosol Instrument Intercomparisons: A Case Study for the ATom Mission, Atmos. Meas. Tech. Discuss., https://doi.org/10.5194/amt-2020-224
Jimenez, J.L., P. Campuzano-Jost, D.A. Day, B.A. Nault, D.J. Price, and J.C. Schroder. 2019. ATom: L2 Measurements from CU High-Resolution Aerosol Mass Spectrometer (HR-AMS). ORNL DAAC, Oak Ridge, Tennessee, USA. https://doi.org/10.3334/ORNLDAAC/1716,
Jimenez, J.L., P. Campuzano-Jost, D.A. Day, B.A. Nault, J.C. Schroder, and M.J. Cubison. Frequently Asked Questions for AMS Data Users. http://cires.colorado.edu/jimenez-group/wiki/index.php?title=FAQ_for_AMS_Data_Users.
Koenig, T.K., S. Baidar, P. Campuzano-Jost, C.A. Cuevas, B.K. Dix, R.P. Fernandez, H. Guo, S.R. Hall, D. Kinnison, B.A. Nault, K. Ullman, J.L. Jimenez, A. Saiz-Lopez, and R. Volkamer. 2020. First Quantitative Detection of Iodine in the Stratosphere. Proceedings of the National Academy of Sciences, 117(4):1860-1866. https://doi.org/10.1073/pnas.1916828117
Ryerson, T.B., C.R. Thompson, J. Peischl, and L. Bourgeois. 2019. ATom: L2 In Situ Measurements from NOAA Nitrogen Oxides and Ozone (NOyO3) Instrument. ORNL DAAC, Oak Ridge, Tennessee, USA. https://doi.org/10.3334/ORNLDAAC/1734
Wofsy, S.C., S. Afshar, H.M. Allen, E.C. Apel, E.C. Asher, B. Barletta, J. Bent, H. Bian, B.C. Biggs, D.R. Blake, N. Blake, I. Bourgeois, C.A. Brock, W.H. Brune, J.W. Budney, T.P. Bui, A. Butler, P. Campuzano-Jost, C.S. Chang, M. Chin, R. Commane, G. Correa, J.D. Crounse, P. D. Cullis, B.C. Daube, D.A. Day, J.M. Dean-Day, J.E. Dibb, J.P. DiGangi, G.S. Diskin, M. Dollner, J.W. Elkins, F. Erdesz, A.M. Fiore, C.M. Flynn, K.D. Froyd, D.W. Gesler, S.R. Hall, T.F. Hanisco, R.A. Hannun, A.J. Hills, E.J. Hintsa, A. Hoffman, R.S. Hornbrook, L.G. Huey, S. Hughes, J.L. Jimenez, B.J. Johnson, J.M. Katich, R.F. Keeling, M.J. Kim, A. Kupc, L.R. Lait, J.-F. Lamarque, J. Liu, K. McKain, R.J. Mclaughlin, S. Meinardi, D.O. Miller, S.A. Montzka, F.L. Moore, E.J. Morgan, D.M. Murphy, L.T. Murray, B.A. Nault, J.A. Neuman, P.A. Newman, J.M. Nicely, X. Pan, W. Paplawsky, J. Peischl, M.J. Prather, D.J. Price, E. Ray, J.M. Reeves, M. Richardson, A.W. Rollins, K.H. Rosenlof, T.B. Ryerson, E. Scheuer, G.P. Schill, J.C. Schroder, J.P. Schwarz, J.M. St.Clair, S.D. Steenrod, B.B. Stephens, S.A. Strode, C. Sweeney, D. Tanner, A.P. Teng, A.B. Thames, C.R. Thompson, K. Ullmann, P.R. Veres, N. Vieznor, N.L. Wagner, A. Watt, R. Weber, B. Weinzierl, P.O. Wennberg, C.J. Williamson, J.C. Wilson, G.M. Wolfe, C.T. Woods, and L.H. Zeng. 2018. ATom: Merged Atmospheric Chemistry, Trace Gases, and Aerosols. ORNL DAAC, Oak Ridge, Tennessee, USA. https://doi.org/10.3334/ORNLDAAC/1581