Documentation Revision Date: 2022-03-07
Dataset Version: 1
Summary
There are 94 data files in ICARTT (*.ict) format included in this dataset.
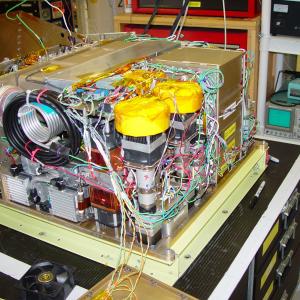
Figure 1. Photo of the interior of the PANTHER GC. This instrument was used during all ATom campaigns.
Citation
Moore, F.L., E.J. Hintsa, D. Nance, G. Dutton, B. Hall, and J.W. Elkins. 2022. ATom: Trace Gas Measurements from PANTHER Gas Chromatograph. ORNL DAAC, Oak Ridge, Tennessee, USA. https://doi.org/10.3334/ORNLDAAC/1914
Table of Contents
- Dataset Overview
- Data Characteristics
- Application and Derivation
- Quality Assessment
- Data Acquisition, Materials, and Methods
- Data Access
- References
Dataset Overview
This dataset contains measurements of various trace gases from the PAN and Trace Hydrohalocarbon ExpeRiment (PANTHER) across the four ATom campaigns. PANTHER uses Electron Capture Detection and Gas Chromatography (ECD-GC) and Mass Selective Detection and Gas Chromatography (MSD-GC) to measure numerous trace gases, including methyl halides, HCFCs, PAN, N2O, SF6, CFC-12, CFC-11, Halon 1211, methyl chloroform, carbon tetrachloride.
Project: Atmospheric Tomography Mission
The Atmospheric Tomography Mission (ATom) was a NASA Earth Venture Suborbital-2 mission. It studied the impact of human-produced air pollution on greenhouse gases and on chemically reactive gases in the atmosphere. ATom deployed an extensive gas and aerosol payload on the NASA DC-8 aircraft for systematic, global-scale sampling of the atmosphere, profiling continuously from 0.2 to 12 km altitude. Flights occurred in each of four seasons over a 4-year period.
Related Datasets
Wofsy, S.C., S. Afshar, H.M. Allen, E.C. Apel, E.C. Asher, B. Barletta, et al. 2021. ATom: Merged Atmospheric Chemistry, Trace Gases, and Aerosols, Version 2. ORNL DAAC, Oak Ridge, Tennessee, USA.https://doi.org/10.3334/ORNLDAAC/1925
- Data from all ATom instruments and all four flight campaigns, including aircraft location and navigation data, merged to several different time bases.
Wofsy, S.C., and ATom Science Team. 2018. ATom: Aircraft Flight Track and Navigational Data. ORNL DAAC, Oak Ridge, Tennessee, USA. https://doi.org/10.3334/ORNLDAAC/1613
- Flightpath (location and altitude) data for each of the four campaigns provided in KML and CSV formats.
Data Characteristics
Spatial Coverage: Global. Flights circumnavigate the globe, primarily over the oceans.
Spatial Resolution: Point measurements for all ECD-GC data sets except for PAN, which has a sample width that varies with altitude and averages at about 30 seconds. The MSD-ECD data sets have a uniform 3-minute integrated sample width.
Temporal Coverage: Periodic flights occurred during each campaign.
| Campaign | Date Range |
|---|---|
| ATom-1 | July 29 - August 23, 2016 |
| ATom-2 | January 26 - February 21, 2017 |
| ATom-3 | September 28 - October 28, 2017 |
| ATom-4 | April 24 - May 21, 2018 |
Temporal Resolution: Data points are taken every 70 or 140 seconds for the ECD-GC data sets, and every three minutes for the MSD-GC datasets.
Data File Information
There are 94 data files in ICARTT (*.ict) format included in this dataset. There are two files per flight date across the four ATom flight campaigns, and files conform to the ICARTT File Format Standards V1.1. The files are named GCECD_DC8_YYYYMMDD_R#.ict or GCMSD_DC8_YYYYMMDD_R#.ict, where YYYYMMDD is the start date (in UTC time) of the flight and # is the file version or revision number.
Table 1. File names and descriptions.
| File Name | Description |
|---|---|
| GCECD_DC8_YYYYMMDD_R#.ict | Measurements from the Electron Capture Detection and Gas Chromatography (ECD-GC). |
| GCMSD_DC8_YYYYMMDD_R#.ict | Measurements from the Mass Selective Detection and Gas Chromatography (MSD-GC). |
Data File Details
Missing data are indicated by -99999.
Table 2. Variable names and descriptions for files named GCECD_DC8_YYYYMMDD_R#.ict.
| Variable | Units | Description |
|---|---|---|
| Start_UTC | Seconds | Observation start time in seconds since 0000 UTC on flight date |
| Stop_UTC | Seconds | Observation end time in seconds since 0000 UTC on flight date |
| N2O_PECD | Dry mole fraction mixing ratio (ppb) | Nitrous oxide content |
| N2Oe_PECD | Dry mole fraction mixing ratio (ppb) | Nitrous oxide error estimate |
| SF6_PECD | Dry mole fraction mixing ratio (ppt) | Sulfur hexafluoride content |
| SF6e_PECD | Dry mole fraction mixing ratio (ppt) | Sulfur hexafluoride error estimate |
| CFC11_PECD | Dry mole fraction mixing ratio (ppt) | CFC-11 content |
| CFC11e_PECD | Dry mole fraction mixing ratio (ppt) | CFC-11 error estimate |
| CFC113_PECD | Dry mole fraction mixing ratio (ppt) | CFC-113 content |
| CFC113e_PECD | Dry mole fraction mixing ratio (ppt) | CFC-113 error estimate |
| CFC12_PECD | Dry mole fraction mixing ratio (ppt) | CFC-12 content |
| CFC12e_PECD | Dry mole fraction mixing ratio (ppt) | CFC-12 error estimate |
| H1211_PECD | Dry mole fraction mixing ratio (ppt) | Halon 1211 content |
| H1211e_PECD | Dry mole fraction mixing ratio (ppt) | Halon 1211 error estimate |
| CH4_PECD | Dry mole fraction mixing ratio (ppb) | Methane content |
| CH4e_PECD | Dry mole fraction mixing ratio (ppb) | Methane error estimate |
| CO_PECD | Dry mole fraction mixing ratio (ppb) | Carbon monoxide content |
| COe_PECD | Dry mole fraction mixing ratio (ppb) | Carbon monoxide error estimate |
| H2_PECD | Dry mole fraction mixing ratio (ppb) | Hydrogen content |
| H2e_PECD | Dry mole fraction mixing ratio (ppb) | Hydrogen error estimate |
| PAN_PECD | Dry mole fraction mixing ratio (ppt) | Peroxyacetyl nitrate content |
| PANe_PECD | Dry mole fraction mixing ratio (ppt) | Peroxyacetyl nitrate error estimate |
Table 3. Variable names and descriptions for files named GCMSD_DC8_YYYYMMDD_R#.ict.
| Variable | Units | Description |
|---|---|---|
| Start_UTC | Seconds | Observation start time in seconds since 0000 UTC |
| Stop_UTC | Seconds | Observation end time in seconds since 0000 UTC |
| CH3Cl_PMSD | Dry mole fraction mixing ratio (ppt) | Methyl chloride content |
| CH3Cle_PMSD | Dry mole fraction mixing ratio (ppt) | Methyl chloride error estimate |
| CH3Br_PMSD | Dry mole fraction mixing ratio (ppt) | Methyl bromide content |
| CH3Bre_PMSD | Dry mole fraction mixing ratio (ppt) | Methyl bromide error estimate |
| CH3I_PMSD | Dry mole fraction mixing ratio (ppt) | Methyl iodide content |
| CH3Ie_PMSD | Dry mole fraction mixing ratio (ppt) | Methyl iodide error estimate |
| HFC134a_PMSD | Dry mole fraction mixing ratio (ppt) | HFC134a content |
| HFC134ae_PMSD | Dry mole fraction mixing ratio (ppt) | HFC134a error estimate |
| HCFC22_PMSD | Dry mole fraction mixing ratio (ppt) | HCFC22 content |
| HCFC22e_PMSD | Dry mole fraction mixing ratio (ppt) | HCFC22 error estimate |
| HCFC141b_PMSD | Dry mole fraction mixing ratio (ppt) | HCFC141b content |
| HCFC141be_PMSD | Dry mole fraction mixing ratio (ppt) | HCFC141b error estimate |
| HCFC142b_PMSD | Dry mole fraction mixing ratio (ppt) | HCFC142b content |
| HCFC142be_PMSD | Dry mole fraction mixing ratio (ppt) | HCFC142b error estimate |
| OCS_PMSD | Dry mole fraction mixing ratio (ppt) | Carbonyl sulfide content. Note: The OCS measurements suffered from contamination issues and should not be used in analyses |
| OCSe_PMSD | Dry mole fraction mixing ratio (ppt) | Carbonyl sulfide error estimate |
| CS2_PMSD | Dry mole fraction mixing ratio (ppt) | Carbon disulfide content. Note: The CS2 measurements suffered from contamination issues and should not be used in analyses. |
| CS2e_PMSD | Dry mole fraction mixing ratio (ppt) | Carbon disulfide error estimate |
Application and Derivation
ATom builds the scientific foundation for mitigation of short-lived climate forcers, in particular, methane (CH4), tropospheric ozone (O3), and Black Carbon aerosols (BC).
ATom Science Questions
Tier 1
- What are chemical processes that control the short-lived climate forcing agents CH4, O3, and BC in the atmosphere? How is the chemical reactivity of the atmosphere on a global scale affected by anthropogenic emissions? How can we improve chemistry-climate modeling of these processes?
Tier 2
- Over large, remote regions, what are the distributions of BC and other aerosols important as short-lived climate forcers? What are the sources of new particles? How rapidly do aerosols grow to CCN-active sizes? How well are these processes represented in models?
- What type of variability and spatial gradients occurs over remote ocean regions for greenhouse gases (GHGs) and ozone-depleting substances (ODSs)? How do the variations among air parcels help identify anthropogenic influences on photochemical reactivity, validate satellite data for these gases, and refine knowledge of sources and sinks?
Significance
ATom delivers unique data and analysis to address the Science Mission Directorate's objectives of acquiring “datasets that identify and characterize important phenomena in the changing Earth system” and “measurements that address weaknesses in current Earth system models leading to improvement in modeling capabilities.” ATom will provide unprecedented challenges to the CCMs used as policy tools for climate change assessments, with comprehensive data on atmospheric chemical reactivity at global scales, and will work closely with modeling teams to translate ATom data to better, more reliable CCMs. ATom provides extraordinary validation data for remote sensing.
Quality Assessment
Error estimates for each trace gas concentration are provided in the data files. Error estimates are based on in-flight measurement precision of a calibration standard, the precision of laboratory measurements of a suite of calibration standards, and the goodness of fit of a simple curve to calibration data.
The CS2 and OCS measurements suffered from contamination issues and should not be used in analyses.
Data Acquisition, Materials, and Methods
Project Overview
ATom makes global-scale measurements of the chemistry of the atmosphere using the NASA DC-8 aircraft. Flights span the Pacific and Atlantic Oceans, nearly pole-to-pole, in continuous profiling mode, covering remote regions that receive long-range inputs of pollution from expanding industrial economies. The payload has proven instruments for in-situ measurements of reactive and long-lived gases, diagnostic chemical tracers, and aerosol size, number, and composition, plus spectrally resolved solar radiation and meteorological parameters.
Combining distributions of aerosols and reactive gases with long-lived GHGs and ODSs enables disentangling of the processes that regulate atmospheric chemistry: emissions, transport, cloud processes, and chemical transformations. ATom analyzes measurements using customized modeling tools to derive daily averaged chemical rates for key atmospheric processes and to critically evaluate Chemistry-Climate Models (CCMs). ATom also differentiates between hypotheses for the formation and growth of aerosols over the remote oceans.
PANTHER GC Instrument
PANTHER uses Electron Capture Detection with Gas Chromatography (ECD-GC) and Mass Selective Detection with Gas Chromatography (MSD-GC) to measure numerous trace gases, including methyl halides, HCFCs, HFCs, CFCs, Halon 1211, PAN, N2O, SF6, H2, CH4, CO and OCS. Additional information on the PANTHER GC can be found on the UCAR Instrument Sheet.
Data Access
These data are available through the Oak Ridge National Laboratory (ORNL) Distributed Active Archive Center (DAAC).
ATom: Trace Gas Measurements from PANTHER Gas Chromatograph
Contact for Data Center Access Information:
- E-mail: uso@daac.ornl.gov
- Telephone: +1 (865) 241-3952