Documentation Revision Date: 2018-09-18
Data Set Version: 1
Summary
Laboratory calibrations with a range of particle sizes and compositions show repeatability of the response function of the instrument to within 5-8% and no sensitivity in sizing performance to particle composition. Particle number, surface area, and volume concentrations from the data inversion are determined to be better than 20% for typical particle size distributions.
This dataset supports the publication in Atmos. Meas. Tech. by Williamson et al. (2018), which provides the results of NMASS calibration tests.
There are 12 data files in comma-separated format (.csv) with this dataset.
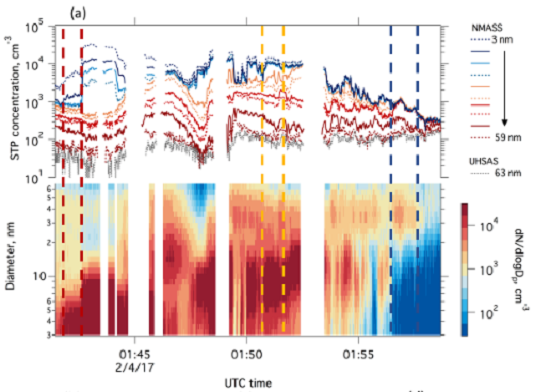
Figure 1. Example data taken on the NASA DC-8 aircraft during ATom in February 2017. The top of panel shows the STP number concentrations measured by each channel of both NMASSs, as well as the total concentration of particles from 63 to 1000 nm measured by the UHSAS. The bottom of panel shows the inverted size distribution. Figure 12 from Williamson et al. (2018).
Citation
Williamson, C.J., A. Kupc, J.C. Wilson, D.W. Gesler, J.M. Reeves, F. Erdesz, R.J. Mclaughlin, and C.A. Brock. 2018. ATom: Nucleation Mode Aerosol Size Spectrometer Calibration and Performance Data. ORNL DAAC, Oak Ridge, Tennessee, USA. https://doi.org/10.3334/ORNLDAAC/1607
Table of Contents
- Data Set Overview
- Data Characteristics
- Application and Derivation
- Quality Assessment
- Data Acquisition, Materials, and Methods
- Data Access
- References
Data Set Overview
This dataset provides extensive calibration and in-flight performance data for two nucleation mode aerosol size spectrometer (NMASS) instruments utilized in the NASA Atmospheric Tomography Mission (ATom). Each NMASS has five condensation particle counters (CPCs) that detect particles above a different minimum size, determined by the maximum vapor supersaturation encountered by the particles. Operated in parallel, the CPCs provide continuous concentrations of particles in different cumulative size classes between 3 and 60 nm. Knowing the response function of each CPC, numerical inversion techniques were applied to recover size distributions from the continuous concentrations. Data provided include: NMASS counting efficiencies and diameters of calibration aerosols, inverted particle size distributions; comparisons of NMASS and Scanning Mobility Particle Sizer (SMPS) results; and performance at flows, temperatures, and pressures measured by both NMASSs and comparison with Ultra-High Sensitivity Aerosol Spectrometer (UHSAS) concentrations collected on board the NASA DC-8 aircraft during an ATom flight in February 2017.
Laboratory calibrations with a range of particle sizes and compositions show repeatability of the response function of the instrument to within 5-8% and no sensitivity in sizing performance to particle composition. Particle number, surface area, and volume concentrations from the data inversion are determined to be better than 20% for typical particle size distributions.
Project: Atmospheric Tomography Mission (ATom)
The Atmospheric Tomography Mission (ATom) is a NASA Earth Venture Suborbital-2 mission. It will study the impact of human-produced air pollution on greenhouse gases and on chemically reactive gases in the atmosphere. ATom deploys an extensive gas and aerosol payload on the NASA DC-8 aircraft for systematic, global-scale sampling of the atmosphere, profiling continuously from 0.2 to 12 km altitude. Flights will occur in each of 4 seasons over a 4-year period.
Related Publication:
This dataset supports the publication in Atmos. Meas. Tech. by Williamson et al. (2018), which provides the results of NMASS calibration tests.
Williamson, C., Kupc, A., Wilson, J., Gesler, D. W., Reeves, J. M., Erdesz, F., McLaughlin, R., and Brock, C. A. 2018. Fast time response measurements of particle size distributions in the 30-60 nm size range with the nucleation mode aerosol size spectrometer, Atmos. Meas. Tech., 11, 3491-3509, https://doi.org/10.5194/amt-11-3491-2018
Acknowledgements:
This research was funded by NASA grant number NNH15AB12l.
Data Characteristics
Spatial Coverage: These data are mostly laboratory-derived; the spatial and temporal coverage reflect the ATom-1 and ATom-2 flights. Flights begin in California, fly north to the western Arctic, south to the South Pacific, east to the southern Atlantic, north to Greenland, and return to California across central North America.
Spatial Resolution: NA
Temporal Coverage: Periodic flights occurred during each deployment. ATom-1 was from July 29, 2016 - August 23, 2016 and ATom-2 was from January 26, 2017 - February 21, 2017.
Temporal Resolution: NA
Study area: Bounding box for the ATom flights (All latitude and longitude given in decimal degrees)
|
Site |
Westernmost Longitude |
Easternmost Longitude |
Northernmost Latitude |
Southernmost Latitude |
|
ATom -1 and 2 flights |
-180 |
180 |
80.52 |
-65.33 |
Data File Information
These are calibration data for two nucleation mode aerosol size spectrometer (NMASS) instruments utilized in the NASA ATom mission.
User Notes:
- CH = spectrometer channels
- CPC = condensation particle counters
- Where appropriate for generation of the respective figure, data not applicable are represented as NA or NaN, or the data cells maybe blank.
- The Values of 0 and 1 are true values.
The file names contain _figX to indicate a corresponding figure in the associated publication of Williamson et al., 2018.
Table 1. Data files and descriptions
| File name | Description |
|---|---|
| NMASS_diameter_d50_detection_fig3.csv | Calculated diameters using n-butanol (butanol), Fluorinet 43 (FC-43), and diethylene glycol (diethglycol) as the working fluids |
| NMASS_ efficiency_uncertainty_fig5.csv | Counting efficiency of the two NMASSes in the settings used for the ATom mission. The calibration was done using particles generated by ozonolysis of limonene. In the variable names below, NMX refers to NMASS 1 and NMASS 2, and cpcY refers to CPCs 1-5 |
| NMASS1_diameter_efficiency_uncert_amsul_fig6.csv | Counting efficiency and uncertainties of NMASS 1 using atomized ammonium sulphate (amsul) particles |
| NMASS1-2_efficiency_lim_amsul_dos_fig7.csv | NMASS 1, CPCs 4 and 5, and NMASS 2 CPC 5 particle diameter and counting efficiencies and uncertainties for limonene (lim) ozonolysis products, atomized ammonium sulphate (amsul), and dioctyl sebacate (dos) |
| NMASS2_cpc5_calibration_ct_efficiency_fig8.csv | Counting efficiency and particle diameters for three calibrations for NMASS 2 CPC 5 |
| SMPS_NMASS_inversions_particle_size_fig10.csv | Inverted particle size distributions from NMASS and Scanning Mobility Particle Sizer (SMPS) |
| NMass_flow_temp_pressure_fig11.csv | CPC flows, CPC temperatures, and instrument pressures measured by both NMASSes (NMx) over the total course of an ATom flight |
| NMASS1-2_UHSAS_STP_particle_conc_fig12a.csv | The data are the STP number concentrations (particles per cc) measured by each channel of both NMASS 1 and 2, as well as the total concentration of particles from 63-1000 nm measured by the UHSAS used to constrain the inversion and the ambient pressure. The data used were from the NASA DC-8 aircraft during the ATom campaign in February 2017 |
| NMASS1-2_inverted_1minute_diam_fig12lowpanel_logd.csv | Inverted size distributions (dN/dlogDp cm^-3) by corresponding time and diameters (nm). The data used for the inversion were from the NASA DC-8 aircraft during ATom in February 2017 |
| cpc_conc_dma_diameter_150_figS3.csv | CPC concentration at each Differential Mobility Analyzer (DMA) diameter, particle diameters selected by a DMA and uncertainties |
| inversion_diameter_lognormal_figS2.csv | Inversion diameter, size distributions, and fitted size distributions |
Table 2. Variables in the file NMASS_diameter_d50_detection_fig3.csv
| Column | Units/format | Description |
|---|---|---|
| deltaT | k | Temperature difference between CPC saturator and condenser for theoretical calculations |
| particle_diam_butanol | nm | Calculated activation diameter using butanol as the working fluid |
| particle_diam_diethglycol | nm | Calculated activation diameter using diethylene glycol as the working fluid |
| particle_diam_fc43 | nm | Calculated activation diameter using Fluorinert FC-43 as the working fluid |
| deltaT_d50 | k | Temperature difference between CPC saturator and condenser for measured points |
| d50 | nm | Diameter at which the CPC counts 50% of the particles |
Table 3. Variables in the file NMASS_efficiency_uncertainty_fig5.csv
Note that cpcY represents CPCs where Y is 1-5.
| Column | Units/format | Description |
|---|---|---|
| NMX_diam_particles | nm | Diameter of particles being measured in the calibration of NMASS 1 and NMASS2 |
| NMX_uncert_diam | nm | Uncertainty of the particle diameter, NMASS 1 and NMASS2 |
| NMX_cpcY_efficiency | ratio | Efficiency with which NMASS 1 and NMASS 2 CPCs 1-5 count particles of the given diameter. |
| NMX_cpcY_efficiency_uncert | ratio | Uncertainties of the counting efficiency data above for CPCs 1-5, NMASS 1 and NMASS 2 |
| fit_diam_cpc_efficiency | Diameter correlated to the fitted CPC efficiency | |
| NMX_cpcY_fit | Fitted efficiency for NMASS 1 and NMASS 2, CPCs 1-5 |
Table 4. Variables in the file NMASS1_diameter_efficiency_uncert_amsul_fig6.csv
| Columns | Unit/formats | Description |
|---|---|---|
| diam_particle | nm | Diameter of particles being measured in the calibration |
| diam_uncert | nm | Uncertainty of the particle diameter |
| cpcx_efficiency | ratio | Efficiency with which CPC x counts particles of the given diameter where cpcx= CPCs 1-5 |
| cpcx_efficiency_uncer | ratio | Uncertainty of the efficiency data above for each CPC, 1-5 |
Table 5. Variables in the file NMASS1-2_efficiency_lim_amsul_dos_fig7.csv
User note: Figure 7 in Williamson et al. 2018 shows data for NMASS 1, channel 3. This data file includes data for NMASS 1 and 2 but only includes data for channels 4 and 5.
| Column | Units/format | Description |
|---|---|---|
| particle_diam_dos | nm | Diameter of dioctyl sebocate (dos) particles |
| particle_diam_uncert_dos | nm | Dos particle diameter uncertainty |
| NM1_ch4_dos | ratio | Counting efficiency of NMASS 1 CH 4 dos particles |
| NM1_ch5_dos | ratio | Counting efficiency of NMASS 1 CH 5 dos particles |
| NM2_ch5_dos | ratio | Counting efficiency of NMASS 2 CH 5 dos particles |
| NM1_ch4_dos_uncert | ratio | Uncertainty of the efficiency with which NMASS 1 CH 4 counts dos particles of the given diameter |
| NM1_ch5_dos_uncert | ratio | Uncertainty of the efficiency with which NMASS 1 CH 5 counts dos particles of the given diameter |
| NM2_ch5_dos_uncert | ratio | Uncertainty of the efficiency with which NMASS 2 CH 5 counts dos particles of the given diameter |
| particle_diam_amsul | nm | Diameter of ammonium sulphate (amsul) particles |
| particle_diam_amsul_uncert | nm | Amsul particle diameter uncertainty |
| NM1_ch4_amsul | ratio | Counting efficiency of NMASS 1 CH 4 amsul particles |
| NM1_ch5_amsul | ratio | Counting efficiency of NMASS 1 CH 5 amsul particles |
| NM2_ch5_amsul | ratio | Counting efficiency of NMASS 2 CH 5 amsul particles |
| NM1_ch4_amsul_uncert | ratio | Uncertainty of the efficiency with which NMASS 1 CH 4 counts amsul particles of the given diameter |
| NM1_ch5_amsul_uncert | ratio | Uncertainty of the efficiency with which NMASS 1 CH 5 counts amsul particles of the given diameter |
| NM2_ch5_amsul_uncert | ratio | Uncertainty of the efficiency with which NMASS 2 CH 5 counts amsul particles of the given diameter |
| particle_diam_lim | nm | Diameter of limonene (lim) particles |
| particle_diam_lim_uncert | nm | Lim particle diameter uncertainty |
| NM1_ch4_lim | ratio | Counting efficiency of NMASS 1 CH 4 lim particles |
| NM1_ch5_lim | ratio | Counting efficiency of NMASS 1 CH 5 lim particles |
| NM2_ch5_ lim | ratio | Counting efficiency of NMASS 2 CH 4 lim particles |
| NM1_ch4_ lim_uncert | ratio | Uncertainty of the efficiency with which NMASS 1 CH 4 counts lim particles of the given diameter |
| NM1_ch5_lim_uncert | ratio | Uncertainty of the efficiency with which NMASS 1 CH 5 counts lim particles of the given diameter |
| NM2_ch5_lim_uncert | ratio | Uncertainty of the efficiency with which NMASS 2 CH 5 counts lim particles of the given diameter |
Table 6. Variables in the file NMASS2_cpc5_calibration_ct_efficiency_fig8.csv
| Column | Units/format | Description |
|---|---|---|
| particle_diam_cal1 | nm | Diameter of particles being measured in the first calibration |
| cpc5_1 | ratio | Counting efficiency of NMASS 2 CPC 5 for calibration 1 |
| particle_diam_cal2 | nm | Diameter of particles being measured in the second calibration |
| cpc5_2 | ratio | Counting efficiency of NMASS 2 CPC 5 for calibration 2 |
| particle_diam_cal3 | nm | Diameter of particles being measured in the third calibration |
| cpc5_3 | ratio | Counting efficiency of NMASS 2 CPC 5 for calibration 3 |
| particle_diam_fit | nm | Diameter for fits to calibrations |
| count_efficiency_fit_1 | ratio | Fitted counting efficiency for the first calibration |
| count_efficiency_fit_2 | ratio | Fitted counting efficiency for the second calibration |
| count_efficiency_fit_3 | ratio | Fitted counting efficiency for the third calibration |
| count_efficiency_fit_all | ratio | Fitted counting efficiency for all calibrations |
Table 7. Variables in the file SMPS_NMASS_inversions_particle_size_fig10.csv
| Column | Units/format | Description |
|---|---|---|
| NM_inv_diam | nm | Diameter for NMASS inversion |
| SMPS_inv_diam | nm | Diameter for SMPS inversion |
| size_distribution_NM_a | nm | dN/dlogD for first NMASS inversion |
| size_distribution_SMPS_a | nm | dN/dlogD for NMASS inversion a |
| size_distribution_NM_b_all | nm | dN/dlogD NMASS inversion b with NM2ch5 counting efficiency fitted to all calibrations |
| size_distribution_NM_b_1 | nm | dN/dlogD NMASS inversion b with NM2ch5 counting efficiency fitted to first calibration |
| size_distribution_NM_b_2 | nm | dN/dlogD NMASS inversion b with NM2ch5 counting efficiency fitted to second calibration |
| size_distribution_NM_b_3 | nm | dN/dlogD NMASS inversion b with NM2ch5 counting efficiency fitted to third calibration |
| size_distribution_SMPS_b | nm | dN/dlogD for SMPS inversion |
Table 8. Variables in the file NMass_flow_temp_pressure_fig11.csv
| Column | Units/format | Description |
|---|---|---|
| ambient_pressure | hPa | Ambient pressure |
| time | UTC | Time |
| NMx_deltaT_meas_cpcy | k | Measured temperature difference for NMx where x is NMASS 1 and NMASS 2 and cpcy is CPC 1-5 |
| NMx_Pdn | hPa | Internal pressure of NMASS 1 and also provided for MNASS 2 |
| NMx_Qtot | cc/min | Total flow on NMASS 1 and also provided for MNASS 2 |
Table 9. Variables in the file NMASS1-2_UHSAS_STP_particle_conc_fig12a.csv (see Figure 1).
| Column | Units/format | Description |
|---|---|---|
| time | Time | |
| NMx_conc_cpcy | particle per cc | STP concentration in NMASS 1 and NMASS 2 CPCs 1-5 (10 columns of data) |
| UHSAS_bin0 | Particle size distributions by the UHSAS |
*The efficiency of each NMASS CPC is taken as the ratio of the standard temperature and pressure (STP, taken as 273.16 K and 1013 hPa) concentration measured in the NMASS to that measured in the reference CPC. The concentration of the NMASS and reference CPCs is calculated as the number of pulses counted by the instrument per unit of time divided by the flow rate, corrected for dead time. This concentration is corrected for pressure and temperature to get the STP concentration.
Table 10. Description of data file NMASS1-2_inverted_1minute_diam_fig12lowpanel_logd.csv
Inverted size distributions (dN/dlogDp cm^-3) by corresponding time and diameters (nm) (see Figure 1). Columns are diameters ranging from 2.6 to 5335 nm and rows are time. Gaps in the data are where the aircraft flew through clouds, which can cause artifacts--NMASS data were removed and values set to -9999.
| diameter | 2.67375 | 3.0 | ... | 5334.8398 |
| time | ||||
| 3569015770 | -9999 | 49.6239 | 0 | |
| 3569015771 | -9999 | 103.4474 | 0 | |
| 3569015772 | -9999 | 1960.461 | 0 | |
| 3569015773 | -9999 | 6244.644 | 0 | |
| ... | ||||
| 3569018594 | -9999 | 26.56958199 | 0 | |
| 3569018595 | -9999 | 13.7481308 | 0 | |
| 3569018596 | -9999 | 13.91835117 | 0 |
Table 11. Variables in the file NMASS_inverted_av_size_distr_1min_fig12.csv
| Column | Units/format | Description |
|---|---|---|
| final_diam_20170203 | nm | Diameter for inverted data |
| size_distribution_mean_0141 | cm^-3 | Mean dN/dlogD for minute of 0141 |
| size_distribution_mean_0156 | cm^-3 | Mean dN/dlogD for minute of 0156 |
| size_distribution_mean_0150 | cm^-3 | Mean dN/dlogD for minute of 0150 |
Table 12. Variables in the file cpc_conc_dma_diameter_150_figS3.csv
These data are from a TSI 3776 CPC used as a reference instrument.
| Column | Units/format | Description |
|---|---|---|
| cpc_avg_conc_PSL_150 | cm^-3 | CPC concentration for 150nm PSL at each DMA diameter |
| cpc_avg_unc_150 | cm^-3 | Uncertainty on CPC concentration |
| dma_diam_avg_PSL_150 | nm | Diameter of particles selected by DMA |
| dma_diam_unc_psl_150 | nm | Uncertainty on DMA diameter |
| fit_cpc_avg_conc_PSL_150 | cm^-3 | Fit to CPC concentrations |
| fitX_cpc_avg_conc_PSL_150 | nm | Diameter for fitted CPC concentrations |
Table 13. Variables in the file inversion_diameter_lognormal_figS2.csv
| Column | Units/format | Description |
| inv_diam | nm | Diameter of inversion |
| lognormal_size_dist_case1 | cm^-3 | Size distribution for case 1, dn/dlogdp |
| lognormal_size_dist_case2 | cm^-3 | Size distribution for case 2, dn/dlogdp |
| lognormal_size_dist_case3 | cm^-3 | Size distribution for case 3, dn/dlogdp |
| lognormal_size_dist_case4 | cm^-3 | Size distribution for case 4, dn/dlogdp |
| lognormal_size_dist_case5 | cm^-3 | Size distribution for case 5, dn/dlogdp |
| lognormal_size_dist_case6 | cm^-3 | Size distribution for case 6, dn/dlogdp |
| lognormal_size_dist_case7 | cm^-3 | Size distribution for case 7, dn/dlogdp |
| fit_lognormal_size_dist_case3 | cm^-3 | Fitted size distribution for case 3, dndlogd |
| lognormal_SD_case8 | cm^-3 | Size distribution for case 8, dn/dlogdp |
| fit_lognormal_SD_case8 | cm^-3 | Fitted size distribution for case 8, dndlogd |
Application and Derivation
The two NMASS instruments provide a high-quality, contiguous tropospheric dataset of nucleation and Aitken-mode size distributions with global coverage of the Pacific and Atlantic Ocean basins and seasonal variation. These data will be used to evaluate the dominant mechanisms of atmospheric new particle formation and the contribution of nucleated particles to the global distribution of cloud-active particles and, through model sensitivity studies, their subsequent influence on radiative forcing.
Quality Assessment
The response function of each of the CPC channels was determined, and the repeatability of the d50 of each channel was determined to be better than 5% for all but one channels, which had a repeatability of 8%. An evaluation of the propagation of all uncertainties for a range of size distributions shows that particle number, surface area, and volume concentrations within the nucleation and Aitken size range can be determined to better than 20% for typical particle size distributions. Performance may be worse for very low concentrations of particles with modes at the extreme edges of the NMASS detection range. No sensitivity in sizing performance to particle composition was found for three diverse particle compositions.
Data Acquisition, Materials, and Methods
Calibration Methodology (from Williamson et al., 2018)
Two nucleation mode aerosol size spectrometers (NMASS) instruments were operated in parallel with five condensation particle counters (CPCs) per instrument in the NASA Atmospheric Tomography Mission (ATom). Each CPC detects particles above a different minimum size, determined by the maximum vapor supersaturation encountered by the particles. Operated in parallel, the CPCs provide continuous concentrations of particles in different cumulative size classes between 3 and 60 nm. Knowing the response function of each CPC, numerical inversion techniques can then be applied to recover a size distribution from the continuous concentrations while taking into account the non-ideal response function of each channel. By maintaining constant downstream pressure, the instrument operates reliably over a large range of ambient pressures and during rapid changes in altitude, making it ideal for aircraft measurements. Different working fluids including n-butanol (butanol), Fluorinet 43 (FC-43), and diethylene glycol (diethglycol) were evaluated to determine the best working fluid to reduce size variations caused by uncontrolled temperature fluctuations.
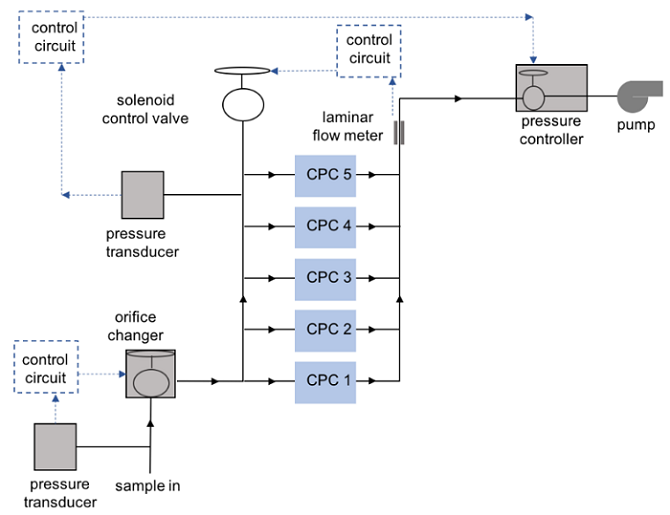
Figure 2. Schematic of the NMASS layout and flow system (Williamson et al., 2018).
Calibration, laboratory, and in-flight performance evaluations:
- Data from the NASA DC-8 aircraft during ATom in February 2017 were used to examine the STP (standard temperature and pressure taken as 273.16 K and 1013 hPa) number concentrations (particles per cc) measured by each channel of both NMASS 1 and 2, as well as the total concentration of particles from 63-1000 nm measured by the Ultra-High Sensitivity Aerosol Spectrometer (UHSAS) used to constrain the inversion and the ambient pressure.
- The counting efficiency of the two NMASSes were evaluated in the settings used for the ATom mission (downstream pressure at 120hPa saturator temperatures of both instruments are set to 39°C, condenser temperature of NMASS 1 are 2.6, 16.2, 21.4, 26.2 and 29.7°C and condenser temperatures of NMASS 2 are 12.2, 13.6, 20.4, 27.2 ad 30.7°C). The calibration was done using particles generated by ozonolysis of limonene.
- Laboratory studies were also used to determine the counting efficiencies of each NMASS CPC as a function of particle diameter. Aerosols used in the study were produced with three different methods: 1) limonene ozonolysis (lim), 2) atomization of ammonium sulphate (amsul), and 3) atomization of 2-diethylhexyl (dioctyl) sebacate (dos). These methods produce particles of widely differing composition that can help identify any composition-dependent sizing effects.
- The dependence of the counting efficiency with size was studied by placing a Boltzmann steady-state charge distribution on the generated particles with a Po-210 neutralizer and passing them through a nano-DMA to select particles of a single electrical mobility. The effect of composition on counting efficiency was evaluated by comparing response curves from a single channel for the three different particle compositions. Knowing the response function of each CPC, numerical inversion techniques were applied to recover a size distribution from the continuous concentrations while taking into account the non-ideal response function of each channel.
- Inverted particle size distributions from NMASS and Scanning Mobility Particle Sizer (SMPS), the standard technique for ground-based measurements of nucleation-mode particle size distributions, were examined. Aerosols were generated by atomizing ammonium sulphate, and particle sizes were selected by a DMA.
Refer to Williamson et al., 2018 for additional details.
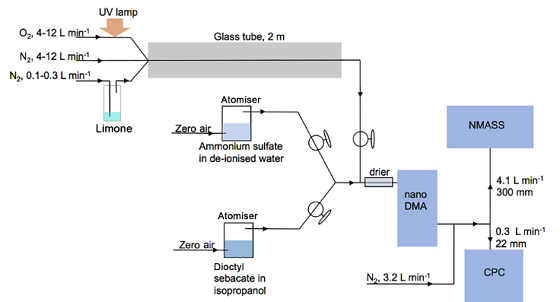
Figure 3. Diagram of the calibration set up used to characterize the NMASS counting efficiency as a function of particle diameter. The calibration includes different aerosol types such as limonene, ammonium sulfate, and dioctyl sebacate particles to test the instrument sensitivity to particle composition.
Data Access
These data are available through the Oak Ridge National Laboratory (ORNL) Distributed Active Archive Center (DAAC).
ATom: Nucleation Mode Aerosol Size Spectrometer Calibration and Performance Data
Contact for Data Center Access Information:
- E-mail: uso@daac.ornl.gov
- Telephone: +1 (865) 241-3952
References
Williamson, C., Kupc, A., Wilson, J., Gesler, D. W., Reeves, J. M., Erdesz, F., McLaughlin, R., and Brock, C. A. 2018. Fast time response measurements of particle size distributions in the 30-60nm size range with the nucleation mode aerosol size spectrometer, Atmos. Meas. Tech., 11, 3491-3509, https://doi.org/10.5194/amt-11-3491-2018