Documentation Revision Date: 2022-06-23
Dataset Version: 1
Summary
ATom-1 flew transects through the Pacific, Southern, Atlantic, and Arctic Oceans with the NASA DC-8 aircraft in July and August 2016. Each of the 11 flights included sampling profiles from the boundary layer to the top of the aircraft range (around 39,000 ft or 12,000 m).
There are six data files in Net CDF (.nc) format with his dataset - one file for each model.
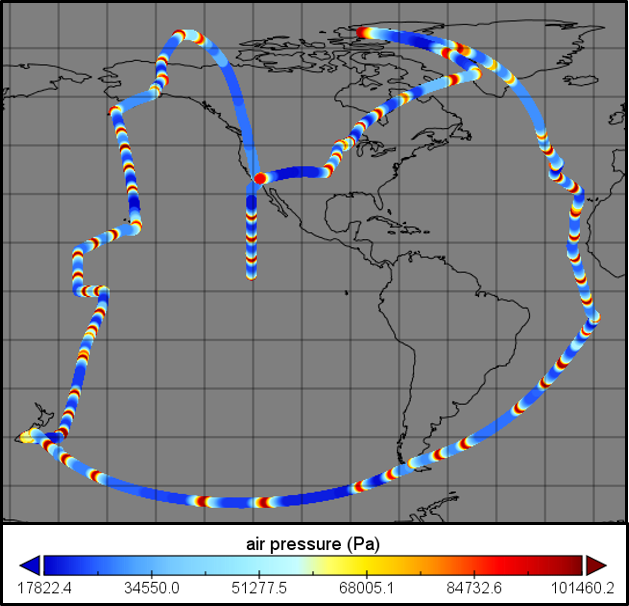
Figure 1. ATom-1 flight lines colored by the atmospheric pressure in each modeling data stream (MDS) air parcel. ATom flights originated from California, flew south over the Pacific Ocean, then north to the western Arctic, southwest to New Zealand, east to Chile and the Atlantic Ocean, north to Greenland, and returned to California across North America. During flights, the aircraft continuously profiled the atmosphere from 0.2 to 12 km altitude. High pressure (red) denotes the near-surface dip of a profile. (Source UCI_ReactivityDatastream_ATom-1.nc)
Citation
Flynn, C.M., M.J. Prather, S.A. Strode, S.D. Steenrod, L. Emmons, F. Lacey, L.T. Murray, G.M. Wolfe, M.J. Kim, J.D. Crounse, G.S. Diskin, J.P. DiGangi, B.C. Daube, R. Commane, K. McKain, T.B. Ryerson, C.R. Thompson, T.F. Hanisco, D.R. Blake, N. Blake, E.C. Apel, R.S. Hornbrook, J.W. Elkins, E.J. Hintsa, F.L. Moore, and S.C. Wofsy. 2019. ATom: Modeled Reactivities for Ozone and Methane for ATom-1 Air Parcels, 1997-2016. ORNL DAAC, Oak Ridge, Tennessee, USA. https://doi.org/10.3334/ORNLDAAC/1688
Table of Contents
- Dataset Overview
- Data Characteristics
- Application and Derivation
- Quality Assessment
- Data Acquisition, Materials, and Methods
- Data Access
- References
- Dataset Revisions
Dataset Overview
This dataset provides modeled reactivities for ozone (O3) production and loss, methane (CH4) loss, and photolysis rates (J-values) for O3 and nitrogen dioxide (NO2) for 31,429 unique ATom-1 flight line air parcels. The reactivities were modeled by six global 3D atmospheric chemistry models (UCAR, GEOS-Chem, GISS-E2l, GMI, and UCI) and F0AM, a photochemical box model.The reactivities are based on the ATom-1 Modeling Data Stream (MDS) constructed from the 10-second merged ATom-1 observations with interpolation and fill values. The air parcels were constructed by each model with MDS initialization values for the core set of species that control the primary reactivity of the remote troposphere plus temperature and water vapor. Each model derived reactivities for five days (24 hrs) in August (1, 6, 11, 16, and 21) to sample different weather and cloud patterns over the month. For the 3D models, average reactivities and J-values of the five daily values and standard deviations are reported for each parcel. For F0AM, the box model, only a mean is given. Each model provides data for one representative year between 1997-2016. These respective profiles of modeled reactivity data streams (RDS) will provide critical information for validation of satellite data, particularly in remote areas where in situ data is lacking.
ATom-1 flew transects through the Pacific, Southern, Atlantic, and Arctic Oceans with the NASA DC-8 aircraft in July and August 2016. Each of the 11 flights included sampling profiles from the boundary layer to the top of the aircraft range (around 39,000 ft or 12,000 m).
Project: Atmospheric Tomography Mission (ATom)
The Atmospheric Tomography Mission (ATom) was a NASA Earth Venture Suborbital-2 mission. It studied the impact of human-produced air pollution on greenhouse gases and on chemically reactive gases in the atmosphere. ATom deployed an extensive gas and aerosol payload on the NASA DC-8 aircraft for systematic, global-scale sampling of the atmosphere, profiling continuously from 0.2 to 12 km altitude. Flights occurred in each of four seasons over a 4-year period.
Related Publication:
Flynn, C.M., M.J. Prather, S.A. Strode, S.D. Steenrod, L. Emmons, F. Lacey, A.M. Fiore, G. Correa, L.T. Murray, G. Wolfe, M. Kim, J. Crounse, G. Diskin, J. DiGangi, B.C. Daube, R. Commane, K. McKain, T.B. Ryerson, C.Thompson, T.F. Hanisco, D. Blake, N. Blake, E. Apel, R. Hornbrook, J. Elkins, E. Hintsa, F. Moore, and S. Wofsy. Chemical Reactivity in the Remote Troposphere: Patterns and Heterogeneity based on ATom measurements (2019, in process).
Related Datasets:
Flynn, C.M., M.J. Prather, S.A. Strode, S.D. Steenrod, L. Emmons, F. Lacey, A. Fiore, G. Correa, L.T. Murray, G.M. Wolfe, M.J. Kim, J.D. Crounse, G.S. Diskin, J.P. DiGangi, B.C. Daube, R. Commane, K. McKain, T.B. Ryerson, C.R. Thompson, T.F. Hanisco, D.R. Blake, N. Blake, E. Apel, R.S. Hornbrook, J.W. Elkins, E.J. Hintsa, F.L. Moore, and S.C. Wofsy. 2019. ATom: Alternative Modeled Reactivities, Ozone and Methane, ATom-1 Air Parcels, 2016. ORNL DAAC, Oak Ridge, Tennessee, USA. https://doi.org/10.3334/ORNLDAAC/1687
Wofsy, et al. 2018. ATom: Merged Atmospheric Chemistry, Trace Gases, and Aerosols. ORNL DAAC, Oak Ridge, Tennessee, USA. https://doi.org/10.3334/ORNLDAAC/1581
Prather, M.J., C.M. Flynn, A. Fiore, G. Correa, S.A. Strode, S.D. Steenrod, L.T. Murray, and J.-F. Lamarque. 2018. ATom: Simulated Data Stream for Modeling ATom-like Measurements. ORNL DAAC, Oak Ridge, Tennessee, USA. https://doi.org/10.3334/ORNLDAAC/1597
Acknowledgements:
This study was funded with NASA grant numbers NNX15AJ23G and NNX15AG57A.
Data Characteristics
Spatial Coverage: ATom-1 flights over the Pacific, Southern, Atlantic, and Arctic Oceans
Spatial Resolution: Each air parcel is ~2.5 km horizontal by 160 m vertical
Temporal Coverage: 1997-08-01 to 2016-08-21
Temporal Resolution: Air parcels collected at ~8 to 12 second intervals
Study Area (coordinates in decimal degrees).
| Site | Northern Extent | Southern Extent | Western Extent | Eastern Extent |
|---|---|---|---|---|
| ATom-1 flights | 80.00 | -65.33 | 178.99 | -180.00 |
Data file information
There are six data files in NetCDF (.nc) format. The files provide O3 production and loss, CH4 loss, and O3 and NO2 photolysis rates (in the troposphere) for each of the 31,429 air parcels for one representative year between 1997-2016. The data variables are the same for all files (refer to Table 2). Spatial reference is the standard WGS84 (EPSG = 4326).
These netCDF files are formatted as Climate and Forecast (CF) compliant with featureType = "trajectory". For more information on trajectory files see: http://cfconventions.org/cf-conventions/cf-conventions.html#_single_trajectory. You can use the Panoply Data Viewer (https://www.giss.nasa.gov/tools/panoply/) to open, plot, and export the data.
Table 1. File names and descriptions
| File name | Description |
|---|---|
| UCI_ReactivityDatastream_ATom-1.nc | Provides data from the UC Irvine (UCI) chemical transport model |
| NCAR_ReactivityDatastream_ATom-1.nc | Provides data from the National Center for Atmospheric Research (NCAR) model |
| GMI_ReactivityDatastream_ATom-1.nc | Provides data from the Global Modeling Initiative (GMI) chemical transport model |
| GISS_ReactivityDatastream_ATom-1.nc | Provides data from the NASA Goddard Institute for Space Studies GISS-E2 model |
| GC_ReactivityDatastream_ATom-1.nc | Provides data from the GEOS-Chem model |
| F0AM_ReactivityDatastream_ATom-1.nc | Provides data results from the photochemical box model F0AM |
Table 2. Variables in the data files
| Parameter | Units | Description |
|---|---|---|
| ATom_parcel | Parcel number in ascending order for each air parcel | |
| time | seconds |
Defined as "seconds since 2016-01-01 00:00:00.0 UTC. The interval between parcel observations is 8 or 12 seconds. |
| longitude | degrees | Degrees east |
| latitude | degrees | Degrees north |
| pressure | Pa | Air pressure |
| rate_of_production_mole_fraction_of_ozone_in_air_due_to_chemical_production | mole fraction/day | Rate of production (mole fraction) of ozone in air due to chemical production |
| rate_of_production_stddev_mole_fraction_of_ozone_in_air_due_to_chemical_production | mole fraction/day | Standard deviation of the rate of production (mole fraction) of ozone in air due to chemical production |
| rate_of_loss_mole_fraction_of_ozone_in_air_due_to_chemical_loss | mole fraction/day | 24-hr average rate of loss of ozone in air due to chemical loss, in mole fraction/day |
| rate_of_loss_stddev_mole_fraction_of_ozone_in_air_due_to_chemical_loss | mole fraction/day | 24-hr average rate of loss of ozone in air due to chemical loss, in mole fraction/day |
| rate_of_loss_mole_fraction_of_methane_in_air_due_to_chemical_loss | mole fraction/day | Rate of loss of methane in air due to chemical loss, in mole fraction/day |
| rate_of_loss_stddev_mole_fraction_of_methane_in_air_due_to_chemical_loss | mole fraction/day | Stand deviation of the rate of loss of methane in air due to chemical loss, in mole fraction/day |
| photolysis_rate_of_ozone_to_1D_oxygen_atom | 1/s/day | 24-hr average photolysis rate of ozone to O(1D), in 1/s/day |
| photolysis_rate_stddev_of_ozone_to_1D_oxygen_atom | 1/s/day | Standard deviation of the 24-hr average photolysis rate of ozone to O(1D), in 1/s/day |
| photolysis_rate_of_nitrogen_dioxide | 1/s/day | 24-hr average photolysis rate of NO2, in 1/s/day |
| photolysis_rate_stddev_of_nitrogen_dioxide | 1/s/day | Standard deviation of the 24-hr average photolysis rate of NO2, in 1/s/day |
Application and Derivation
The ATom data will be used to improve the representation of chemically reactive gases and short-lived climate forcers in global models of atmospheric chemistry and climate. The profiles of the reactive gases will also provide critical information for validation of satellite data, particularly in remote areas where in situ data is lacking (Wofsy et al., 2018). This work represents a significant, new accomplishment in that we are able to constrain full, 3D models to measurements for the purpose of calculating tropospheric reactivity (Flynn et al., 2019, in process).
Quality Assessment
The standard deviations of the reactivities were computed and included within the datasets. This serves as a proxy for uncertainty due to noise and synoptic variability of cloud fields.
Data Acquisition, Materials, and Methods
ATom-1 Flights
ATom-1 flew transects through the Pacific, Southern, Atlantic, and Arctic Oceans with the NASA DC-8 aircraft in July and August 2016. Each of the 11 flights included sampling from the boundary layer to the top of the aircraft range (around 39,000 ft; 12,000 m). Details of the ATom mission and data sets can be found on the NASA mission web site (https://espo.nasa.gov/atom/content/ATom) and at the final archive at the Oak Ridge National Laboratory Distributed Active Archive Center (ORNL DAAC).
ATom-1 Modeling Data Stream (MDS)
A modeling data stream (MDS) based on the 10-second merged observations (Wofsy et al., 2018) with interpolation and fill values was constructed containing 31,429 air parcel records of latitude, longitude, pressure, temperature, and chemical composition from the 11 research flights. Landing and takeoff data are stripped. Each record is effectively an air parcel of approximate size 2.5 km horizontal by 160 m vertical. Due to the typical profiling sequence (level at cruise for 10 min, descent for 20 min, level flight at 500 ft over the ocean for 5 min, and a 20-min climb back to cruise altitude) and to the occasional requirements of weather or air traffic control, the sampling is skewed towards the uppermost troposphere (P < 300 hPa) and, secondly, the marine boundary layer. The MDS provides a global, continuous, dense, 10-second data stream for the purpose of initializing 3D models and calculating the tropospheric reactivities (P-O3, L-O3, and L-CH4) for each MDS air parcel. ATom-1 MDS Source Data: For additional information on the MDS and the MDS data, refer to: https://espoarchive.nasa.gov/archive/browse/atom/DC8/MDS
ATom-1 Reactivity Data Stream (RDS)
As described in (Flynn et al., 2019, in process), the focus of their study was the core set of species that control the primary reactivity of the remote troposphere, specifically the chemical tendencies of O3 and CH4. The key species are O3, H2O, NOx, CO, HNO3, HNO4, H2O2, methyl hydroperoxide (CH3OOH), HCHO, CH4, peroxy acetyl nitrate (PAN), methyl nitrate (MeONO2), higher organic nitrates, isoprene, acetone, acetaldehyde, ethane and higher alkanes, alkenes, alkynes, and the aromatic species benzene, toluene, and xylene.
The MDS was ran through five global chemistry-climate (CCM) or chemical transport (CTM) models- CAM, GEOS-Chem, GISS-E2, GMI, UCI, and a photochemical box model, F0AM. Each of the six models produced ozone production and loss and methane loss reactivities (RDS) for the parcels initialized using the MDS values beginning with five different days in August (08/01, 08/06, 08/11, 08/16, 08/21) to sample different weather and cloud patterns over the month for one representative year between 1997-2016. Average reactivities and J-values of the five daily values and standard deviations are reported for each parcel.
Calculating Chemical Reactivities
The MDS is designed to provide the information about the location, physical state, and chemical composition necessary to initialize a grid cell in the global chemistry models and integrate the photochemistry for 24 hours. For details on calculating reactivities and photolysis rates (J-values) see Flynn et al., 2019 (in process).
Data Access
These data are available through the Oak Ridge National Laboratory (ORNL) Distributed Active Archive Center (DAAC).
ATom: Modeled Reactivities for Ozone and Methane for ATom-1 Air Parcels, 1997-2016
Contact for Data Center Access Information:
- E-mail: uso@daac.ornl.gov
- Telephone: +1 (865) 241-3952
References
Flynn, C.M., M.J. Prather, S.A. Strode, S.D. Steenrod, L. Emmons, F. Lacey, A.M. Fiore, G. Correa, L.T. Murray, G. Wolfe, M. Kim, J. Crounse, G. Diskin, J. DiGangi, B.C. Daube, R. Commane, K. McKain, T.B. Ryerson, C.Thompson, T.F. Hanisco, D. Blake, N. Blake, E. Apel, R. Hornbrook, J. Elkins, E. Hintsa, F. Moore, and S. Wofsy. Chemical Reactivity in the Remote Troposphere: Patterns and Heterogeneity based on ATom measurements (2019, in review).
Wofsy, et al. 2018. ATom: Merged Atmospheric Chemistry, Trace Gases, and Aerosols. ORNL DAAC, Oak Ridge, Tennessee, USA. https://doi.org/10.3334/ORNLDAAC/1581
Dataset Revisions
The datafiles for this dataset are restricted as the data provider discovered errors in this dataset as part of the final review step. Corrected data are in https://doi.org/10.3334/ORNLDAAC/1877