Documentation Revision Date: 2019-02-14
Dataset Version: 1
Summary
ATom profiles were executed “en route” along the flight track (as opposed to spirals) and typically spanned 200-450 km of horizontal distance and variable altitude ranges (typical minima and maxima of < 1 km and > 6 km). Profiles were excluded if they failed to meet criteria for solar zenith angle, sampling altitude range, missing or filled data, cloud cover, or were over land. These sampling profiles are considered representative of the remote troposphere or background regions over the Pacific and Atlantic Oceans that were far-removed from anthropogenic emission sources. A total of 139 profiles were selected.
There are two data files in comma-separated (.csv) format with this dataset and a readme.txt file as a companion file.
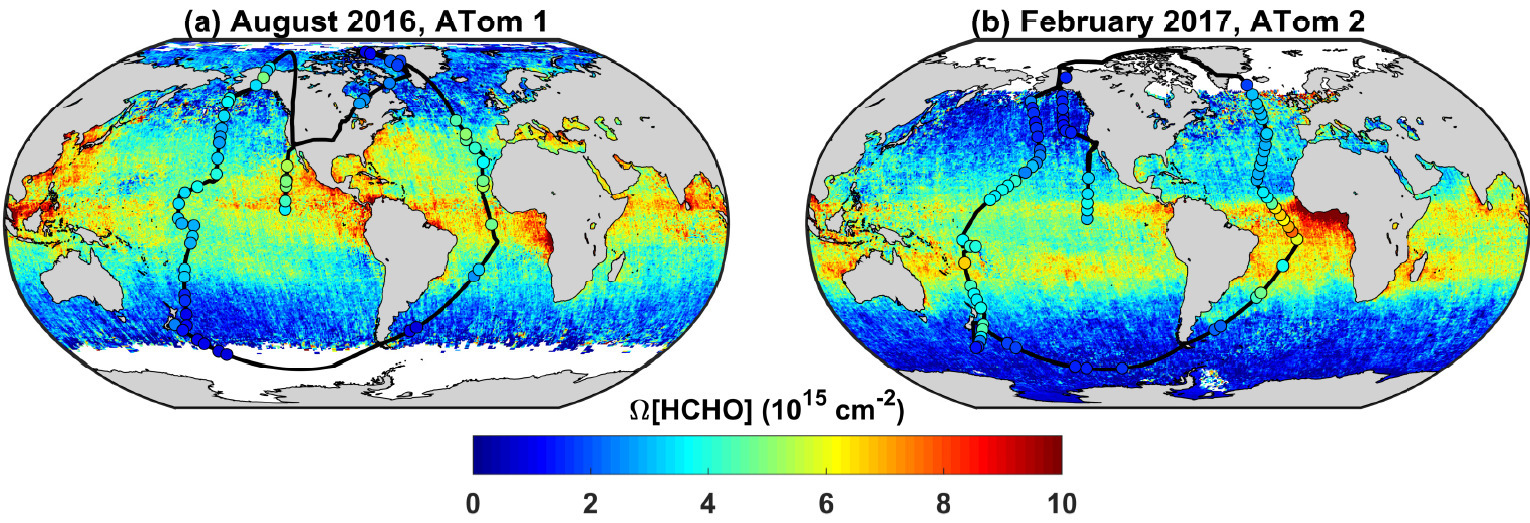
Figure 1. Black lines show full flight tracks for ATom missions 1 (a) and 2 (b). Circles mark the locations of the 139 selected profiles sampling the remote troposphere. Circle color indicates HCHO column densities integrated over each ATom profile. Data are overlain on global gridded OMI HCHO column densities averaged over each mission. From Wolfe et al. (2019).
Citation
Wolfe, G.M., J.M. Nicely, J.M. St.Clair, T.F. Hanisco, J. Liao, L. Oman, W.H. Brune, D.O. Miller, A.B. Thames, G.G. Abad, T.B. Ryerson, J. Peischl, K. Mccain, C. Sweeney, P. Wennberg, M.J. Kim, J.D. Crounse, S.R. Hall, K. Ullmann, G.S. Diskin, T.P. Bui, C.S. Chang, and J.M. Dean-Day. 2019. ATom: Column-Integrated Densities of Hydroxyl and Formaldehyde in Remote Troposphere. ORNL DAAC, Oak Ridge, Tennessee, USA. https://doi.org/10.3334/ORNLDAAC/1669
Table of Contents
- Dataset Overview
- Data Characteristics
- Application and Derivation
- Quality Assessment
- Data Acquisition, Materials, and Methods
- Data Access
- References
Dataset Overview
This dataset provides profile-integrated column densities of formaldehyde (HCHO), hydroxyl (OH), and OH production rates, diel tropospheric mean OH concentrations, and uncertainties that were derived from direct observation data from selected profiles of NASA Atmospheric Tomography (ATom) mission 1 and 2 flights for the period July 29, 2016 to February 21, 2017. These calculated products were combined with coincident HCHO column retrievals from the Ozone Monitoring Instrument (OMI) to scale and extend the profile results to a global gridded (0.5 deg latitude x 0.625 deg longitude) product. In addition to OMI formaldehyde column data, model output products from the Global Modeling Initiative (GMI) including average tropopause height, scaling factor, column air mass, and column-average formaldehyde photolysis frequency are provided. The GMI model output products were used in calculations and are included for user convenience.
ATom profiles were executed “en route” along the flight track (as opposed to spirals) and typically spanned 200-450 km of horizontal distance and variable altitude ranges (typical minima and maxima of < 1 km and > 6 km). Profiles were excluded if they failed to meet criteria for solar zenith angle, sampling altitude range, missing or filled data, cloud cover, or were over land. These sampling profiles are considered representative of the remote troposphere or background regions over the Pacific and Atlantic Oceans that were far-removed from anthropogenic emission sources. A total of 139 profiles were selected.
Project: Atmospheric Tomography Mission (ATom)
The Atmospheric Tomography Mission (ATom) was a NASA Earth Venture Suborbital-2 mission. It studied the impact of human-produced air pollution on greenhouse gases and on chemically reactive gases in the atmosphere. ATom deployed an extensive gas and aerosol payload on the NASA DC-8 aircraft for systematic, global-scale sampling of the atmosphere, profiling continuously from 0.2 to 12 km altitude. Flights occurred in each of 4 seasons over a 4-year period.
Related Publication:
This dataset archives all parameters needed to reproduce the figures and analysis of the related publication:
Wolfe, G.M., J.M. Nicely, J.M. St. Clair, T.F. Hanisco, J. Liao, L.D. Oman, W.B. Brune, D. Miller, A. Thames, G.G. Abad, T.B. Ryerson, C.R. Thompson, J. Peischl, K. McCain, C. Sweeney, P.O. Wennberg, M. Kim, J.D. Crounse, S.R. Hall, K. Ullmann, G. Diskin, P. Bui, C. Chang, and J.Dean-Day. 2019. Mapping Hydroxyl Variability Throughout the Global Remote Troposphere via Synthesis of Airborne and Satellite Formaldehyde Observations. PNAS (2019), submitted
Related Dataset:
Wofsy, et al. 2018. ATom: Merged Atmospheric Chemistry, Trace Gases, and Aerosols. ORNL DAAC, Oak Ridge, Tennessee, USA. https://doi.org/10.3334/ORNLDAAC/1581
Data Characteristics
Spatial Coverage:
ATom traversed the Pacific and Atlantic Oceans. Gridded data and model output provides global coverage.
Spatial Resolution:
The selected atmospheric profiles extended 200-450 km horizontally along the ATom 1 and 2 flight paths. Global gridded data are provided on a 0.5 deg latitude x 0.625 deg longitude grid.
Temporal Coverage:
ATom-1 was from July 29, 2016 - August 23, 2016 and ATom-2 was from January 26, 2017 - February 21, 2017.
Temporal Resolution:
ATom in situ observations of HCHO and OH concentrations and constituents used to derive production rates were reported at 1 Hz, except for OH and HO2, which are reported every 30 s (ATom 1) or 20 s (ATom 2). Modeled products were averaged over the 26 day duration of the respective ATom missions' flights.
Study Area (Coordinates in decimal degrees).
| Site | Northern Extent | Southern Extent | Western Extent | Eastern Extent |
|---|---|---|---|---|
| Global gridded data and model output | 90 | -90 | -180 | 179.375 |
| ATom-1and 2 flights (limited to western hemisphere with occasional excursions across -180/180) | 80 | -65 | -179.5 | 179.5 |
Data file information
There are two data files in comma-separated (.csv) format with this dataset.
atom_integrated_columns.csv: This file contains ATom-integrated vertical profile data used in Figs. 1-3 of Wolfe et al. (2019). Included are the characteristics of the 139 selected profiles and the respective profiles integrated OH and HCHO concentrations and rates. Data not provided are reported as -999. Please be advised that several columns are formatted in scientific notation (e.g., 3.57E+12, 1.74E-05). For each ATom profile, OMI retrievals for the relevant mission were sampled and averaged over all grid cells intersected by the flight path.
Table 1. Variables in the file atom_integrated_columns.csv
| Column | Units/format | Description |
|---|---|---|
| profile_number | Unique identifier for each profile, consisting of 5 digits: first digit is mission number, second/third digits are flight number (per mission), last two digits are profile number (per flight) | |
| date | YYYYMMDD | UTC date at midpoint of profile |
| UTC_sec_of_day | s | UTC seconds of day at midpoint of profile |
| mission_number | ATom mission number | |
| flight_number | ATom flight number-starts at 1 for each mission | |
| latitude_start | Decimal degrees | Latitude at beginning of profile |
| latitude_mid | Decimal degrees | Latitude at middle of profile |
| latitude_stop | Decimal degrees | Latitude at end of profile |
| longitude_start | Decimal degrees | Longitude at beginning of profile |
| longitude_mid | Decimal degrees | Longitude at middle of profile |
| longitude_stop | Decimal degrees | Longitude at end of profile |
| hcho | cm^-2 | Profile-integrated formaldehyde concentration (column integrated number density) |
| oh | cm^-2 | Profile-integrated hydroxyl concentration (column integrated number density) |
| p_oh | cm^-2 s^-1 | Profile-integrated hydroxyl production rate |
| k_hcho | s^-1 | Profile-integrated formaldehyde loss frequency (photolysis + OH loss) |
| j_hcho | s^-1 | Profile-integrated formaldehyde photolysis frequency |
| hcho_err | cm^-2 | 1-sigma uncertainty in hcho (column integrated number density) |
| oh_err | cm^-2 | 1-sigma uncertainty in oh (column integrated number density) |
| p_oh_err | cm^-2 s^-1 | 1-sigma uncertainty in p_oh |
| k_hcho_err | s^-1 | 1-sigma uncertainty in k_hcho |
| j_hcho_err | s^-1 | 1-sigma uncertainty in j_hcho |
| omi_hcho | cm^-2 | OMI formaldehyde columns averaged over ATom profiles (column integrated number density) |
| omi_hcho_err | cm^-2 | 1-sigma uncertainty in omi_hcho. The error is a best estimate based on internal data variability and is constant (column integrated number density) |
omi_gridded_hcho_and_xoh.csv: This file contains gridded data and model output used in Figs. 1, 4, and 5 of Wolfe et al. (2019). Values are temporal averages over ATom 1 (29 July – 23 August 2016) or ATom 2 (January – 21 February 2017). Spatial resolution is a 0.5 deg latitude x 0.625 deg longitude grid. Data not provided are reported as -999. Please be advised that several columns are formatted in scientific notation (e.g., 3.57E+12, 1.74E-05).
Table 2. Variables in the file omi_gridded_hcho_and_xoh.csv
| Column | Units/format | Description |
|---|---|---|
| latitude | Decimal degrees | Grid center latitude |
| longitude | Decimal degrees | Grid center longitude |
| land | Grid land mask. 1 = land, 0 = water | |
| hcho_omi_atom1 | cm^-2 | OMI formaldehyde vertical column density, gridded and averaged over ATom 1 |
| j_hcho_gmi_atom1 | s^-1 | GMI column-average formaldehyde photolysis frequency for ATom 1 |
| K_hcho_calc_atom1 | s^-1 | Column-average formaldehyde total loss frequency for ATom 1 |
| xoh_atom1 | cm^-3 | 24-hour tropospheric column mean OH concentration for ATom 1 |
| xoh_err_rand_atom1 | cm^-3 | 1-sigma random uncertainty in xoh_atom1 solely from OMI HCHO uncertainty |
| xoh_err_syst_atom1 | cm^-3 | 1-sigma systematic uncertainty in xoh_atom1. Includes contributions from fitting coefficients and j_hcho |
| tp_height_atom1 | km | GMI output average tropopause height for ATom 1 |
| scale_diel_oh_atom1 | Scaling factor to convert 1300LT to 24-hour average OH. Calculated using GMI OH | |
| air_mass_atom1 | kg | GMI output column air mass for ATom1 |
| hcho_omi_atom2 | cm^-2 | OMI formaldehyde vertical column density, gridded and averaged over ATom 2 |
| j_hcho_gmi_atom2 | s^-1 | GMI column-average formaldehyde photolysis frequency for ATom 2 |
| k_hcho_calc_atom2 | s^-1 | Column-average formaldehyde total loss frequency for ATom 2 |
| xoh_atom2 | cm^-3 | 24-hour tropospheric column mean OH concentration for ATom 2 |
| xoh_err_rand_atom2 | cm^-3 | 1-sigma random uncertainty in xoh_atom2 solely from OMI HCHO uncertainty |
| xoh_err_syst_atom2 | cm^-3 | 1-sigma systematic uncertainty in xoh_atom2. Includes contributions from fitting coefficients and j_hcho |
| tp_height_atom2 | km | GMI output average tropopause height for ATom 2 |
| scale_diel_oh_atom2 | Scaling factor to convert 1300LT to 24-hour average OH. Calculated using GMI OH | |
| air_mass_atom2 | kg | GMI output column air mass for ATom 2 |
Application and Derivation
The in situ observations from NASA’s Atmospheric Tomography (ATom) mission was combined with HCHO column retrievals from the Ozone Monitoring Instrument (OMI) to quantify OH throughout the remote troposphere and provide a global distribution of remote tropospheric OH which can be used to explore the seasonality, interhemispheric gradients, and regional variability of remote oxidizing capacity (Wolfe et al., 2019).
Quality Assessment
Uncertainty was estimated as follows: 1) for each grid cell, calculate the fitting error-weighted standard deviation of the mean when averaging over each campaign; 2) find the median of all such values over the remote Pacific reference sector region (140 to 160 deg W, all latitudes). This method resulted in an uncertainty estimate of 1E15 cm^-2, which is a reasonable upper limit as it may include some influence from true atmospheric variability (Wolfe et al., 2019)
The uncertainty estimates per grid cell are included with this dataset.
Data Acquisition, Materials, and Methods
A brief synopsis of the methods for these data products is provided below. For more details on the methods of data processing and modeling please refer to Wolfe et al. (2019).
ATom Missions
Employing the NASA DC-8 aircraft instrumented with an extensive suite of in-situ measurements, ATom has executed four around-the-world circuits with frequent vertical profiling from near-surface (< 200 m) to upper troposphere (10 – 12 km). Observations from the first two missions (August 2016 and February 2017) were used in this study.
ATom Measurement Data
ATom one-second merge files and ATHOS files were obtained from the Oak Ridge National Laboratory Distributed Active Archive Center (ORNL DAAC) (https://doi.org/10.3334/ORNLDAAC/1581) (Wofsy et al., 2018). One-second observations were averaged to the native OH time base (30 seconds for ATom 1, 20 seconds for ATom 2) and converted from mixing ratios to number density. Rate coefficients were taken from 2015 JPL Handbook recommendations. All 1-sigma (68% confidence level) measurement and rate coefficient uncertainties are propagated through to column-integrated values. Measurement uncertainties are treated as random unless specifically stated otherwise in native data files. Rate constant uncertainties are treated as systematic.
ATom Profiles
ATom profiles were executed “en route” along the flight track (as opposed to spirals) and typically spanned 200 – 450 km of horizontal distance and variable altitude ranges (typical minima and maxima of < 1 km and > 6 km). For each profile, concentrations and reaction rates were averaged to an altitude grid of 0 - 10 km with 200-m spacing using GPS altitude above mean sea level as the vertical coordinate.
Profile Selection
Missing points in each gridded profile were filled with linear interpolation (for points within the min and max sampling altitude) and constant-value extrapolation (using the mean of the last two adjacent valid points) to the surface and/or 10 km. Following trapezoidal integration, columns were filtered for solar zenith angle < 80°, profile sampling altitude range at least 0.6 - 8 km, fraction of missing HCHO or OH observations < 30%, fraction of interpolated gridded OH < 40%, and fraction of extrapolated HCHO < 25%. These limits were determined by visual identification of outliers (Fig. 2 a-b Wolfe et al., 2019) and inspection of vertical profiles. Three additional profiles were removed due to intermittent cloud cover, which tends to decouple OH and HCHO. Two profiles over the central USA were also removed. A total of 139 profiles were selected.
Total Column OH Production
Total column OH production was calculated by summing column-integrated rates for O3 photolysis, HO2 + NO, HO2 + O3, and H2O2 photolysis. All rates were calculated directly from observations, and O(1D) was assumed to be in steady state for deriving hydroxyl production from O3 photolysis. A small linear correction (slope = 1.06, intercept = 8.6E-10 cm^-2 s^-1) was also applied to account for OH sources beyond the listed reactions. The slope for this correction was based on simulated rates from a 0-D box model, while the offset was chosen to force the intercept of a plot of OH production rates (p_oh) vs oh to pass through zero. An additional systematic error of 6% was added to the OH production rate error (p_oh_err) for this correction.
HCHO loss frequency and photolysis frequency (k_hcho and j_hcho) were calculated by integrated HCHO loss rates and dividing by profile-integrated HCHO (Wolfe et al., 2019)
OMI Observations
Global HCHO columns were taken from NASA’s operational OMI product provided by the Smithsonian Astrophysical Observatory (OMI-SAO v003), available at https://mirador.gsfc.nasa.gov/. Level 2 daily vertical column densities are screened for cloud fraction < 0.3, solar zenith angle < 70 deg, and a main data quality flag of 0 before averaging to a spatial resolution of 0.5 deg x 0.5 deg. Fitting uncertainties for each grid were calculated using the individual uncertainties for each pixel using a weighted average (see manuscript for formula) where N is the total number of valid pixels contributing to that average. Daily gridded columns were averaged over each campaign (29 July – 23 August 2016 for ATom 1, 26 January – 21 February 2017 for ATom 2) using a fitting error-weighted mean.
For each ATom profile, OMI retrievals for the relevant mission were sampled and averaged over all grid cells intersected by the flight path. OMI columns were scaled using ATom-derived air mass factors and corrected for the fraction of total-column HCHO residing below 10 km as determined by retrieval a priori profiles. See Wolfe et al. (2019) for additional information on air mass factors.
OMI HCHO was derived from L2 retrievals. Averaged column densities were linearly interpolated from 0.5 x 0.5 to 0.5 x 0.625-resolution.
Global Modeling Initiative (GMI) Simulations
Model products were taken from a Global Modeling Initiative (GMI) simulation including GMI column-average formaldehyde photolysis frequency, GMI output average tropopause height, the scaling factor to convert 1300LT to 24-hour average OH, and GMI output column air mass.
Column-average formaldehyde total loss frequency was derived from GMI column-average formaldehyde photolysis frequency using ATom scaling factors and is provided for convenience.
The 24-hour tropospheric column mean OH concentration (x_oh) was calculated from ATom scaling factors, OMI HCHO, column-average formaldehyde photolysis frequency, average tropopause height, and GMI scaling factors using a linear transformation. The data and related quantities are only valid for non-land grid cells (Wolfe et al., 2019).
The variables tp_height and scale_diel_oh were used to convert OH vertical column density at the OMI overpass time (1330LT, but model output is hourly so we round to 1300LT) to 24-hour tropospheric mean concentration (xoh) and are provided for convenience. xoh_err includes propagated uncertainties from HCHO columns, jhcho_gmi, and ATom scaling factors.
Averaging of xoh should include weighting by tropospheric mass:
xoh_avg = sum(xoh * air_mass) / sum(air_mass).
Random and systematic uncertainties in x_oh must be treated separately when averaging.
(N = total number of valid points in average)
random error = sqrt(sum(xoh_err_rand^2)) / Nsystematic error
Nsystematic error = sqrt(sum(xoh_err_syst^2)) / sqrt(N)
total error = sqrt(random^2 + systematic^2)
In some instances it may also be appropriate to include air mass weighting in the above formula.
Data Access
These data are available through the Oak Ridge National Laboratory (ORNL) Distributed Active Archive Center (DAAC).
ATom: Column-Integrated Densities of Hydroxyl and Formaldehyde in Remote Troposphere
Contact for Data Center Access Information:
- E-mail: uso@daac.ornl.gov
- Telephone: +1 (865) 241-3952
References
Wolfe, G.M., J.M. Nicely, J.M. St. Clair, T.F. Hanisco, J. Liao, L.D. Oman, W.B. Brune, D. Miller, A. Thames, G.G. Abad, T.B. Ryerson, C.R. Thompson, J. Peischl, K. McCain, C. Sweeney, P.O. Wennberg, M. Kim, J.D. Crounse, S.R. Hall, K. Ullmann, G. Diskin, P. Bui, C. Chang, and J.Dean-Day. 2019. Mapping Hydroxyl Variability Throughout the Global Remote Troposphere via Synthesis of Airborne and Satellite Formaldehyde Observations. PNAS, submitted.
Wofsy et al. 2018. ATom: Merged Atmospheric Chemistry, Trace Gases, and Aerosols. ORNL DAAC, Oak Ridge, Tennessee, USA. https://doi.org/10.3334/ORNLDAAC/1581