Documentation Revision Date: 2020-04-15
Dataset Version: 1
Summary
The N2O, CH4, CO, CO2 and continuous H2O measurements were compiled from the following project campaigns; HIAPER Pole-to-Pole Observations (HIPPO, 2008– 2011), Southern Ocean (ORCAS, 2016) and Atmospheric Tomography (ATom, 2016–2018). O3 measurements were from HIPPO and ATom. Medusa air samples were used from all five HIPPO campaigns, ORCAS, and ATom campaigns 2–4. Samples were labeled as “stratospheric” if water vapor levels were below 50 ppm and either O3 values exceeded 140 ppb or N2O (detrended to a reference year of 2009) was below 315 ppb. These criteria identified lower stratospheric samples with high quality N2O and δ(Ar/N2) data.
There is one data file in comma-separated format (.csv) with this dataset.
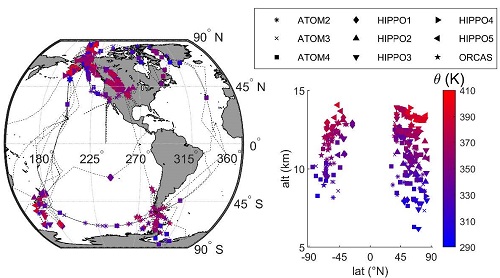
Figure 1. Horizontal (left) and vertical (right) distribution of airborne flask sample locations identified as being of stratospheric origin. Thin dashed black lines on the map illustrate the flight tracks of all 9 campaigns of the 3 airborne projects. Symbols indicate the campaigns during which the stratospheric samples were collected, and colors show the potential temperature at which the sample was taken. Source: Birner et al., 2020
Citation
Birner, B., M. Chipperfield, E.J. Morgan, and R.F. Keeling. 2020. ATom: Age of Air, ArN2 Ratio, and Trace Gases in Stratospheric Samples, 2009-2018. ORNL DAAC, Oak Ridge, Tennessee, USA. https://doi.org/10.3334/ORNLDAAC/1788
Table of Contents
- Dataset Overview
- Data Characteristics
- Application and Derivation
- Quality Assessment
- Data Acquisition, Materials, and Methods
- Data Access
- References
Dataset Overview
This dataset provides calculated age of air (AoA) and the argon/nitrogen (Ar/N2) ratio (per meg) from stratospheric flask samples and simultaneous high frequency measurements of nitrous oxide (N2O), carbon dioxide (CO2), ozone (O3), methane (CH4), and carbon monoxide (CO) compiled from three airborne projects. The trace gases were used to identify 235 flask samples with stratospheric influence collected by the Medusa Whole Air Sampler and to calculate AoA using a new N2O-AoA relationship developed using a Markov Chain Monte Carlo algorithm. The data span a wide range of latitudes poleward of 40 degrees in both the Northern and Southern Hemispheres and cover the period 2009-01-10 to 2018-05-21.
The N2O, CH4, CO, CO2 and continuous H2O measurements were compiled from the following project campaigns; HIAPER Pole-to-Pole Observations (HIPPO, 2008– 2011), Southern Ocean (ORCAS, 2016) and Atmospheric Tomography (ATom, 2016–2018). O3 measurements were from HIPPO and ATom. Medusa air samples were used from all five HIPPO campaigns, ORCAS, and ATom campaigns 2–4. Samples were labeled as “stratospheric” if water vapor levels were below 50 ppm and either O3 values exceeded 140 ppb or N2O (detrended to a reference year of 2009) was below 315 ppb. These criteria identified lower stratospheric samples with high quality N2O and δ(Ar/N2) data.
Project: Atmospheric Tomography Mission (ATom)
The Atmospheric Tomography Mission (ATom) was a NASA Earth Venture Suborbital-2 mission. It studied the impact of human-produced air pollution on greenhouse gases and on chemically reactive gases in the atmosphere. ATom deployed an extensive gas and aerosol payload on the NASA DC-8 aircraft for systematic, global-scale sampling of the atmosphere, profiling continuously from 0.2 to 12 km altitude. Flights occurred in each of 4 seasons over a 4-year period.
Related Publication:
Birner, B., Chipperfield, M. P., Morgan, E. J., Stephens, B. B., Linz, M., Feng, W., Wilson, C., Bent, J. D., Wofsy, S. C., Severinghaus, J., and Keeling, R. F. 2020. Gravitational separation of Ar/N2 and age of air in the lowermost stratosphere in airborne observations and a chemical transport model, Atmos. Chem. Phys. Discuss. https://doi.org/10.5194/acp-2020-95
Related Datasets:
ATom: L2 Measurements from Medusa Whole Air Sampler (Medusa). ORNL DAAC, Oak Ridge, Tennessee, USA. https://doi.org/10.3334/ORNLDAAC/1729
ATom: Merged Atmospheric Chemistry, Trace Gases, and Aerosols. Data from all ATom instruments and all four flight campaigns, including aircraft location and navigation data, merged to several different time bases: https://doi.org/10.3334/ORNLDAAC/1581
ATom Flight Track and Navigational Data. Flight path (location and altitude) data for each of the four campaigns provided in KML and csv format: https://doi.org/10.3334/ORNLDAAC/1613
HIAPER Pole-to-Pole Observations (HIPPO) of Carbon Cycle and Greenhouse Gases Study. Data available at: https://www.eol.ucar.edu/field_projects/hippo
The O2/N2 Ratio and CO2 Airborne Southern Ocean (ORCAS) project data available at: https://www.eol.ucar.edu/field_projects/orcas
Acknowledgement:
This study was funded under the ATom project, grant number NNX15AJ23G.
Data Characteristics
Spatial Coverage: Global
Spatial Resolution: Multiple points
Temporal Coverage: 2009-01-10 to 2018-05-21
Temporal Resolution: One-time estimates compiled from multiple campaigns (HIPPO, 2009-2011; ORCAS, 2016; ATom, 2016-2018)
Study Area: All latitude and longitude are given in decimal degrees.
| Site | Northernmost Latitude | Southernmost Latitude | Easternmost Longitude | Westernmost Longitude |
|---|---|---|---|---|
| Global | 84.53 | -84.51 | 178.68 | -179.58 |
Data file information
There is one data file with this dataset in comma-separated (.csv) format.
Table 1. Variables names and descriptions for ArN2_AirAge_Trace_Gases.csv.
| Variable | Units | Description |
|---|---|---|
| date | YYYY-MM-DD | Sample date (UTC) |
| time | HH:MM:SS | Sample time in HH:MM:SS (UTC) |
| decimal_year | YYYY.YYY | Date as decimal year (UTC) |
| latitude | Decimal degrees | Latitude in decimal degrees |
| longitude | Decimal degrees | Longitude in decimal degrees |
| pressure | hPa | Ambient pressure |
| altitude | m | Altitude |
| theta | K | Potential temperature |
| AoA | year | Age of Air: The time elapsed since entry of an air parcel into the stratosphere |
| AoA_lowerBound | year | Age of Air, lower bound: 95% confidence interval |
| AoA_upperBound | year | Age of Air, upper bound: 95% confidence interval |
| CO2 | ppm | Carbon Dioxide measurements compiled from the HIPPO, ORCAS and ATom project campaigns |
| ArN2 | per meg | Argon to Nitrogen ratio (Ar/N2) |
| N20 | ppb | Nitrous Oxide measurements compiled from the HIPPO, ORCAS and ATom project campaigns |
| CO | ppb | Carbon Monoxide measurements compiled from the HIPPO, ORCAS and ATom project campaigns |
| O3 | ppb | Ozone measurements from HIPPO and ATom |
| H2O | >ppm | Water measurements compiled from the HIPPO, ORCAS and ATom project campaigns |
| CH4 | ppb | Methane measurements compiled from the HIPPO, ORCAS and ATom project campaigns |
Application and Derivation
Transport in the middle atmosphere is driven by a combination of advection by the Brewer-Dobson circulation (BDC) and quasi-horizontal, two-way mixing by breaking waves. Models consistently predict an acceleration of the BDC due to climate change (Butchart, 2014) but subgrid-scale mixing processes and momentum transfer by unresolved buoyancy waves limit the ability to accurately simulate circulation in the stratosphere. An acceleration of the BDC has important repercussions for stratosphere-troposphere exchange (STE), and thus recovery of the ozone layer and the greenhouse effect of stratospheric water vapor.
Stratospheric air is detectably fractionated by gravitational settling (GS), with the degree of fractionation strongly correlated to AoA. 2-D and 3-D models both show a pattern of GS which increases with altitude and latitude, similar to the patterns observed in tracers with a significant stratospheric sink such as N2O, and consistent with a positive correlation with AoA. This study investigated the calibration of GS of Ar/N2 as an AoA tracer. The data were used to calculate the mean age of air, a widely used indicator of stratospheric circulation (Birner et al., 2020).
Quality Assessment
Quality assessment procedures related to the measurement and analysis of the trace gases differ by instruments used in the projects.
Data Acquisition, Materials, and Methods
Following is a brief synopsis of the sampling, analyses, and data compilation and processing as described in Birner et al., 2020.
Discrete 1.5L flask samples were taken with the Medusa Whole Air Sampler and shipped to Scripps Institution of Oceanography (SIO) for analysis of Ar/N2 ratios on an IsoPrime Mass Spectrometer. Changes in Ar/N2 ratios are in delta notation
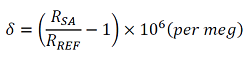
where RSA is the mixing or isotope ratio in the sample and RREF the ratio in a reference mixture.
Available simultaneous, high-frequency, measurements were compiled for a range of other trace gases including N2O, CO2, O3, CH4, and CO. These were used to identify Medusa samples with stratospheric influence and to calculate AoA. The N2O, CH4, CO, CO2, and continuous H2O measurements were from the HIPPO, ORCAS, and ATom project campaigns. O3 measurements were from HIPPO and ATom. Air samples were used from all five HIPPO campaigns, ORCAS, and ATom campaigns 2–4. Samples from ATom 1 were not used because of apparent biases. An averaging kernel was applied to the continuous and semi-continuous aircraft data, such as N2O, O3, and H2O, to match it to Medusa samples.
Composition, rather than potential temperature or altitude, effectively selects samples with a clear stratospheric signature in the lowermost stratosphere where mixing with the upper troposphere could be substantial and minimizes the impact of synoptic scale variability. Samples were labeled as “stratospheric” if (i) water vapor levels were below 50 ppm and either (ii.a) O3 values exceeded 140 ppb or (ii.b) N2O (detrended to a reference year of 2009) was below 315 ppb. These criteria yielded 235 lower stratospheric samples with high-quality N2O and δ(Ar/N2) data, spanning a wide range of latitudes poleward of 40° in both the Northern and Southern Hemisphere (Figure 1) (Birner et al., 2020).
AoA calculation
Stratospheric AoA was calculated from N2O using an updated hemisphere-specific N2O-AoA relationship. The method broadly follows Andrews et al. (2001) who assumed a bimodal age spectrum and use multiple observations of CO2 binned by N2O values to resolve the seasonal cycle of CO2. Properties of the age spectrum for each N2O bin, including AoA were constrained by optimizing the agreement between observed CO2 concentrations and concentration implied by randomly generated age spectra in each N2O bin. A Markov chain Monte Carlo (MCMC) method was used to obtain robust uncertainties for all estimated parameters of the age spectrum. The algorithm builds on a Metropolis-Hasting sampler (Metropolis et al., 1953; Hastings, 1970) as implemented by Malinverno (2002) to evaluate probability distributions for each age spectrum parameter and automatically chooses whether a unimodal or bimodal representation of the age spectrum is more appropriate in each N2O bin (Birner et al., 2020). The new AoA-N2O relationships for each hemisphere are given by NH AoA = -0.0002361 (323.23 - N2O)2 + 0.05530 (323.23 - N2O), and SH AoA = -0.0001754 (323.23 - N2O)2 + 0.05359 (323.23 - N2O) (Birner et al., 2020).
Data Access
These data are available through the Oak Ridge National Laboratory (ORNL) Distributed Active Archive Center (DAAC).
ATom: Age of Air, ArN2 Ratio, and Trace Gases in Stratospheric Samples, 2009-2018
Contact for Data Center Access Information:
- E-mail: uso@daac.ornl.gov
- Telephone: +1 (865) 241-3952
References
Andrews, A.E., K.A. Boering, S.C., Wofsy, B.C. Daube, D.B. Jones, S. Alex, M. Loewenstein, J.R. Podolske, and S.E.Strahan. 2001. Empirical age spectra for the midlatitude lower stratosphere from in situ observations of CO2: Quantitative evidence for a subtropical “barrier” to horizontal transport, Journal of Geophysical Research Atmospheres, 106(D10), 10257– 10274. http://doi.org/10.1029/2000JD900703
Birner, B., Chipperfield, M. P., Morgan, E. J., Stephens, B. B., Linz, M., Feng, W., Wilson, C., Bent, J. D., Wofsy, S. C., Severinghaus, J., and Keeling, R. F.. 2020. Gravitational separation of Ar/N2 and age of air in the lowermost stratosphere in airborne observations and a chemical transport model, Atmos. Chem. Phys. Discuss. https://doi.org/10.5194/acp-2020-95
Butchart, N. 2014. The Brewer-Dobson circulation, Reviews of Geophysics, 52, 157-184. https://doi.org/10.1002/2013RG000448
Hastings, W.K. 1970. Monte carlo sampling methods using Markov chains and their applications, Biometrika, 57(1), 97–109, 530. https://doi.org/10.1093/biomet/57.1.97
Malinverno, A. 2002. Parsimonious Bayesian Markov chain Monte Carlo inversion in a nonlinear geophysical problem, Geophysics Journal International, 151, 675–688. https://doi.org/10.1046/j.1365-246X.2002.01847.x
Metropolis, N., A.W. Rosenbluth, M.N. Rosenbluth, and A.H. Teller. 1953. Equation of state calculations by fast computing machines. The Journal of Chemical Physics, 21(6), 1087–1092. https://doi.org/10.1063/1.1699114