Documentation Revision Date: 2024-09-12
Dataset Version: 1
Summary
This dataset includes two data files in NetCDF (*.nc) format.
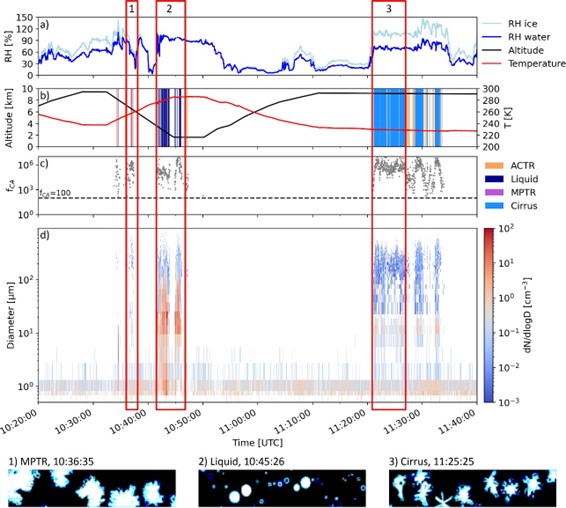
Figure 1. Time series of a) relative humidity over ice and water, b) altitude, temperature, and Cloud Indicator classification, c) cloud-aerosol volume factor (fCA), and d) particle size distribution in the size range 0.6 to 25 um (CAS data) and 25 to 930 um (CIP data) for the ATom-1 flight on August 20, 2016. For the three red-marked boxes, CIP shadow images of the detected particles are shown. Figure from Dollner et al. (2024).
Citation
Dollner, M., J. Gasteiger, M. Schoeberl, A. Gattringer, N.D. Beres, T.P. Bui, G.S. Diskin, and B.B. Weinzierl. 2023. ATom: Development of Cloud Indicator Algorithm Using Airborne Observations from CAPS. ORNL DAAC, Oak Ridge, Tennessee, USA. https://doi.org/10.3334/ORNLDAAC/2250
Table of Contents
- Dataset Overview
- Data Characteristics
- Application and Derivation
- Quality Assessment
- Data Acquisition, Materials, and Methods
- Data Access
- References
Dataset Overview
This dataset is the basis for the development of the Cloud Indicator, a novel algorithm that automatically detects and classifies measurement periods inside clouds. The included data were used in the analysis and development of figures for Dollner et al. (2024). The Cloud Indicator algorithm was developed based on particle size distribution measurements from a second-generation Cloud, Aerosol, and Precipitation Spectrometer (CAPS) combined with measurements of relative humidity and temperature from other sensors, to automatically detect flight sequences in clouds and classify the cloud type. Measurements were collected on 2016-08-20 as part of the Atmospheric Tomography Mission (ATom-1) Campaign and on 2017-04-20 as part of the Absorbing aerosol layers in a changing climate: aging, LIFEtime and dynamics (A-LIFE) project. As an additional criterion for the Cloud Indicator, a cloud-aerosol volume factor was established to ensure a precise and robust distinction between clouds and aerosol layers such as mineral dust or biomass burning to reduce misclassifications.
Project: Atmospheric Tomography Mission (ATom)
The Atmospheric Tomography Mission (ATom) was a NASA Earth Venture Suborbital-2 mission. It studied the impact of human-produced air pollution on greenhouse gases and on chemically reactive gases in the atmosphere. ATom deployed an extensive gas and aerosol payload on the NASA DC-8 aircraft for systematic, global-scale sampling of the atmosphere, profiling continuously from 0.2 to 12 km altitude. Flights occurred in each of four seasons over a 4-year period.
Related Data:
ATom: Merged Atmospheric Chemistry, Trace Gases, and Aerosols. Data from all ATom instruments and all four flight campaigns, including aircraft location and navigation data, merged to several different time bases: https://doi.org/10.3334/ORNLDAAC/1925
ATom Flight Track and Navigational Data. Flight path (location and altitude) data for each of the four campaigns provided in KML and csv format: https://doi.org/10.3334/ORNLDAAC/1613
Weinzierl, B.B., and M. Dollner. 2021. ATom: Cloud and Coarse Aerosol Measurements from CAPS Instrument, 2016-2018. ORNL DAAC, Oak Ridge, Tennessee, USA. https://doi.org/10.3334/ORNLDAAC/1981
Related Publication:
Dollner, M., J. Gasteiger, M. Schöberl, A. Gattringer, N.D. Beres, T.P. Bui, G. Diskin, and B. Weinzierl. 2024. The Cloud Indicator: A novel algorithm for automatic detection and classification of clouds using airborne in situ observations, Atmospheric Research, 107504, https://doi.org/10.1016/j.atmosres.2024.107504
Data Characteristics
Spatial Coverage: Global; flights circumnavigate the globe, primarily over the oceans
Spatial Resolution: Point measurements
Temporal Coverage: Individual flights on two occasions: 2016-08-20 (ATom-1) and 2017-04-20 (A-LIFE)
Temporal Resolution: 1 second
Data File Information
This dataset includes two data files in netCDF (*.nc) format that contain data collected by the Cloud, Aerosol, and Precipitation Spectrometer (CAPS):
- dataset_Figure_5_6.nc
- Contains data used to create Figures 5 and 6 in Dollner et al (2024). Data were collected on 2016-08-20 during the ATom-1 Campaign. A complete record of data from the CAPS instrument collected during the ATom project can be found in Weinzierl and Dollner (2021).
- dataset_Figure_7_8_9.nc
- Contains data used to create Figures 7, 8, and 9 in Dollner et al (2024). Data were collected on 2017-04-20 as part of the Absorbing aerosol layers in a changing climate: aging, LIFEtime and dynamics (A-LIFE) project.
Table 1. Data dictionary for netCDF files.
| Variable | Units | Description |
|---|---|---|
| CA_Factor | 1 | cloud-aerosol volume factor: Ratio between volume concentrations of the size ranges dominated by aerosol and cloud particles. |
| Altitude | km | Altitude |
| Amb_Temperature | K | Ambient temperature |
| CAS_dndlogDp_1_33 | particles cm-3 | Particle size distribution dndlog10Dp measured with the Cloud and Aerosol Spectrometer (CAS) calculated at a refractive index of 1.33 |
| CAS_Dp_1_33 | μm | Mean particle size corresponding to the CAS_dndlogDp_1_33 particle size distribution in microns |
| CIP_dndlogDp | particles cm-3 | Particle size distribution dndlog10Dp measured with the Cloud Imaging Probe (CIP) |
| CIP_mean_Dp | μm | Mean particle size corresponding to the CIP_dndlogDp particle size distribution in microns |
| Cloudindicator | - | 0 = cloud-free, 1 = aerosol-cloud transition regime (ACTR), 2 = liquid cloud, 3 = cloud in the mixed-phase temperature regime, 4 = cirrus cloud. To mask data inside clouds, use cloudindicator values from 2 to 4. |
| RHi | percent | Relative humidity over ice |
| RHw | percent | Relative humidity over water |
| time | n | Time in nanoseconds since epoch. |
| N5* | particles cm-3 | Particle number concentration of all particles with diameters greater than 5µm measured by the CAPS instrument. |
* This variable is only in the file dataset_Figure_7_8_9.nc
Application and Derivation
ATom builds the scientific foundation for mitigation of short-lived climate forcers, in particular methane (CH4), tropospheric ozone (O3), and Black Carbon aerosols (BC).
ATom Science Questions
Tier 1
- What are chemical processes that control the short-lived climate forcing agents CH4, O3, and BC in the atmosphere? How is the chemical reactivity of the atmosphere on a global scale affected by anthropogenic emissions? How can we improve chemistry-climate modeling of these processes?
Tier 2
- Over large, remote regions, what are the distributions of BC and other aerosols important as short-lived climate forcers? What are the sources of new particles? How rapidly do aerosols grow to CCN-active sizes? How well are these processes represented in models?
- What type of variability and spatial gradients occur over remote ocean regions for greenhouse gases (GHGs) and ozone depleting substances (ODSs)? How do the variations among air parcels help identify anthropogenic influences on photochemical reactivity, validate satellite data for these gases, and refine knowledge of sources and sinks?
Significance
ATom delivers unique data and analysis to address the Science Mission Directorate objectives of acquiring “datasets that identify and characterize important phenomena in the changing Earth system” and “measurements that address weaknesses in current Earth system models leading to improvement in modeling capabilities.” ATom will provide unprecedented challenges to the CCMs used as policy tools for climate change assessments, with comprehensive data on atmospheric chemical reactivity at global scales, and will work closely with modeling teams to translate ATom data to better, more reliable CCMs. ATom provides extraordinary validation data for remote sensing.
Quality Assessment
Quality assessment procedures differ by instrument and sensor used for this dataset. For the CAPS instrument the calibration procedure and data treatment are described in Dollner et al. (2024).
Data Acquisition, Materials, and Methods
The following is a short summary of the method used to derive these data, for additional details please see Dollner et al. (2024).
CAPS Instrument
The Cloud Indicator algorithm utilizes in situ measurements of particle size distributions, relative humidity, and temperature to detect and classify clouds and is designed to minimize misclassifications of periods with enhanced coarse-mode aerosol concentrations (e.g., mineral dust layers or biomass burning smoke plumes) as clouds. For the algorithm development, the University of Vienna second-generation Cloud, Aerosol, and Precipitation Spectrometer (referred to as CAPS or UNIVIE-CAPS) was used for the particle size distribution measurements between nominally 0.5 and 930 µm.
The second-generation Cloud, Aerosol, and Precipitation Spectrometer (CAPS, Droplet Measurement Technologies, Longmont, CO, USA) consists of two main instruments: the Cloud and Aerosol Spectrometer (CAS) and the Cloud Image Probe (CIP) (Baumgardner et al., 2001). The CAPS is equipped with additional sensors for true airspeed, pressure, relative humidity, temperature, and liquid water content (LWC).
The CAPS instrument provides two types of data outputs. The first type is a standard time-series product available for the CAS, CIP, and LWC measurements, commonly reported with a 1-second resolution. The second output type is single-particle data for measurements from the CAS and CIP. The standard time-series for the CAS provides relevant housekeeping data (e.g., laser reference voltage and laser temperature), pre-calculated quantities like volume and number concentrations, and binned size distribution data (i.e., counts of measured particles sorted into pre-set size channels). The lower and upper limits of the size channels (for which the factory settings correspond to optical equivalent diameters of water with a refractive index of m = 1.33+0.00i) are defined in a configuration file. The structure of the CIP standard time-series product is mostly similar to that of the CAS product. It also contains relevant housekeeping data (e.g., laser reference voltage, laser temperature, and dark current of the diodes), pre-calculated quantities like volume and number concentrations, and binned size distribution data. In contrast to the binned data from CAS where the size channels are defined in a configuration file, the CIP size bins are fixed and determined by the resolution and number of diodes on the diode array. The 64 diodes of the CIP of the UNIVIE-CAPS have a resolution of 15 µm, but because measurements of particles triggering the lower and upper edge diodes are rejected, a total of 62 bins are utilized, covering the size range between 15 and 930 µm.
Campaigns
The Atmospheric Tomography Mission (ATom) was a NASA Earth Venture Suborbital-2 mission. It studied the impact of human-produced air pollution on greenhouse gases and on chemically reactive gases in the atmosphere. ATom deployed an extensive gas and aerosol payload on the NASA DC-8 aircraft for systematic, global-scale sampling of the atmosphere, profiling continuously from 0.2 to 12 km altitude. Flights occurred in each of four seasons over a 4-year period.
The European Research Council (ERC)-funded “Absorbing aerosol layers in a changing climate: aging, lifetime and dynamics (A-LIFE)” project aimed to study the properties of mixtures of absorbing aerosols in the Eastern Mediterranean (Weinzierl et al., in prep.). During the 74 h of airborne sampling, multiple dust outbreaks from the Saharan and Arabian deserts, pollution layers, mixtures of polluted dust layers, and clouds were measured by in situ and remote sensing techniques. A-LIFE deployed the German Aerospace Center (DLR) Falcon 20 E-5 aircraft to the Eastern Mediterranean Sea with the UNIVIE-CAPS as part of an extensive aerosol and cloud payload on 2017-04-03 to 2017-04-30. Additional measurements of GPS position and meteorological parameters (i.e., temperature, true airspeed, and pressure) were collected with the meteorological measurement system of the DLR Falcon (CMET).
Cloud Indicator algorithm
The process of selecting and classifying cloud sequences in airborne in situ observations can be very time- consuming if done manually. Simple detection algorithms, with criteria like thresholds for particle number concentration in selected size ranges, are prone to misclassification, particularly when coarse aerosol particles (> 1 µm) are present. The motivation for the Cloud Indicator algorithm is to provide a robust algorithm that automatically detects and classifies clouds with a low number of misclassifications because several airborne in situ measurements are subject to artifacts during measurements inside clouds which commonly get flagged or erased in the post-flight data processing. Furthermore, the algorithm needed to provide cloud information (and, in particular, a cloud mask) promptly after a measurement flight, which means that the algorithm was optimized for short processing times. This prompt application requirement of the Cloud Indicator limits the input data to parameters that are processed fast and excludes parameters with extensive processing (e.g., image analysis).
For the development of the Cloud Indicator algorithm, the used parameters were restricted to size distribution measurements from UNIVIE-CAPS, combined with measurements of temperature and relative humidity over water (RHw) and ice (RHi). While this algorithm utilizes the UNIVIE-CAPS size distribution, it can be used with any size distribution measurements of aerosol and cloud particles covering the size range from approximately 0.5 to at least 50 µm. Other potential light-scattering spectrometers covering the required size range, either standalone or in combination, are: the Cloud Droplet Probe (CDP), the Backscatter Cloud Probe (BCP), and the Cloud Particle Spectrometer with Polarized Detection (CPSPD) from Droplet Measurement Technologies (Longmont, USA), the Fast Forward Scattering Spectrometer Probe (FFSSP), Fast Cloud Droplet Probe (FCDP) from SPEC (Boulder, USA) and the Small Ice Detector (SID-2/3) from the University of Hertfordshire (Baumgardner et al., 2017). Additional imaging probes that operate partly in the desired size range but are generally missing the particles below 2 µm are the Cloud Particle Imager (CPI) and the two-Dimensional Stereo (2D-S) probe from SPEC, the PHIPS-HALO from Karlsruhe Institute of Technology (KIT) and the Particle-i Imaging System (PI) from Artium (Sunnyvale, USA). It should be noted that an upper size limit of 50 µm is sufficient to apply this algorithm; however, a larger upper limit extending further into the size range of cloud particles reduces the probability of misclassifications due to undetected cloud particles.
The Cloud Indicator distinguishes whether measurements were taken inside a cloud, in an Aerosol-Cloud Transition Regime (ACTR), or a cloud-free sequence. For clouds, the algorithm further distinguishes between cirrus, Mixed-Phase Temperature Regime (MPTR), and liquid clouds. The parameters of the Cloud Indicator algorithm have been selected to represent basic properties of clouds (e.g., cloud particle number concentration, relative humidity, and temperature) and to distinguish a cloud from an aerosol layer with enhanced concentrations of coarse-mode particles (e.g., mineral dust, sea salt, or biomass burning aerosol). The criteria were tuned empirically by comparing in-field observations (e.g., flight reports, videos, and pictures from the flights) with measured parameters. Below are the criteria used in the Cloud Indicator algorithm.
- Criterion 1 uses temperature and relative humidity to assign cloud type (liquid, MPTR, or cirrus).
- Criterion 2 uses particle number concentration thresholds (criterion 2) are based on particle numbers at three size classes: 5 µm, 14 µm, and 25 µm.
- Criterion 3 is based on a cloud- aerosol volume factor (fCA). fCA is a ratio between volume concentrations of the size ranges dominated by aerosol and cloud particles.
One additional purpose of the Cloud Indicator algorithm is to provide a data product ("cloudflag”) for screening measurement periods inside clouds. To conservatively avoid the classification of a cloudy sequence as cloud-free in the “cloudflag” product, measurement periods between two detected clouds with a length of 10 s or less are also flagged.
Data Access
These data are available through the Oak Ridge National Laboratory (ORNL) Distributed Active Archive Center (DAAC).
ATom: Development of Cloud Indicator Algorithm Using Airborne Observations from CAPS
Contact for Data Center Access Information:
- E-mail: uso@daac.ornl.gov
- Telephone: +1 (865) 241-3952
References
Baumgardner, D., S. J. Abel, D. Axisa, R. Cotton, J. Crosier, P. Field, C. Gurganus, A. Heymsfield, A. Korolev, M. Krämer, P. Lawson, G. McFarquhar, Z. Ulanowski, and J. Um. 2017. Cloud ice properties: in situ measurement challenges. Meteorological Monographs 58:9.1-9.23. https://doi.org/10.1175/amsmonographs-d-16-0011.1
Dollner, M., J. Gasteiger, M. Schöberl, A. Gattringer, N.D. Beres, T.P. Bui, G. Diskin, and B. Weinzierl. 2024. The Cloud Indicator: A novel algorithm for automatic detection and classification of clouds using airborne in situ observations, Atmospheric Research, 107504, https://doi.org/10.1016/j.atmosres.2024.107504
Weinzierl, B.B., and M. Dollner. 2021. ATom: Cloud and Coarse Aerosol Measurements from CAPS Instrument, 2016-2018. ORNL DAAC, Oak Ridge, Tennessee, USA. https://doi.org/10.3334/ORNLDAAC/1981
Weinzierl, B., et al., 2024. in prep. The A-LIFE field experiment in the Eastern Mediterranean: highlights from the airborne observations and insights into properties of absorbing aerosol mixtures.