Documentation Revision Date: 2018-06-28
Data Set Version: 1
Summary
This dataset includes 11 files in comma-delimited text (*.csv) format and 11 files in NetCDF (*.nc) format.
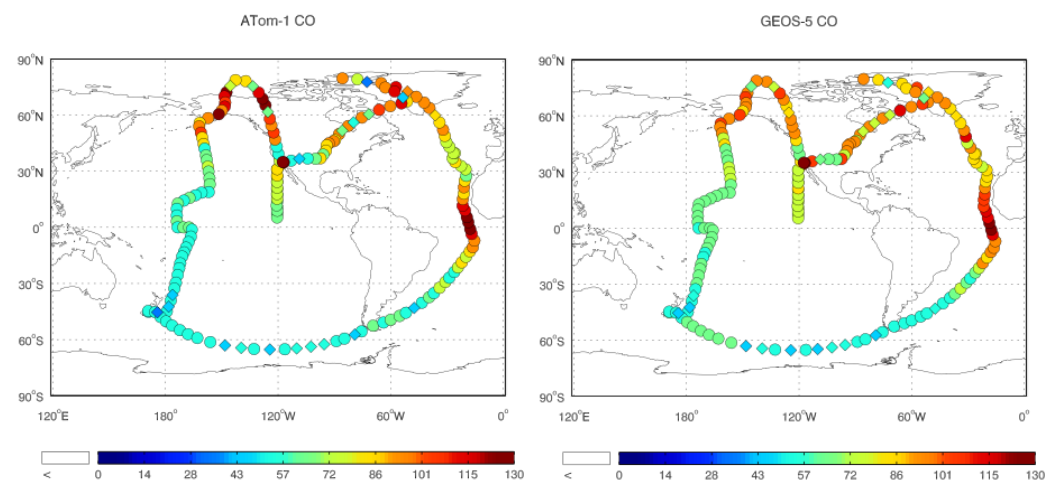
Figure 1. CO (ppb) from the QCLS observations (left) and GEOS-5 analysis (right) for the ATom-1 circuit including all 11 research flight segments. The GEOS-5 CO is taken from the analysis closest to the mid-point of the flight time and interpolated to the flight track following the longitude, latitude and pressure given in 10-second merged observations. For visualization in this figure, both model forecast and ATom measurements are averaged into a sample rate of one per 360-second. Data in the troposphere are plotted in a circle; data in the stratosphere are plotted in a diamond (from Strode et al. 2018).
Citation
Strode, S.A., J. Liu, L. Lait, R. Commane, B.C. Daube, S.C. Wofsy, A. Conaty, P. Newman, and M.J. Prather. 2018. ATom: Observed and GEOS-5 Simulated CO Concentrations with Tagged Tracers for ATom-1. ORNL DAAC, Oak Ridge, Tennessee, USA. https://doi.org/10.3334/ORNLDAAC/1604
Table of Contents
- Data Set Overview
- Data Characteristics
- Application and Derivation
- Quality Assessment
- Data Acquisition, Materials, and Methods
- Data Access
- References
Data Set Overview
Project: Atmospheric Tomography Mission (ATom)
The Atmospheric Tomography Mission (ATom) is a NASA Earth Venture Suborbital-2 mission. It will study the impact of human-produced air pollution on greenhouse gases and on chemically reactive gases in the atmosphere. ATom deploys an extensive gas and aerosol payload on the NASA DC-8 aircraft for systematic, global-scale sampling of the atmosphere, profiling continuously from 0.2 to 12 km altitude. Flights will occur in each of 4 seasons over a 4-year period.
Related Publication:
Strode, S. A., Liu, J., Lait, L., Commane, R., Daube, B., Wofsy, S., Conaty, A., Newman, P., and Prather, M. Forecasting Carbon Monoxide on a Global Scale for the ATom-1 Aircraft Mission: Insights from Airborne and Satellite Observations and Modeling. Atmos. Chem. Phys. Discuss. https://doi.org/10.5194/acp-2018-150, in review, 2018.
Related Data Set:
Wofsy, S.C., E. Apel, D.R. Blake, C.A. Brock, W.H. Brune, T.P. Bui, B.C. Daube, J.E. Dibb, G.S. Diskin, J.W. Elkiins, K. Froyd, S.R. Hall, T.F. Hanisco, L.G. Huey, J.L. Jimenez, K. McKain, S.A. Montzka, T.B. Ryerson, J.P. Schwarz, B.B. Stephens, B. Weinzierl, and P. Wennberg. 2018. ATom: Merged Atmospheric Chemistry, Trace Gases, and Aerosols. ORNL DAAC, Oak Ridge, Tennessee, USA. https://doi.org/10.3334/ORNLDAAC/1581
Acknowledgement: This work was supported by NASA (Grant Number NNH16ZDA001N-MAP).
Data Characteristics
Spatial Coverage: ATom-1 flights over the Atlantic and Pacific Oceans
Spatial Resolution: Point measurements along ATom1 flight paths
Temporal Coverage: 2016-07-29 - 2016-08-23
Temporal Resolution: 10-seconds
Study Area (These coordinates are the approximate locations of the study sites and may not match the extent of the data files. All latitude and longitude are given in decimal degrees.)
| Site | Northern Extent | Southern Extent | Western Extent | Eastern Extent |
|---|---|---|---|---|
| ATom 1 flights | 80.0086 | -65.3316 | 179.983 | -179.999 |
Data File Information
There are a total of 22 files in this dataset: one comma-delimited text file (*.csv) and one geo-trajectory NetCDF (*.nc) per flight for 11 ATom flights during July and August 2016. Each pair of files contains carbon monoxide (CO) concentrations measured by the QCLS instrument during one ATom flight as well as a simulated CO concentration from the Goddard Earth Observing System version 5 (GEOS-5) forward processing system and accompanying tracers from biomass burning and non-burning sources by region.
The files are named as follows:
GEOS_and_QCLS_CO_ATom1_<YYYYMMDD>.<ext>
where <YYYYMMDD> indicates the date of the ATom flight and the file extensions is either *.csv or *.nc
Example filename: GEOS_and_QCLS_CO_ATom1_20160729.nc
Data Dictionary
Missing values are coded as -99999. There are regular occurrences of missing values in the QCLS instrument measurement data due to calibration procedures as noted in Section 5.
Table 1. Names, units, and descriptions for variables included in the files. Variable names vary slightly between formats.
| Variable Name (NetCDF) | Variable Name (CSV) | Units | Description |
|---|---|---|---|
| time | time | s | seconds since flight datetime UTC (YYYY-MM-DD 00:00:00.0) |
| time_bnds | * | s | time bounds for sample measurement (10-second window) |
| latitude | Lat | decimal degrees | latitude |
| longitude | Lon | decimal degrees | longitude |
| pressure | Pressure | hectopascals | air pressure -- Pressure was used as the vertical coordinate instead of altitude since pressure was used to identify the vertical level of the model that corresponded to the observation point on flight track. |
| CO_QCLS | QCLS_CO | ppb | CO mixing ratio from the QCLS instrument in ppb. The data are reported on the NOAA/WMO CO_X2014A calibration scale using standards CB10182 and CB11484. |
| CO_GEOS | GEOS_CO | ppb | simulated CO mixing ratio from the GEOS forward processing system in ppb |
| CO_biomass_burning_africa | CO_bbAfrica | ppb | GEOS tracer for CO from African biomass burning in ppb |
| CO_biomass_burning_eurasia | CO_bbEuras | ppb | GEOS tracer for CO from Eurasian biomass burning in ppb |
| CO_biomass_burning_global | CO_bbGlobal | ppb | GEOS tracer for CO from Global biomass burning in ppb |
| CO_biomass_burning_na | CO_bbNAm | ppb | GEOS tracer for CO from North American biomass burning in ppb |
| CO_biomass_burning_sa | CO_bbSAm | ppb | GEOS tracer for CO from South American biomass burning in ppb |
| CO_nonburning_sources_asia | CO_nbAsia | ppb | GEOS tracer for CO from Asian non-burning sources |
| CO_nonburning_sources_europe | CO_nbEuro | ppb | GEOS tracer for CO from European non-burning sources |
| CO_nonburning_sources_global | CO_nbGlobal | ppb | GEOS tracer for CO from Global non-burning sources |
| CO_nonburning_sources_na | CO_nbNam | ppb | GEOS tracer for CO from North American non-burning sources |
Notes:
- time_bnds variable is included only in the NetCDF files.
- Non-burning sources include fossil fuels, biofuels, biogenic emissions, and methane oxidation.
- The relationship between (pressure) altitude and the horizontal coordinates of the ATom data is not unique to this dataset. Data points correspond to those in the ATom 10-second merged product. See related dataset.
- GEOS tracers: CO source contributions are the calculated contribution of different CO sources to the total simulated CO using the GEOS-5 tagged CO tracers sampled along the ATom flight tracks. This analysis provides a picture of the dominant sources affecting the constituent concentrations observed during ATom-1 for different regions of the atmosphere.
Application and Derivation
These data were used to assess the coherence of the simulated CO concentrations from GEOS-5 to CO concentrations observed during the ATom-1 flights. Tagged tracers were also used to find that non-biomass burning sources were the dominant contributors of CO along the ATom transects except over the tropical Atlantic, where African biomass burning makes a large contribution to the CO concentration.
Quality Assessment
No quality assessment or estimates of uncertainty are provided with this dataset.
Data Acquisition, Materials, and Methods
ATom-1 Flights
ATom-1 flew transects through the Pacific, Southern, Atlantic, and Arctic Oceans with the NASA DC-8 aircraft in July and August 2016. Each of the 11 flights included sampling from the boundary layer to the top of the aircraft range (around 39,000 ft; 12,000 m).
Quantum Cascade Laser System
The Harvard Quantum Cascade Laser System (QCLS) instrument package contains two separate optical assemblies and calibration systems, DUAL and CO2, and a common data system and power supply.
The Harvard QCL DUAL instrument simultaneously measures CO, CH4, and N2O concentrations in situ using two thermoelectrically cooled pulsed-quantum cascade lasers (QCL) light sources, a multiple pass absorption cell, and two liquid nitrogen-cooled solid state detectors. The sample gas is dried and measured for trace gas concentrations by measuring absoprtion from their infrared transition lines at 4.59 microns for CO and 7.87 microns for CH4 and N2O. In-flight calibrations are performed by replacing the air sample with reference gas every 10 minutes, with a low-span and a high-span gas every 20 minutes. The Harvard QCL CO2 instrument measures CO2 concentrations in situ using a similar apparatus.
This dataset includes CO measurements from the Harvard QCL DUAL instrument.
GEOS-5 Forward Processing System
Simulated CO concentrations were generated by the GEOS-5 Forward Processing (FP) system. The FP stream from the Global Modeling and Assimilation Office (GMAO) generates GEOS-5 forecast products as well as assimilation products using the most current system approved for near-real-time production. The GEOS-5 model (Molod et al. 2015) is a global general circulation model with 72 vertical levels reaching from the surface to 1 Pa.
The GEOS-5 FP system (Lucchesi, 2017) simulates the transport of CO as well as tagged CO tracers from specific regions and sources, which helps track the transport of pollution outflow. Tagged tracers are available for biomass burning (BB) globally as well as biomass burning from Eurasia, North America, Africa, and Central and South America; and for non-BB sources globally and from Europe, Asia, and North America. Non-BB sources include fossil fuels, biofuels, CO from oxidation of biogenic VOCs, and CO from methane oxidation, as described in Ott et al. (2010).
The GEOS-5 model is engaged during the ATom mission to provide chemical forecasts for each flight that include the major chemical species and, for CO, tagged tracers for different sources. The chemical forecasts are used together with meteorological forecast for day-to-day flight planning. This dataset was produced through an assessment of the performance of the GEO-5 forecasts by comparing the simulated CO to the QCLS observations. See Strode et al. (2018) for a full explanation of data sources and methods.
Data Access
These data are available through the Oak Ridge National Laboratory (ORNL) Distributed Active Archive Center (DAAC).
ATom: Observed and GEOS-5 Simulated CO Concentrations with Tagged Tracers for ATom-1
Contact for Data Center Access Information:
- E-mail: uso@daac.ornl.gov
- Telephone: +1 (865) 241-3952
References
Lucchesi, R, File Specification for GEOS-5 FP. GMAO Office Note No. 4 (Version 1.1), 61pp, 2017, available from http://gmao.gsfc.nasa.gov/pubs/office_notes.
Molod, A., Takacs, L., Suarez, M., and Bacmeister, J. 2015. Development of the GEOS-5 atmospheric general circulation model: evolution from MERRA to MERRA2. Geoscientific Model Development 8:1339-1356. https://dx.doi.org/10.5194/gmd-8-1339-2015
Ott, L., Duncan, B., Pawson, S., Colarco, P., Chin, M., Randles, C., Diehl, T., and Nielsen, E. 2010. Influence of the 2006 Indonesian biomass burning aerosols on tropical dynamics studied with the GEOS-5 AGCM, Journal of Geophysical Research-Atmospheres, 115, https://dx.doi.org/10.1029/2009jd013181.
Strode, S. A., Liu, J., Lait, L., Commane, R., Daube, B., Wofsy, S., Conaty, A., Newman, P., and Prather, M.: Forecasting Carbon Monoxide on a Global Scale for the ATom-1 Aircraft Mission: Insights from Airborne and Satellite Observations and Modeling. Atmos. Chem. Phys. Discuss. https://doi.org/10.5194/acp-2018-150, in review, 2018.