Documentation Revision Date: 2022-01-26
Dataset Version: 1
Summary
This dataset includes 96 data files in ICARTT (*.ict) format.
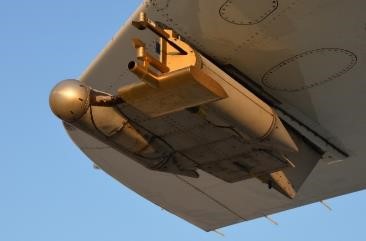
Figure 1. The CAPS instrument attached to the exterior of the NASA DC-8 aircraft.
Citation
Weinzierl, B.B., and M. Dollner. 2021. ATom: Cloud and Coarse Aerosol Measurements from CAPS Instrument, 2016-2018. ORNL DAAC, Oak Ridge, Tennessee, USA. https://doi.org/10.3334/ORNLDAAC/1981
Table of Contents
- Dataset Overview
- Data Characteristics
- Application and Derivation
- Quality Assessment
- Data Acquisition, Materials, and Methods
- Data Access
- References
Dataset Overview
This dataset contains cloud type and coarse aerosol contents measured by the University of Vienna's second-generation Cloud, Aerosol and Precipitation Spectrometer (CAPS) instrument mounted to the wing of the NASA DC-8 aircraft during the four ATom campaigns that occurred from 2016 to 2018. CAPS measures particle size distributions in a size range between nominally 0.5 and 930 micrometers. The sizes range between approximately 0.5 and 50 micrometers is covered by the optical particle counter component of CAPS—the Cloud and Aerosol Spectrometer (CAS). The sizes range from 15 to 930 micrometers is measured with the optical array probe called Cloud imaging Probe (CIP). Cloud types are determined using an algorithm developed to detect and classify clouds using measurements of CAPS. Additionally, relative humidity and temperature are considered by the algorithm. The cloud indicator provides a classification on a 1 Hz basis and separates data in cloud-free, aerosol-cloud transition regime (ACTR), liquid clouds, clouds in the Mixed-Phase Temperature Regime (MPTR), and cirrus clouds. The coarse aerosol product provides cloud and aerosol particle number concentrations at standard pressure (1013.25 hPa) and standard temperature (273.15 K) in selected size ranges. Particle sizes refer to ammonium sulfate optical equivalent diameter (m=1.52 + 0.0i).
Project: Atmospheric Tomography Mission
The Atmospheric Tomography Mission (ATom) was a NASA Earth Venture Suborbital-2 mission. It studied the impact of human-produced air pollution on greenhouse gases and on chemically reactive gases in the atmosphere. ATom deployed an extensive gas and aerosol payload on the NASA DC-8 aircraft for a systematic, global-scale sampling of the atmosphere, profiling continuously from 0.2 to 12 km altitude. Flights occurred in each of four seasons over a 4-year period.
Related Publications
Dollner, M., J. Gasteiger, M. Schöberl, A. Gattringer, N.D. Beres, G. Diskin, T.P. Bui, and B. Weinzierl. 2022. Automatic detection and classification of clouds with airborne in-situ observations. In preparation.
Related Datasets
Wofsy, S.C., S. Afshar, H.M. Allen, E.C. Apel, E.C. Asher, B. Barletta, et al. 2021. ATom: Merged Atmospheric Chemistry, Trace Gases, and Aerosols, Version 2. ORNL DAAC, Oak Ridge, Tennessee, USA. https://doi.org/10.3334/ORNLDAAC/1925.
- Data from all ATom instruments and all four flight campaigns, including aircraft location and navigation data, merged to several different time bases.
Wofsy, S.C., and ATom Science Team. 2018. ATom: Aircraft Flight Track and Navigational Data. ORNL DAAC, Oak Ridge, Tennessee, USA. https://doi.org/10.3334/ORNLDAAC/1613
- Flight path (location and altitude) data for each of the four campaigns provided in KML and CSV formats.
Data Characteristics
Spatial Coverage: Global. Flights circumnavigate the globe, primarily over the oceans
Spatial Resolution: Point measurements
Temporal Coverage: Periodic flights occurred during each campaign
| Campaign | Date Range |
|---|---|
| ATom-1 | July 29 - August 23, 2016 |
| ATom-2 | January 26 - February 21, 2017 |
| ATom-3 | September 28 - October 28, 2017 |
| ATom-4 | April 24 - May 21, 2018 |
Temporal Resolution: 1 second
Data File Information
There are 96 data files in ICARTT (*.ict) format included in this dataset that s conform to the ICARTT File Format Standards V1.1. Files are named FileType_DC8_YYYYMMDD_R#.ict, where FileType is the type of data ("Cloudindicator" or "NCoarseAerosol"), YYYYMMDD is the start date (in UTC time) of the flight, and R# is the file version or revision number.
Table 1. File names and descriptions.
| File Name | Description |
|---|---|
| Cloudindicator_DC8_YYYYMMDD_R#.ict | Contains cloud presence and type data |
| NCoarseAerosol_DC8_YYYYMMDD_R#.ict | Contains coarse aerosol number concentrations |
Data File Details
Table 2. Variable names and descriptions for files named Cloudindicator_DC8_YYYYMMDD_R#.ict.
| Variable | Units | Description |
|---|---|---|
| Time_UTC_CAPS | Seconds | Seconds since 0000 UTC |
| cloudindicator_CAPS | - | 0 = cloud-free, 1 = aerosol-cloud transition regime (ACTR), 2 = liquid cloud, 3 = cloud in the mixed-phase temperature regime, 4 = cirrus cloud. To mask data inside clouds, use cloudindicator values from 2 to 4. |
Table 3. Variable names and descriptions for files named NCoarseAerosol_DC8_YYYYMMDD_R#.ict.
| Variable | Units | Description |
|---|---|---|
| Time_UTC_CAPS | Seconds | Seconds since 0000 UTC |
| Nacc_CAPS | Particles / cm3 at STP | Particle number concentrations (N) of aerosol and cloud particles in size range 0.57 to 1.0 µm at standard temperature and pressure (STP). |
| Ncoa1_CAPS | Particles / cm3 at STP | Particle number concentrations (N) of aerosol and cloud particles in size range 1.0 to 10.0 µm at standard temperature and pressure (STP). |
| Ncoa2_CAPS | Particles / cm3 at STP | Particle number concentrations (N) of aerosol and cloud particles in size range 10.0 to 30.0 µm at standard temperature and pressure (STP). |
| Ncoa3_CAPS | Particles / cm3 at STP | Particle number concentrations (N) of aerosol and cloud particles in size range 30.0 to 50.0 µm at standard temperature and pressure (STP). |
| Ntot_CAPS | Particles / cm3 at STP | Total particle number concentrations (N) of aerosol and cloud particles in the CAS size range 0.57 to 50.0 µm at standard temperature and pressure (STP) conditions. |
| STP_Factor_CAPS | 1 | Factor used to convert data measured at ambient temperature and pressure to standard temperature and pressure of 273.15 K and 1013.25 hPa. |
Application and Derivation
ATom builds the scientific foundation for mitigation of short-lived climate forcers, in particular, methane (CH4), tropospheric ozone (O3), and Black Carbon aerosols (BC).
ATom Science Questions
Tier 1
- What are chemical processes that control the short-lived climate forcing agents CH4, O3, and BC in the atmosphere? How is the chemical reactivity of the atmosphere on a global scale affected by anthropogenic emissions? How can we improve chemistry-climate modeling of these processes?
Tier 2
- Over large, remote regions, what are the distributions of BC and other aerosols important as short-lived climate forcers? What are the sources of new particles? How rapidly do aerosols grow to CCN-active sizes? How well are these processes represented in models?
- What type of variability and spatial gradients occurs over remote ocean regions for greenhouse gases (GHGs) and ozone-depleting substances (ODSs)? How do the variations among air parcels help identify anthropogenic influences on photochemical reactivity, validate satellite data for these gases, and refine knowledge of sources and sinks?
Significance
ATom delivers unique data and analysis to address the Science Mission Directorate objectives of acquiring “datasets that identify and characterize important phenomena in the changing Earth system” and “measurements that address weaknesses in current Earth system models leading to improvement in modeling capabilities.” ATom will provide unprecedented challenges to the CCMs used as policy tools for climate change assessments, with comprehensive data on atmospheric chemical reactivity at global scales, and will work closely with modeling teams to translate ATom data to better, more reliable CCMs. ATom provides extraordinary validation data for remote sensing.
Quality Assessment
Information on quality is not available.
Data Acquisition, Materials, and Methods
Project Overview
ATom makes global-scale measurements of the chemistry of the atmosphere using the NASA DC-8 aircraft. Flights span the Pacific and Atlantic Oceans, nearly pole-to-pole, in continuous profiling mode, covering remote regions that receive long-range inputs of pollution from expanding industrial economies. The payload has proven instruments for in situ measurements of reactive and long-lived gases, diagnostic chemical tracers, and aerosol size, number, and composition, plus spectrally resolved solar radiation and meteorological parameters.
Combining distributions of aerosols and reactive gases with long-lived greenhouse gases (GHG) and ozone-depleting substances (ODS) enables disentangling of the processes that regulate atmospheric chemistry: emissions, transport, cloud processes, and chemical transformations. ATom analyzes measurements using customized modeling tools to derive daily averaged chemical rates for key atmospheric processes and to critically evaluate CCMs. ATom also differentiates between hypotheses for the formation and growth of aerosols over the remote oceans.
University of Vienna’s Cloud Aerosol and Precipitation Spectrometer
University of Vienna's second-generation Cloud Aerosol and Precipitation Spectrometer (CAPS) measures aerosol and cloud particle concentrations in the size range between nominally 0.5 and 930 µm. For the size range between 15 and 930 µm images of aerosol and cloud particles are recorded. Additional measurements of liquid water content, relative humidity, temperature, pressure, and airspeed are recorded with corresponding sensors.
The CAPS consists of two main components: the Cloud and Aerosol Spectrometer (CAS) and the Cloud Imaging Probe (CIP). The CAS measures particles in the size range between nominally 0.5 and 50 µm. It utilizes the principle of light-scattering. Particles scatter the light from an incident laser into a forward-sizing photodetector, recording the light intensity, which is used to infer particles size (Dollner et al., 2022). There is also a backscatter optics collecting the backscattered light of the particles.
The CIP operates in the size range between 15 and 930 µm. Particles passing through a collimated laser beam create shadow images onto a linear array of 64 photodiodes. Each diode represents one pixel of the image leading to a resolution of 15 µm. One recording of the state of the 64 photodiodes is a so-called “slice”. The complete image of a particle is reconstructed from individual “slices”, which are recorded with a rate proportional to the relative speed of the particle (Spanu et al., 2020).
The CAPS measurements are the primary inputs for the "cloudindicator" algorithm developed at the University of Vienna to detect and classify clouds (Dollner et al., 2022). In addition to CAPS data, measurements of relative humidity from DLH (Diskin) and temperature from MMS (Bui) are used in this algorithm. The cloudindicator product classifies the dataset into 5 classes: cloud-free, Aerosol-Cloud Transition Regime (ACTR), liquid clouds, clouds in the Mixed-Phase Temperature Regime (MPTR), and cirrus clouds. The complete criteria for the detection and classification can be found in Dollner et al., 2022. Additional information can be found at https://aerosols.univie.ac.at/instrumentation/.
Data Access
These data are available through the Oak Ridge National Laboratory (ORNL) Distributed Active Archive Center (DAAC).
ATom: Cloud and Coarse Aerosol Measurements from CAPS Instrument, 2016-2018
Contact for Data Center Access Information:
- E-mail: uso@daac.ornl.gov
- Telephone: +1 (865) 241-3952
References
Dollner, M., J. Gasteiger, M. Schöberl, A. Gattringer, N.D. Beres, G. Diskin, T.P. Bui, and B. Weinzierl. 2022. Automatic detection and classification of clouds with airborne in-situ observations. In preparation.
Spanu, A., M. Dollner, J. Gasteiger, T.P. Bui, and B. Weinzierl. 2020. Flow-induced errors in airborne in situ measurements of aerosols and clouds. Atmospheric Measurement Techniques 13:1963–1987. https://doi.org/10.5194/amt-13-1963-2020.