Documentation Revision Date: 2019-09-09
Dataset Version: 1
Summary
CAFS calculated the photolysis frequencies for photodissociation reactions from the radiative measurements. In situ solar radiation measurements are critical to NASA atmospheric composition research. Actinic flux radiation drives the chemistry of the atmosphere, including the evolution of ozone, greenhouse gases, biomass burning, and other anthropogenic and natural trace constituents.
This dataset includes 45 files in comma-delimited text (ICARTT) format, with one file per flight date.
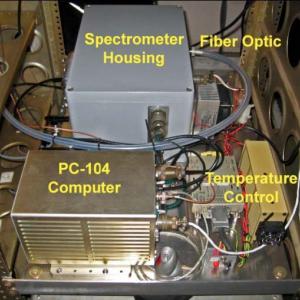
Figure 1. The CCD Actinic Flux Spectroradiometers (CAFS) detector installed on the NASA DC-8 aircraft.
Citation
Hall, S.R., and K. Ullmann. 2019. ATom: L2 Photolysis Frequencies from NCAR CCD Actinic Flux Spectroradiometers (CAFS). ORNL DAAC, Oak Ridge, Tennessee, USA. https://doi.org/10.3334/ORNLDAAC/1714
Table of Contents
- Dataset Overview
- Data Characteristics
- Application and Derivation
- Quality Assessment
- Data Acquisition, Materials, and Methods
- Data Access
- References
Dataset Overview
This dataset provides the photolysis frequencies for photodissociation reactions for a variety of species. Frequencies were calculated based on spectrally resolved down- and up-welling in situ ultraviolet and visible actinic flux from approximately 280-650 nm as measured by the CCD Actinic Flux Spectroradiometers (CAFS) during airborne campaigns conducted by NASA's Atmospheric Tomography (ATom) mission. ATom deploys an extensive gas and aerosol payload on the NASA DC-8 aircraft for systematic, global-scale sampling of the atmosphere, profiling continuously from 0.2 to 12 km altitude. Flights occurred in each of 4 seasons from 2016 to 2018. Flights originate from the Armstrong Flight Research Center in Palmdale, California, fly north to the western Arctic, south to the South Pacific, east to the Atlantic, north to Greenland, and return to California across central North America. ATom establishes a single, contiguous, global-scale dataset. This comprehensive dataset will be used to improve the representation of chemically reactive gases and short-lived climate forcers in global models of atmospheric chemistry and climate.
CAFS calculates the photolysis frequencies for photodissociation reactions from the radiative measurements. In situ solar radiation measurements are critical to NASA atmospheric composition research. Actinic flux radiation drives the chemistry of the atmosphere, including the evolution of ozone, greenhouse gases, biomass burning, and other anthropogenic and natural trace constituents.
Project: Atmospheric Tomography Mission (ATom)
The Atmospheric Tomography Mission (ATom) was a NASA Earth Venture Suborbital-2 mission. It studied the impact of human-produced air pollution on greenhouse gases and on chemically reactive gases in the atmosphere. ATom deployed an extensive gas and aerosol payload on the NASA DC-8 aircraft for systematic, global-scale sampling of the atmosphere, profiling continuously from 0.2 to 12 km altitude. Flights occurred in each of four seasons over a 4-year period.
Related Data
ATom: Merged Atmospheric Chemistry, Trace Gases, and Aerosols. Data from all ATom instruments and all four flight campaigns, including aircraft location and navigation data, merged to several different time bases: https://doi.org/10.3334/ORNLDAAC/1581
ATom Flight Track and Navigational Data. Flight path (location and altitude) data for each of the four campaigns provided in KML and csv format: https://doi.org/10.3334/ORNLDAAC/1613
Data Characteristics
Spatial Coverage: Global. Flights circumnavigate the globe, primarily over the oceans
Spatial Resolution: Point measurements
Temporal Coverage: Periodic flights occurred during each campaign
Table 1. Flight campaign schedule
| Deployment | Date Range |
|---|---|
| ATom-1 | July 29 - August 23, 2016 |
| ATom-2 | January 26 - February 21, 2017 |
| ATom-3 | September 28 - October 28, 2017 |
| ATom-4 | April 24 - May 21, 2018 |
Temporal Resolution: 3 seconds
Data File Information
This dataset includes 45 files in comma-delimited text (ICARTT) format, with one file per flight date for all four ATom flight campaigns. Data files conform to the ICARTT File Format Standards V1.1.
File names are structured as CAFS-JV_DC8_YYYYMMDD_R#.ict, where YYYYMMDD is the start date (in UTC time) of the flight and R# is the file version or revision number.
Data Variables
Missing data are indicated by -9999.
Table 2. Variables in the data files CAFS-JV_DC8_YYYYMMDD_R#.ict.
| Name | Units | Description |
|---|---|---|
| UTC_Start | seconds | Start time of sample in seconds since UTC midnight on day of takeoff |
| UTC_Stop | seconds | End time of sample in seconds since UTC midnight on day of takeoff |
| UTC_Mid | seconds | Midpoint of sample in seconds since UTC midnight on day of takeoff |
| j[O3->O2+O(1D)] | rate per second | |
| j[NO2->NO+O(3P)] | rate per second | |
| j[H2O2->2OH] | rate per second | |
| j[NO3->NO+O2] | rate per second | |
| j[NO3->NO2+O(3P)] | rate per second | |
| j[N2O5->NO3+NO2] | rate per second | |
| j[HNO2->OH+NO] | rate per second | |
| j[HNO3->OH+NO2] | rate per second | |
| j[HNO4->HO2+NO2(UV_VISonly)] | rate per second | |
| j[CH2O->H+HCO] | rate per second | |
| j[CH2O->H2+CO] | rate per second | |
| j[CH3CHO->CH3+HCO] | rate per second | |
| j[C2H5CHO->C2H5+HCO] | rate per second | |
| j[CH3OOH->CH3O+OH] | rate per second | |
| j[CH3ONO2->CH3O+NO2] | rate per second | |
| j[CH3CH2ONO2->CH3CH2O+NO2] | rate per second | |
| j[CH3CO(OONO2)->CH3CO(OO)+NO2] | rate per second | |
| j[CH3CO(OONO2)->CH3CO(O)+NO3] | rate per second | |
| j[CH2=C(CH3)CHO->Products] | rate per second | |
| j[CH3COCH=CH2->Products] | rate per second | |
| j[CH3COCH3->CH3CO+CH3] | rate per second | |
| j[CH3COCH2CH3->CH3CO+CH2CH3] | rate per second | |
| j[CH2(OH)COCH3->CH3CO+CH2(OH)] | rate per second | |
| j[CH2(OH)COCH3->CH2(OH)CO+CH3] | rate per second | |
| j[CHOCHO->HCO+HCO] | rate per second | |
| j[CHOCHO->H2+2CO] | rate per second | |
| j[CHOCHO->CH2O+CO] | rate per second | |
| j[CH3COCHO->CH3CO+HCO] | rate per second | |
| j[CH3COCOCH3->Products] | rate per second | |
| j[Cl2->Cl+Cl] | rate per second | |
| j[ClO->Cl+O(3P)] | rate per second | |
| j[ClNO2->Cl+NO2] | rate per second | |
| j[ClONO->Cl+NO2] | rate per second | |
| j[ClONO2->Cl+NO3] | rate per second | |
| j[ClONO2->ClO+NO2] | rate per second | |
| j[Br2->Br+Br] | rate per second | |
| j[BrO->Br+O] | rate per second | |
| j[HOBr->OH+Br] | rate per second | |
| j[BrNO->Br+NO] | rate per second | |
| j[BrONO->Br+NO2] | rate per second | |
| j[BrONO->BrO+NO] | rate per second | |
| j[BrNO2->Br+NO2] | rate per second | |
| j[BrONO2->BrO+NO2] | rate per second | |
| j[BrONO2->Br+NO3] | rate per second | |
| j[BrCl->Br+Cl] | rate per second | |
| j[CHBr3->Products] | rate per second | |
| jO3_dnwFrac | ratio | jO3_downwelling/(jO3_downwelling+jO3_upwelling) |
| jNO2_dnwFrac | ratio | jNO2_downwelling/(jNO2_downwelling+jNO2_upwelling) |
Application and Derivation
ATom builds the scientific foundation for mitigation of short-lived climate forcers, in particular methane (CH4), tropospheric ozone (O3), and Black Carbon aerosols (BC).
ATom Science Questions
Tier 1
- What are chemical processes that control the short-lived climate forcing agents CH4, O3, and BC in the atmosphere? How is the chemical reactivity of the atmosphere on a global scale affected by anthropogenic emissions? How can we improve chemistry-climate modeling of these processes?
Tier 2
- Over large, remote regions, what are the distributions of BC and other aerosols important as short-lived climate forcers? What are the sources of new particles? How rapidly do aerosols grow to CCN-active sizes? How well are these processes represented in models?
- What type of variability and spatial gradients occur over remote ocean regions for greenhouse gases (GHGs) and ozone depleting substances (ODSs)? How do the variations among air parcels help identify anthropogenic influences on photochemical reactivity, validate satellite data for these gases, and refine knowledge of sources and sinks?
Significance
ATom delivers unique data and analysis to address the Science Mission Directorate objectives of acquiring “datasets that identify and characterize important phenomena in the changing Earth system” and “measurements that address weaknesses in current Earth system models leading to improvement in modeling capabilities.” ATom will provide unprecedented challenges to the CCMs used as policy tools for climate change assessments, with comprehensive data on atmospheric chemical reactivity at global scales, and will work closely with modeling teams to translate ATom data to better, more reliable CCMs. ATom provides extraordinary validation data for remote sensing.
Quality Assessment
Uncertainty information is not provided.
Data Acquisition, Materials, and Methods
Project Overview
ATom makes global-scale measurements of the chemistry of the atmosphere using the NASA DC-8 aircraft. Flights span the Pacific and Atlantic Oceans, nearly pole-to-pole, in continuous profiling mode, covering remote regions that receive long-range inputs of pollution from expanding industrial economies. The payload has proven instruments for in situ measurements of reactive and long-lived gases, diagnostic chemical tracers, and aerosol size, number, and composition, plus spectrally resolved solar radiation and meteorological parameters.
Combining distributions of aerosols and reactive gases with long-lived GHGs and ODSs enables disentangling of the processes that regulate atmospheric chemistry: emissions, transport, cloud processes, and chemical transformations. ATom analyzes measurements using customized modeling tools to derive daily averaged chemical rates for key atmospheric processes and to critically evaluate Chemistry-Climate Models (CCMs). ATom also differentiates between hypotheses for the formation and growth of aerosols over the remote oceans.
CCD Actinic Flux Spectroradiometers (CAFS)
CAFS measure spectrally resolved down- and up-welling in situ ultraviolet and visible actinic flux from approximately 280-650 nm. Photolysis frequencies for photodissociation reactions for species including O3, NO2, CH2O, HONO, HNO3, N2O5, HO2NO2, PAN, H2O2, CH3OOH, CH3ONO2, CH3CH2ONO2, CH3COCH3, CH3CHO, CH3CH2CHO, CHOCHO, CH3COCHO, CH3CH2CH2CHO, CH3COCH2CH3, Br2, BrO, Br2O, BrNO3, BrCl, HOBr, BrONO2, Cl2, ClO, and ClONO2 are calculated from the radiative measurements. In situ solar radiation measurements are critical to NASA atmospheric composition research. Actinic flux radiation drives the chemistry of the atmosphere, including the evolution of ozone, greenhouse gases, biomass burning, and other anthropogenic and natural trace constituents. The evolution of boundary layer and tropospheric constituents convected to the upper troposphere and lower stratosphere requires knowledge of the complex radiative fields expected during the campaigns. The gases, in turn, control the chemical evolution of aerosols. More information is provided in Shetter & Mueller (1999).
Data Access
These data are available through the Oak Ridge National Laboratory (ORNL) Distributed Active Archive Center (DAAC).
ATom: L2 Photolysis Frequencies from NCAR CCD Actinic Flux Spectroradiometers (CAFS)
Contact for Data Center Access Information:
- E-mail: uso@daac.ornl.gov
- Telephone: +1 (865) 241-3952
References
Shetter, R. E., and M. Mueller (1999), Photolysis frequency measurements using actinic flux spectroradiometry during the PEM-Tropics mission: Instrumentation description and some results, J. Geophys. Res., 104, 5647-5661. https://doi.org/10.1029/98JD01381