Documentation Revision Date: 2019-11-15
Dataset Version: 1
Summary
This dataset includes 48 files in comma-delimited text (ICARTT) format.
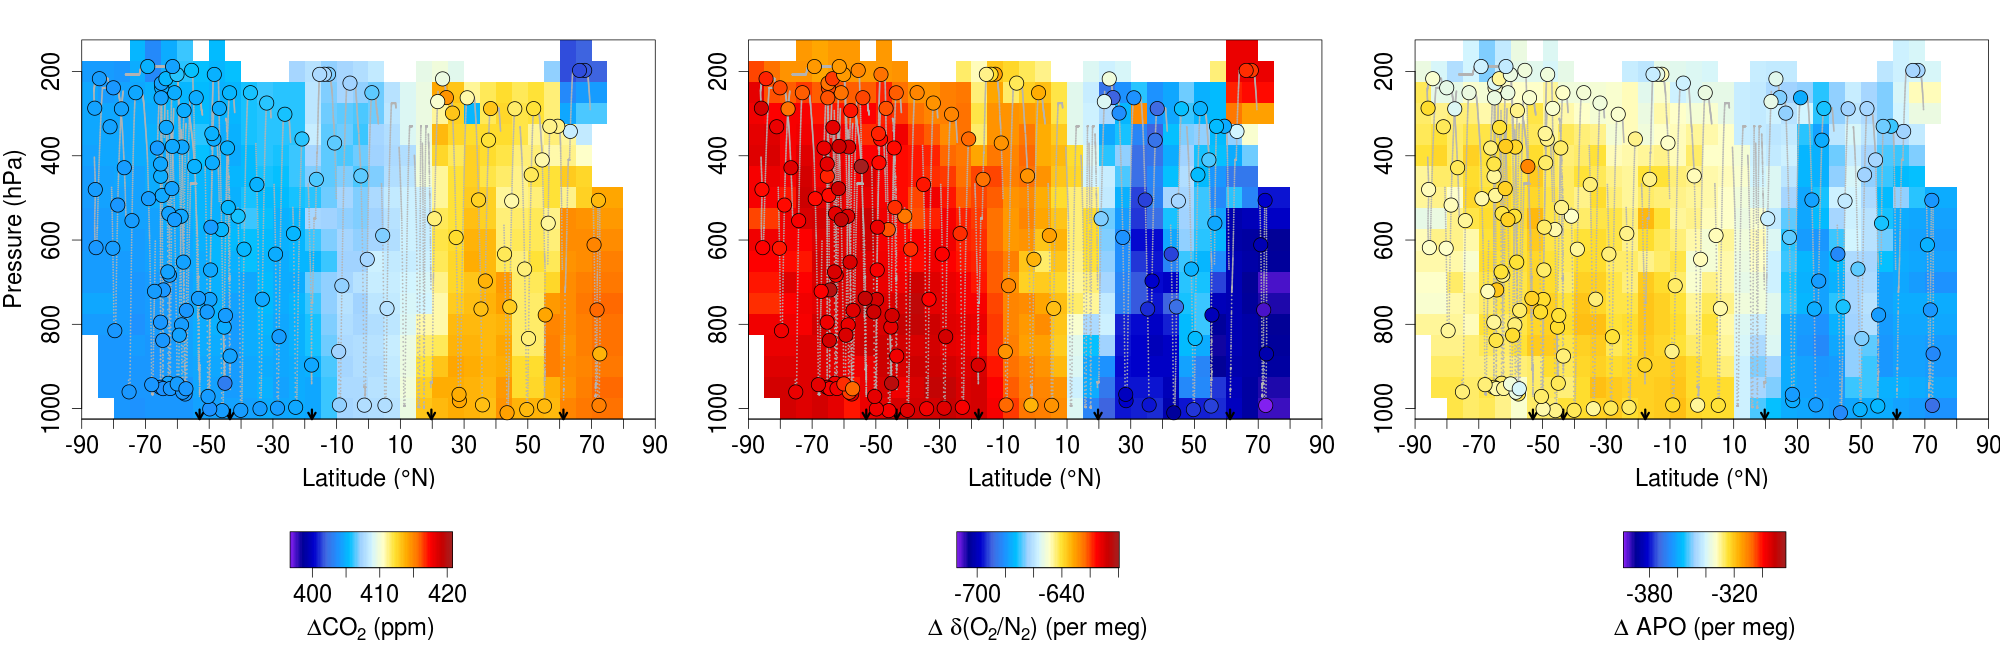
Figure 1: Example cross-sections of CO2, O2, and APO (O2 + 1.1 * CO2) measured by AO2 (interpolated flight track data) and the Medusa flask sampler (filled circles) during the Pacific southbound flights of Atom-4 in April/May, 2018. Image from NCAR Earth Observing Laboratory.
Citation
Stephens, B.B., E.J. Morgan, A. Watt, J. Bent, S. Afshar, R.F. Keeling, and W. Paplawsky. 2019. ATom: L2 In Situ Measurements from the NCAR Airborne Oxygen Instrument (AO2). ORNL DAAC, Oak Ridge, Tennessee, USA. https://doi.org/10.3334/ORNLDAAC/1704
Table of Contents
- Dataset Overview
- Data Characteristics
- Application and Derivation
- Quality Assessment
- Data Acquisition, Materials, and Methods
- Data Access
- References
Dataset Overview
This dataset provides in situ atmospheric oxygen and carbon dioxide concentrations measured by the NCAR Airborne Oxygen Instrument (AO2) during airborne campaigns conducted by NASA's Atmospheric Tomography (ATom) mission. The AO2 Instrument measures O2 concentration using a vacuum-ultraviolet absorption technique. ATom deploys an extensive gas and aerosol payload on the NASA DC-8 aircraft for systematic, global-scale sampling of the atmosphere, profiling continuously from 0.2 to 12 km altitude. Flights occurred in each of 4 seasons from 2016 to 2018. Flights originate from the Armstrong Flight Research Center in Palmdale, California, fly north to the western Arctic, south to the South Pacific, east to the Atlantic, north to Greenland, and return to California across central North America. ATom establishes a single, contiguous, global-scale dataset. This comprehensive dataset will be used to improve the representation of chemically reactive gases and short-lived climate forcers in global models of atmospheric chemistry and climate.
Project: Atmospheric Tomography Mission (ATom)
The Atmospheric Tomography Mission (ATom) was a NASA Earth Venture Suborbital-2 mission. It studied the impact of human-produced air pollution on greenhouse gases and on chemically reactive gases in the atmosphere. ATom deployed an extensive gas and aerosol payload on the NASA DC-8 aircraft for systematic, global-scale sampling of the atmosphere, profiling continuously from 0.2 to 12 km altitude. Flights occurred in each of four seasons over a 4-year period.
Related Data:
ATom: Merged Atmospheric Chemistry, Trace Gases, and Aerosols. Data from all ATom instruments and all four flight campaigns, including aircraft location and navigation data, merged to several different time bases: https://doi.org/10.3334/ORNLDAAC/1581
ATom Flight Track and Navigational Data. Flight path (location and altitude) data for each of the four campaigns provided in KML and csv format: https://doi.org/10.3334/ORNLDAAC/1613
Data Characteristics
Spatial Coverage: Global. Flights circumnavigate the globe, primarily over the oceans
Spatial Resolution: Point measurements
Temporal Coverage: Periodic flights occurred during each campaign
Table 1: Flight campaign schedule
|
Campaign |
Date Range |
|---|---|
| ATom-1 | July 29 - August 23, 2016 |
| ATom-2 | January 26 - February 21, 2017 |
| ATom-3 | September 28 - October 28, 2017 |
| ATom-4 | April 24 - May 21, 2018 |
Temporal Resolution: Data are 1-second interpolated values from approximately 2.5-second raw data.
Data File Information:
This dataset includes 48 files in comma-separated (ICARTT) format, with one file per flight date for all four ATom flight campaigns. Data files conform to the ICARTT File Format Standards V1.1. https://www-air.larc.nasa.gov/missions/etc/IcarttDataFormat.htm .
File names are structured as AO2_DC8_YYYYMMDD_R#_a.ict
where YYYYMMDD = the start date (in UTC time) of the flight
R#_a = file version or revision number
Example file name: AO2_DC8_20160817_R2_a.ict
Data Variables:
The AO2 instrument measures the concentration of atmospheric oxygen relative to atmospheric nitrogen, in units of "per meg" or 0.0001% (1/1000000) deviation from a reference value, and the concentration of atmospheric carbon dioxide (see https://www.eol.ucar.edu/instruments/airborne-oxygen-instrument ).
Table 2: Variables in the data files
| Variable Name | Units | Description |
| Start_UTC | seconds | seconds since midnight |
| CO2raw_AO2 | ppm | dry air mole fraction of CO2 on WMO X2007 scale |
| O2N2raw_AO2 | per meg | deviations in the rato of O2 to N2 on the Scripps O2 Laboratory scale |
| APOraw_AO2 | per meg | atmospheric potential oxygen (O2/N2+1.1*(CO2-350)) |
| CO2_AO2 | ppm | dry air mole fraction of CO2 on WMO X2007 scale adjusted to match Medusa flasks |
| O2N2_AO2 | per meg | deviations in the ratio of O2 to N2 on the Scripps O2 Laboratory scale adjusted to match Medusa flasks |
| APO_AO2 | per meg | atmospheric potential oxygen (O2/N2+1.1*(CO2-350)) adjusted to match Medusa flasks |
Application and Derivation
ATom builds the scientific foundation for mitigation of short-lived climate forcers, in particular methane (CH4), tropospheric ozone (O3), and Black Carbon aerosols (BC).
ATom Science Questions:
Tier 1
- What are chemical processes that control the short-lived climate forcing agents CH4, O3, and BC in the atmosphere? How is the chemical reactivity of the atmosphere on a global scale affected by anthropogenic emissions? How can we improve chemistry-climate modeling of these processes?
Tier 2
- Over large, remote regions, what are the distributions of BC and other aerosols important as short-lived climate forcers? What are the sources of new particles? How rapidly do aerosols grow to CCN-active sizes? How well are these processes represented in models?
- What type of variability and spatial gradients occur over remote ocean regions for greenhouse gases (GHGs) and ozone depleting substances (ODSs)? How do the variations among air parcels help identify anthropogenic influences on photochemical reactivity, validate satellite data for these gases, and refine knowledge of sources and sinks?
Significance
ATom delivers unique data and analysis to address the Science Mission Directorate objectives of acquiring “datasets that identify and characterize important phenomena in the changing Earth system” and “measurements that address weaknesses in current Earth system models leading to improvement in modeling capabilities.” ATom will provide unprecedented challenges to the CCMs used as policy tools for climate change assessments, with comprehensive data on atmospheric chemical reactivity at global scales, and will work closely with modeling teams to translate ATom data to better, more reliable CCMs. ATom provides extraordinary validation data for remote sensing.
Quality Assessment
AO2 Measurement Characteristics:
- Overall estimate of uncertainty: 5 per meg
- Response time: 0.4 Hz (raw data sampled at 10 Hz) for sensor, but mixing in inlet and trap volumes results in a 20 s smoothing window.
- Precision: 2.5 per meg (5 s integrated measurement)
- Other measurement characteristics (comments on signal/noise, bias limits, etc):
- Measurements are relative to the Scripps O2 scale, with zero relative to a suite of reference cylinders of air.
Calibration Methods:
Four high pressure reference cylinders are carried inside the instrument for calibration. High span and low span is analyzed every ~50 minutes for calibration. O2 and CO2 values on established scales are assigned to these field cylinders by the NCAR O2 / CO2 Calibration Facility.
Data Acquisition, Materials, and Methods
Project Overview:
ATom makes global-scale measurements of the chemistry of the atmosphere using the NASA DC-8 aircraft. Flights span the Pacific and Atlantic Oceans, nearly pole-to-pole, in continuous profiling mode, covering remote regions that receive long-range inputs of pollution from expanding industrial economies. The payload has proven instruments for in situ measurements of reactive and long-lived gases, diagnostic chemical tracers, and aerosol size, number, and composition, plus spectrally resolved solar radiation and meteorological parameters.
Combining distributions of aerosols and reactive gases with long-lived GHGs and ODSs enables disentangling of the processes that regulate atmospheric chemistry: emissions, transport, cloud processes, and chemical transformations. ATom analyzes measurements using customized modeling tools to derive daily averaged chemical rates for key atmospheric processes and to critically evaluate Chemistry-Climate Models (CCMs). ATom also differentiates between hypotheses for the formation and growth of aerosols over the remote oceans.
NCAR Airborne Oxygen Instrument (AO2)
The AO2 measures O2 concentration using a vacuum-ultraviolet absorption technique. AO2 is based on earlier ship-board and laboratory instruments using the same technique, but has been designed specifically for airborne use to minimize motion and thermal sensitivity and with a pressure and flow controlled inlet system. To achieve the high levels of precision needed, AO2 switches between sample gas and air from a high-pressure reference cylinder every 2.5 seconds. Atmospheric O2 concentrations are typically reported in units of one part in 1,000,000 relative deviations in the O2/N2 ratio, which are referred to as "per meg." AO2 has a 1-sigma precision of ± 2.5 per meg on a 5 second measurement. For comparison, this is equivalent to detecting the removal of one O2 molecule from 2.5 million molecules of air. At typical flight speeds of 300 kts or climb/descent rates of 1500 fpm, 5-seconds correspond to a horizontal resolution of 750 m and a vertical resolution of 40 m. The instrument includes an internal single-cell CO2 sensor (LI-840), which is used to correct the O2 measurements for dilution by CO2 and for scientific purposes. To minimize inlet surface effects, the pressure in the inlet line is actively controlled at the aircraft bulkhead. The sample air is cryogenically dried in a series of electropolished stainless steel traps immersed in a dry ice Fluorinert slurry. The AO2 system consists of a pump module, a cylinder module, an instrument module, and a dewar. More information about the AO2 is provided in Stephens et al. (2003; 2018; 2019).
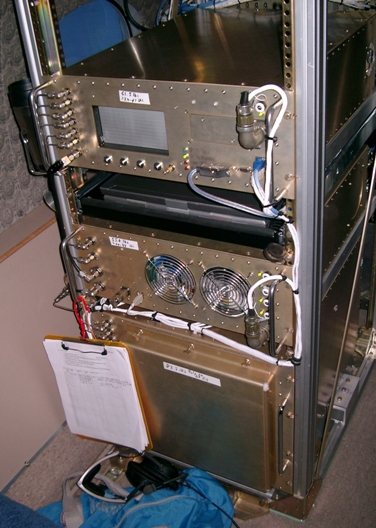
Figure 2. The AO2 instrument as used during the HIPPO flights (2009-2011; see https://www.eol.ucar.edu/field_projects/hippo ).
History of Significant Deployments: AO2 flew on the ACME-07, START-08, all 5 HIPPO, ARISTO-2015, ORCAS, and all 4 ATom campaigns.
Data Access
These data are available through the Oak Ridge National Laboratory (ORNL) Distributed Active Archive Center (DAAC).
ATom: L2 In Situ Measurements from the NCAR Airborne Oxygen Instrument (AO2)
Contact for Data Center Access Information:
- E-mail: uso@daac.ornl.gov
- Telephone: +1 (865) 241-3952
References
Stephens, B.B., M.C. Long, R.F. Keeling, E.A. Kort, C. Sweeney, E.C. Apel, E.L. Atlas, S. Beaton, J.D. Bent, N.J. Blake, J.F. Bresch, J. Casey, B.C. Daube, M. Diao, E. Diaz, H. Dierssen, V. Donets, B. Gao, M. Gierach, R. Green, J. Haag, M. Hayman, A.J. Hills, M.S. Hoecker-Martínez, S.B. Honomichl, R.S. Hornbrook, J.B. Jensen, R. Li, I. McCubbin, K. McKain, E.J. Morgan, S. Nolte, J.G. Powers, B. Rainwater, K. Randolph, M. Reeves, S.M. Schauffler, K. Smith, M. Smith, J. Stith, G. Stossmeister, D.W. Toohey, and A.S. Watt, 2018: The O2/N2 Ratio and CO2 Airborne Southern Ocean Study. Bull. Amer. Meteor. Soc., 99, 381–402, https://doi.org/10.1175/BAMS-D-16-0206.1
Stephens, B. B., R. F. Keeling, and W. J. Paplawsky, 2003: Shipboard measurements of atmospheric oxygen using a vacuum-ultraviolet absorption technique. Tellus B, 55, 857-878, http://doi.org/10.3402/tellusb.v55i4.16386.
Stephens, B. B., J. D. Bent, A. S. Watt, S. R. Shertz, R. F. Keeling, E. J. Morgan, and B. C. Daube, 2019: Airborne measurements of oxygen concentration from the surface to the lower stratosphere and pole to pole. Atm. Meas. Tech. In Prep.