Documentation Revision Date: 2019-06-13
Dataset Version: 1
Summary
This dataset includes 131 files in comma-delimited text (ICARTT) format.

Figure 1: The ATom aircraft prepares to depart from Punta Arenas in southern Chile on October 14, 2017. During ATom-3, the science team flew over Antarctica and below the ozone hole before continuing on their journey north over the Atlantic Ocean to Greenland and returning to California.
Citation
Brock, C.A., A. Kupc, C.J. Williamson, K. Froyd, F. Erdesz, D.M. Murphy, G.P. Schill, D.W. Gesler, R.J. Mclaughlin, M. Richardson, N.L. Wagner, and J.C. Wilson. 2019. ATom: L2 In Situ Measurements of Aerosol Microphysical Properties (AMP). ORNL DAAC, Oak Ridge, Tennessee, USA. https://doi.org/10.3334/ORNLDAAC/1671
Table of Contents
- Dataset Overview
- Data Characteristics
- Application and Derivation
- Quality Assessment
- Data Acquisition, Materials, and Methods
- Data Access
- References
Dataset Overview
This dataset provides the number, surface, and volume concentrations and size distributions of dry aerosol particles measured by the Aerosol Microphysical Properties (AMP) instrument package during airborne campaigns conducted by NASA's Atmospheric Tomography (ATom) mission. Five instruments--two nucleation-mode aerosol size spectrometers (NMASS), two ultra-high sensitivity aerosol spectrometers (UHSAS), and a laser aerosol spectrometer (LAS)--comprise the AMP package. The AMP payload provides size distributions with up to one-second time resolution for dry aerosol particles between 0.003 and 4.8 microns in diameter. Three types of data are included here: 1) NAerosol, includes calculated optical parameters such as the asymmetry parameter and extinction at multiple wavelengths of relevance to satellite, Aeronet, and lidar measurements; 2) NCoarseAerosol, provides the particle number concentrations of aerosol and cloud particles in selected size ranges at standard temperature and pressure, and 3) SDAerosol, contains the complete dry particle size distribution in 66 size bins.
Project: Atmospheric Tomography Mission (ATom)
The Atmospheric Tomography Mission (ATom) was a NASA Earth Venture Suborbital-2 mission. It studied the impact of human-produced air pollution on greenhouse gases and on chemically reactive gases in the atmosphere. ATom deployed an extensive gas and aerosol payload on the NASA DC-8 aircraft for systematic, global-scale sampling of the atmosphere, profiling continuously from 0.2 to 12 km altitude. Flights occurred in each of four seasons over a 4-year period.
Related Data:
ATom: Merged Atmospheric Chemistry, Trace Gases, and Aerosols. Data from all ATom instruments and all four flight campaigns, including aircraft location and navigation data, merged to several different time bases: https://doi.org/10.3334/ORNLDAAC/1581
ATom Flight Track and Navigational Data. Flight path (location and altitude) data for each of the four campaigns provided in KML and csv format: https://doi.org/10.3334/ORNLDAAC/1613
Data Characteristics
Spatial Coverage: Global. Flights circumnavigate the globe, primarily over the oceans
Spatial Resolution: Point measurements
Temporal Coverage: Periodic flights occurred during each campaign
Table 1: Flight campaign schedule
|
Campaign |
Date Range |
|---|---|
| ATom-1 | July 29 - August 23, 2016 |
| ATom-2 | January 26 - February 21, 2017 |
| ATom-3 | September 28 - October 28, 2017 |
| ATom-4 | April 24 - May 21, 2018 |
Temporal Resolution: 1 second
Data File Information:
This dataset includes 131 files in comma-delimited text (ICARTT) format, with one file per data type per flight date for all four ATom flight campaigns. However, note that data on NCoarseAerosols are not yet available for ATom-4 flights. Data files conform to the ICARTT File Format Standards V1.1. https://www-air.larc.nasa.gov/missions/etc/IcarttDataFormat.htm .
File names are structured as type_DC8_YYYYMMDD_R#.ict
where type = either NAerosol, NCoarseAerosol, or SDAerosol
YYYYMMDD = the start date (in UTC time) of the flight
R# = file version or revision number
Example file name: NAerosol_DC8_20170221_R2.ict
Data Variables:
NAerosol data type: Number, surface, and volume concentrations of dry aerosol particles at STP and calculated extinction. Diameter ranges: nucl = 0.0027-0.012 um diam; aitken = 0.012-0.06 um; accum = 0.06 to 0.5; coarse = 0.5-4.8 um; fine = 0.0027-0.5 um. Ammonium sulfate optical equivalent diameter. All data provided at standard temperature and pressure: 1013 hPa and 0 Celsius. Asymmetry data were smoothed with 10 passes of a binomial smoothing filter. Missing data are indicated by -9999.00.
Table 2: Variables in the data files NAerosol_DC8_YYYYMMDD_RX.ict.
| Variable Name | Units | Description |
| N_nucl_AMP | #/cm^3 | particle number concentration over nucleation mode diameter range 0.0027 < Dp <= 0.012 µm |
| S_nucl_AMP | um^2/cm^3 | particle surface area concentration over nucleation mode diameter range 0.0027 < Dp <= .012 µm |
| V_nucl_AMP | um^3/cm^3 | particle volume concentration over nucleation diameter range 0.0027 < Dp <= .012 µm |
| N_aitken_AMP | #/cm^3 | particle number concentration over Aitken mode diameter range .012 < Dp <=0.06 µm |
| S_aitken_AMP | um^2/cm^3 | particle surface area concentration over Aitken mode diameter range .012 < Dp <=0.06 µm |
| V_aitken_AMP | um^3/cm^3 | particle volume concentration over Aitken mode diameter range .012 < Dp <=0.06 µm |
| N_accum_AMP | #/cm^3 | particle number concentration over accumulation mode diameter range 0.06 < Dp <=0.50 µm |
| S_accum_AMP | um^2/cm^3 | particle surface area concentration over accumulation mode diameter range 0.06 < Dp <=0.50 µm |
| V_accum_AMP | um^3/cm^3 | particle volume concentration over accumulation mode diameter range 0.06 < Dp <=0.50 µm |
| N_coarse_AMP | #/cm^3 | particle number concentration over coarse mode diameter range 0.50 < Dp <=4.8 µm |
| S_coarse_AMP | um^2/cm^3 | particle surface area concentration over coarse mode diameter range 0.50 < Dp <=4.8 µm |
| V_coarse_AMP | um^3/cm^3 | particle volume concentration over coarse mode diameter range 0.50 < Dp <=4.8 µm |
| N_fine_AMP | #/cm^3 | particle number concentration over nucleation, Aitken, and accumulation mode diameter ranges 0.0027 < Dp <=0.50 µm |
| S_fine_AMP | um^2/cm^3 | particle surface area concentration over nucleation, Aitken, and accumulation mode diameter ranges 0.0027 < Dp <=0.50 µm |
| V_fine_AMP | um^3/cm^3 | particle volume concentration over nucleation, Aitken, and accumulation mode diameter ranges 0.0027 < Dp <=0.50 µm |
| calc_ext_340_AMP | Mm^-1 | total calculated particle extinction at 340 nm wavelength assuming dry ammonium sulfate over diameter ranges 0.0027 < Dp <=4.8 um in Mm^-1 at 1013 hPa and 0 Celsius |
| calc_ext_380_AMP | Mm^-1 | total calculated particle extinction at 380 nm wavelength assuming dry ammonium sulfate over diameter ranges 0.0027 < Dp <=4.8 um in Mm^-1 at 1013 hPa and 0 Celsius |
| calc_ext_405_AMP | Mm^-1 | total calculated particle extinction at 405 nm wavelength assuming dry ammonium sulfate over diameter ranges 0.0027 < Dp <=4.8 um in Mm^-1 at 1013 hPa and 0 Celsius |
| calc_ext_440_AMP | Mm^-1 | total calculated particle extinction at 440 nm wavelength assuming dry ammonium sulfate over diameter ranges 0.0027 < Dp <=4.8 um in Mm^-1 at 1013 hPa and 0 Celsius |
| calc_ext_500_AMP | Mm^-1 | total calculated particle extinction at 500 nm wavelength assuming dry ammonium sulfate over diameter ranges 0.0027 < Dp <=4.8 um in Mm^-1 at 1013 hPa and 0 Celsius |
| calc_ext_532_AMP | Mm^-1 | total calculated particle extinction at 532 nm wavelength assuming dry ammonium sulfate over diameter ranges 0.0027 < Dp <=4.8 um in Mm^-1 at 1013 hPa and 0 Celsius |
| calc_ext_664_AMP | Mm^-1 | total calculated particle extinction at 664 nm wavelength assuming dry ammonium sulfate over diameter ranges 0.0027 < Dp <=4.8 um in Mm^-1 at 1013 hPa and 0 Celsius |
| calc_ext_675_AMP | Mm^-1 | total calculated particle extinction at 675 nm wavelength assuming dry ammonium sulfate over diameter ranges 0.0027 < Dp <=4.8 um in Mm^-1 at 1013 hPa and 0 Celsius |
| calc_ext_870_AMP | Mm^-1 | total calculated particle extinction at 870 nm wavelength assuming dry ammonium sulfate over diameter ranges 0.0027 < Dp <=4.8 um in Mm^-1 at 1013 hPa and 0 Celsius |
| calc_ext_937_AMP | Mm^-1 | total calculated particle extinction at 937 nm wavelength assuming dry ammonium sulfate over diameter ranges 0.0027 < Dp <=4.8 um in Mm^-1 at 1013 hPa and 0 Celsius |
| calc_ext_1020_AMP | Mm^-1 | total calculated particle extinction at 1020 nm wavelength assuming dry ammonium sulfate over diameter ranges 0.0027 < Dp <=4.8 um in Mm^-1 at 1013 hPa and 0 Celsius |
| calc_ext_1064_AMP | Mm^-1 | total calculated particle extinction at 1064 nm wavelength assuming dry ammonium sulfate over diameter ranges 0.0027 < Dp <=4.8 um in Mm^-1 at 1013 hPa and 0 Celsius |
| calc_ext_1640_AMP | Mm^-1 | total calculated particle extinction at 1640 nm wavelength assuming dry ammonium sulfate over diameter ranges 0.0027 < Dp <=4.8 um in Mm^-1 at 1013 hPa and 0 Celsius |
| asymmetry_340_AMP | Mm^-1 | total calculated asymmetry parameter at 340 nm wavelength assuming dry ammonium sulfate over diameter ranges 0.0027 < Dp <=4.8 um in Mm^-1 at 1013 hPa and 0 Celsius smoothed with 10 iterations of binomial smoothing |
| asymmetry_380_AMP | Mm^-1 | total calculated asymmetry parameter at 380 nm wavelength assuming dry ammonium sulfate over diameter ranges 0.0027 < Dp <=4.8 um in Mm^-1 at 1013 hPa and 0 Celsius smoothed with 10 iterations of binomial smoothing |
| asymmetry_405_AMP | Mm^-1 | total calculated asymmetry parameter at 405 nm wavelength assuming dry ammonium sulfate over diameter ranges 0.0027 < Dp <=4.8 um in Mm^-1 at 1013 hPa and 0 Celsius smoothed with 10 iterations of binomial smoothing |
| asymmetry_440_AMP | Mm^-1 | total calculated asymmetry parameter at 440 nm wavelength assuming dry ammonium sulfate over diameter ranges 0.0027 < Dp <=4.8 um in Mm^-1 at 1013 hPa and 0 Celsius smoothed with 10 iterations of binomial smoothing |
| asymmetry_500_AMP | Mm^-1 | total calculated asymmetry parameter at 500 nm wavelength assuming dry ammonium sulfate over diameter ranges 0.0027 < Dp <=4.8 um in Mm^-1 at 1013 hPa and 0 Celsius smoothed with 10 iterations of binomial smoothing |
| asymmetry_532_AMP | Mm^-1 | total calculated asymmetry parameter at 532 nm wavelength assuming dry ammonium sulfate over diameter ranges 0.0027 < Dp <=4.8 um in Mm^-1 at 1013 hPa and 0 Celsius smoothed with 10 iterations of binomial smoothing |
| asymmetry_664_AMP | Mm^-1 | total calculated asymmetry parameter at 664 nm wavelength assuming dry ammonium sulfate over diameter ranges 0.0027 < Dp <=4.8 um in Mm^-1 at 1013 hPa and 0 Celsius smoothed with 10 iterations of binomial smoothing |
| asymmetry_675_AMP | Mm^-1 | total calculated asymmetry parameter at 675 nm wavelength assuming dry ammonium sulfate over diameter ranges 0.0027 < Dp <=4.8 um in Mm^-1 at 1013 hPa and 0 Celsius smoothed with 10 iterations of binomial smoothing |
| asymmetry_870_AMP | Mm^-1 | total calculated asymmetry parameter at 870 nm wavelength assuming dry ammonium sulfate over diameter ranges 0.0027 < Dp <=4.8 um in Mm^-1 at 1013 hPa and 0 Celsius smoothed with 10 iterations of binomial smoothing |
| asymmetry_937_AMP | Mm^-1 | total calculated asymmetry parameter at 937 nm wavelength assuming dry ammonium sulfate over diameter ranges 0.0027 < Dp <=4.8 um in Mm^-1 at 1013 hPa and 0 Celsius smoothed with 10 iterations of binomial smoothing |
| asymmetry_1020_AMP | Mm^-1 | total calculated asymmetry parameter at 1020 nm wavelength assuming dry ammonium sulfate over diameter ranges 0.0027 < Dp <=4.8 um in Mm^-1 at 1013 hPa and 0 Celsius smoothed with 10 iterations of binomial smoothing |
| asymmetry_1064_AMP | Mm^-1 | total calculated asymmetry parameter at 1064 nm wavelength assuming dry ammonium sulfate over diameter ranges 0.0027 < Dp <=4.8 um in Mm^-1 at 1013 hPa and 0 Celsius smoothed with 10 iterations of binomial smoothing |
| asymmetry_1640_AMP | Mm^-1 | total calculated asymmetry parameter at 1640 nm wavelength assuming dry ammonium sulfate over diameter ranges 0.0027 < Dp <=4.8 um in Mm^-1 at 1013 hPa and 0 Celsius smoothed with 10 iterations of binomial smoothing |
NCoarseAerosol data type: Particle number concentrations (N) of aerosol and cloud particles in selected size ranges at standard temperature and pressure (STP) conditions. Size ranges: Acc = 0.56 to 1.0 um, Coa1 = 1.0 to 10.0 um, Coa2 = 10.0 to 30.0 um, Coa3 = 30.0 to 50.0 um. Indicated size ranges refer to ammonium sulfate optical equivalent diameter (m=1.52 + 0.0i). Missing data are indicated by -9999.00.
Table 3: Variables in the data files NCoarseAerosol_DC8_YYYYMMDD_RX.ict.
| Variable Name | Units | Description |
| Time_UTC_CAPS | seconds | seconds since midnight |
| Nacc_CAPS | #/cm^3 | particle number concentration at 1013.25 hPa and 273.15 K |
| Ncoa1_CAPS | #/cm^3 | particle number concentration at 1013.25 hPa and 273.15 K |
| Ncoa2_CAPS | #/cm^3 | particle number concentration at 1013.25 hPa and 273.15 K |
| Ncoa3_CAPS | #/cm^3 | particle number concentration at 1013.25 hPa and 273.15 K |
| Ntot_CAPS | #/cm^3 | particle number concentration at 1013.25 hPa and 273.15 K |
| STP_Factor_CAPS | NA | factor used to convert data measured at ambient temperature and pressure to standard temperature and pressure of 273.15 K and 1013.25 hPa |
SDAerosol data type: Number concentration of dry (<40% RH) aerosol particles per cm3 per log10 diameter increment at 273.15K and 1013 hPa. Missing data are indicated by -9999.00.
Table 4: Variables in the data files SDAerosol_DC8_YYYYMMDD_RX.ict.
| Variable Name | Units | Description |
| Time_UTC_AMP | seconds | seconds since midnight |
| dNdlogDp_dry_1_AMP | #/cm^3 | number size distribution of dry particles in air per dlog10Dp for bin center amm sulf equivalent optical diameter at 2.7nm_AMP |
| dNdlogDp_dry_2_AMP | #/cm^3 | number size distribution of dry particles in air per dlog10Dp for bin center amm sulf equivalent optical diameter at 3nm_AMP |
| dNdlogDp_dry_3_AMP | #/cm^3 | number size distribution of dry particles in air per dlog10Dp for bin center amm sulf equivalent optical diameter at 3.4nm_AMP |
| dNdlogDp_dry_4_AMP | #/cm^3 | number size distribution of dry particles in air per dlog10Dp for bin center amm sulf equivalent optical diameter at 3.8nm_AMP |
| dNdlogDp_dry_5_AMP | #/cm^3 | number size distribution of dry particles in air per dlog10Dp for bin center amm sulf equivalent optical diameter at 4.2nm_AMP |
| dNdlogDp_dry_6_AMP | #/cm^3 | number size distribution of dry particles in air per dlog10Dp for bin center amm sulf equivalent optical diameter at 4.8nm_AMP |
| dNdlogDp_dry_7_AMP | #/cm^3 | number size distribution of dry particles in air per dlog10Dp for bin center amm sulf equivalent optical diameter at 5.3nm_AMP |
| dNdlogDp_dry_8_AMP | #/cm^3 | number size distribution of dry particles in air per dlog10Dp for bin center amm sulf equivalent optical diameter at 6nm_AMP |
| dNdlogDp_dry_9_AMP | #/cm^3 | number size distribution of dry particles in air per dlog10Dp for bin center amm sulf equivalent optical diameter at 6.7nm_AMP |
| dNdlogDp_dry_10_AMP | #/cm^3 | number size distribution of dry particles in air per dlog10Dp for bin center amm sulf equivalent optical diameter at 7.5nm_AMP |
| dNdlogDp_dry_11_AMP | #/cm^3 | number size distribution of dry particles in air per dlog10Dp for bin center amm sulf equivalent optical diameter at 8.5nm_AMP |
| dNdlogDp_dry_12_AMP | #/cm^3 | number size distribution of dry particles in air per dlog10Dp for bin center amm sulf equivalent optical diameter at 9.5nm_AMP |
| dNdlogDp_dry_13_AMP | #/cm^3 | number size distribution of dry particles in air per dlog10Dp for bin center amm sulf equivalent optical diameter at 10.6nm_AMP |
| dNdlogDp_dry_14_AMP | #/cm^3 | number size distribution of dry particles in air per dlog10Dp for bin center amm sulf equivalent optical diameter at 11.9nm_AMP |
| dNdlogDp_dry_15_AMP | #/cm^3 | number size distribution of dry particles in air per dlog10Dp for bin center amm sulf equivalent optical diameter at 13.4nm_AMP |
| dNdlogDp_dry_16_AMP | #/cm^3 | number size distribution of dry particles in air per dlog10Dp for bin center amm sulf equivalent optical diameter at 15nm_AMP |
| dNdlogDp_dry_17_AMP | #/cm^3 | number size distribution of dry particles in air per dlog10Dp for bin center amm sulf equivalent optical diameter at 16.9nm_AMP |
| dNdlogDp_dry_18_AMP | #/cm^3 | number size distribution of dry particles in air per dlog10Dp for bin center amm sulf equivalent optical diameter at 18.9nm_AMP |
| dNdlogDp_dry_19_AMP | #/cm^3 | number size distribution of dry particles in air per dlog10Dp for bin center amm sulf equivalent optical diameter at 21.2nm_AMP |
| dNdlogDp_dry_20_AMP | #/cm^3 | number size distribution of dry particles in air per dlog10Dp for bin center amm sulf equivalent optical diameter at 23.8nm_AMP |
| dNdlogDp_dry_21_AMP | #/cm^3 | number size distribution of dry particles in air per dlog10Dp for bin center amm sulf equivalent optical diameter at 26.7nm_AMP |
| dNdlogDp_dry_22_AMP | #/cm^3 | number size distribution of dry particles in air per dlog10Dp for bin center amm sulf equivalent optical diameter at 30nm_AMP |
| dNdlogDp_dry_23_AMP | #/cm^3 | number size distribution of dry particles in air per dlog10Dp for bin center amm sulf equivalent optical diameter at 33.7nm_AMP |
| dNdlogDp_dry_24_AMP | #/cm^3 | number size distribution of dry particles in air per dlog10Dp for bin center amm sulf equivalent optical diameter at 37.8nm_AMP |
| dNdlogDp_dry_25_AMP | #/cm^3 | number size distribution of dry particles in air per dlog10Dp for bin center amm sulf equivalent optical diameter at 42.4nm_AMP |
| dNdlogDp_dry_26_AMP | #/cm^3 | number size distribution of dry particles in air per dlog10Dp for bin center amm sulf equivalent optical diameter at 47.5nm_AMP |
| dNdlogDp_dry_27_AMP | #/cm^3 | number size distribution of dry particles in air per dlog10Dp for bin center amm sulf equivalent optical diameter at 53.3nm_AMP |
| dNdlogDp_dry_28_AMP | #/cm^3 | number size distribution of dry particles in air per dlog10Dp for bin center amm sulf equivalent optical diameter at 59.9nm_AMP |
| dNdlogDp_dry_29_AMP | #/cm^3 | number size distribution of dry particles in air per dlog10Dp for bin center amm sulf equivalent optical diameter at 67.2nm_AMP |
| dNdlogDp_dry_30_AMP | #/cm^3 | number size distribution of dry particles in air per dlog10Dp for bin center amm sulf equivalent optical diameter at 75.4nm_AMP |
| dNdlogDp_dry_31_AMP | #/cm^3 | number size distribution of dry particles in air per dlog10Dp for bin center amm sulf equivalent optical diameter at 84.6nm_AMP |
| dNdlogDp_dry_32_AMP | #/cm^3 | number size distribution of dry particles in air per dlog10Dp for bin center amm sulf equivalent optical diameter at 94.9nm_AMP |
| dNdlogDp_dry_33_AMP | #/cm^3 | number size distribution of dry particles in air per dlog10Dp for bin center amm sulf equivalent optical diameter at 106nm_AMP |
| dNdlogDp_dry_34_AMP | #/cm^3 | number size distribution of dry particles in air per dlog10Dp for bin center amm sulf equivalent optical diameter at 119nm_AMP |
| dNdlogDp_dry_35_AMP | #/cm^3 | number size distribution of dry particles in air per dlog10Dp for bin center amm sulf equivalent optical diameter at 134nm_AMP |
| dNdlogDp_dry_36_AMP | #/cm^3 | number size distribution of dry particles in air per dlog10Dp for bin center amm sulf equivalent optical diameter at 150nm_AMP |
| dNdlogDp_dry_37_AMP | #/cm^3 | number size distribution of dry particles in air per dlog10Dp for bin center amm sulf equivalent optical diameter at 169nm_AMP |
| dNdlogDp_dry_38_AMP | #/cm^3 | number size distribution of dry particles in air per dlog10Dp for bin center amm sulf equivalent optical diameter at 189nm_AMP |
| dNdlogDp_dry_39_AMP | #/cm^3 | number size distribution of dry particles in air per dlog10Dp for bin center amm sulf equivalent optical diameter at 212nm_AMP |
| dNdlogDp_dry_40_AMP | #/cm^3 | number size distribution of dry particles in air per dlog10Dp for bin center amm sulf equivalent optical diameter at 238nm_AMP |
| dNdlogDp_dry_41_AMP | #/cm^3 | number size distribution of dry particles in air per dlog10Dp for bin center amm sulf equivalent optical diameter at 267nm_AMP |
| dNdlogDp_dry_42_AMP | #/cm^3 | number size distribution of dry particles in air per dlog10Dp for bin center amm sulf equivalent optical diameter at 300nm_AMP |
| dNdlogDp_dry_43_AMP | #/cm^3 | number size distribution of dry particles in air per dlog10Dp for bin center amm sulf equivalent optical diameter at 337nm_AMP |
| dNdlogDp_dry_44_AMP | #/cm^3 | number size distribution of dry particles in air per dlog10Dp for bin center amm sulf equivalent optical diameter at 378nm_AMP |
| dNdlogDp_dry_45_AMP | #/cm^3 | number size distribution of dry particles in air per dlog10Dp for bin center amm sulf equivalent optical diameter at 424nm_AMP |
| dNdlogDp_dry_46_AMP | #/cm^3 | number size distribution of dry particles in air per dlog10Dp for bin center amm sulf equivalent optical diameter at 475nm_AMP |
| dNdlogDp_dry_47_AMP | #/cm^3 | number size distribution of dry particles in air per dlog10Dp for bin center amm sulf equivalent optical diameter at 533nm_AMP |
| dNdlogDp_dry_48_AMP | #/cm^3 | number size distribution of dry particles in air per dlog10Dp for bin center amm sulf equivalent optical diameter at 599nm_AMP |
| dNdlogDp_dry_49_AMP | #/cm^3 | number size distribution of dry particles in air per dlog10Dp for bin center amm sulf equivalent optical diameter at 672nm_AMP |
| dNdlogDp_dry_50_AMP | #/cm^3 | number size distribution of dry particles in air per dlog10Dp for bin center amm sulf equivalent optical diameter at 754nm_AMP |
| dNdlogDp_dry_51_AMP | #/cm^3 | number size distribution of dry particles in air per dlog10Dp for bin center amm sulf equivalent optical diameter at 846nm_AMP |
| dNdlogDp_dry_52_AMP | #/cm^3 | number size distribution of dry particles in air per dlog10Dp for bin center amm sulf equivalent optical diameter at 949nm_AMP |
| dNdlogDp_dry_53_AMP | #/cm^3 | number size distribution of dry particles in air per dlog10Dp for bin center amm sulf equivalent optical diameter at 1064nm_AMP |
| dNdlogDp_dry_54_AMP | #/cm^3 | number size distribution of dry particles in air per dlog10Dp for bin center amm sulf equivalent optical diameter at 1194nm_AMP |
| dNdlogDp_dry_55_AMP | #/cm^3 | number size distribution of dry particles in air per dlog10Dp for bin center amm sulf equivalent optical diameter at 1340nm_AMP |
| dNdlogDp_dry_56_AMP | #/cm^3 | number size distribution of dry particles in air per dlog10Dp for bin center amm sulf equivalent optical diameter at 1504nm_AMP |
| dNdlogDp_dry_57_AMP | #/cm^3 | number size distribution of dry particles in air per dlog10Dp for bin center amm sulf equivalent optical diameter at 1687nm_AMP |
| dNdlogDp_dry_58_AMP | #/cm^3 | number size distribution of dry particles in air per dlog10Dp for bin center amm sulf equivalent optical diameter at 1893nm_AMP |
| dNdlogDp_dry_59_AMP | #/cm^3 | number size distribution of dry particles in air per dlog10Dp for bin center amm sulf equivalent optical diameter at 2124nm_AMP |
| dNdlogDp_dry_60_AMP | #/cm^3 | number size distribution of dry particles in air per dlog10Dp for bin center amm sulf equivalent optical diameter at 2383nm_AMP |
| dNdlogDp_dry_61_AMP | #/cm^3 | number size distribution of dry particles in air per dlog10Dp for bin center amm sulf equivalent optical diameter at 2674nm_AMP |
| dNdlogDp_dry_62_AMP | #/cm^3 | number size distribution of dry particles in air per dlog10Dp for bin center amm sulf equivalent optical diameter at 3000nm_AMP |
| dNdlogDp_dry_63_AMP | #/cm^3 | number size distribution of dry particles in air per dlog10Dp for bin center amm sulf equivalent optical diameter at 3366nm_AMP |
| dNdlogDp_dry_64_AMP | #/cm^3 | number size distribution of dry particles in air per dlog10Dp for bin center amm sulf equivalent optical diameter at 3777nm_AMP |
| dNdlogDp_dry_65_AMP | #/cm^3 | number size distribution of dry particles in air per dlog10Dp for bin center amm sulf equivalent optical diameter at 4238nm_AMP |
| dNdlogDp_dry_66_AMP | #/cm^3 | number size distribution of dry particles in air per dlog10Dp for bin center amm sulf equivalent optical diameter at 4755nm_AMP |
Application and Derivation
ATom builds the scientific foundation for mitigation of short-lived climate forcers, in particular methane (CH4), tropospheric ozone (O3), and Black Carbon aerosols (BC).
ATom Science Questions:
Tier 1
- What are chemical processes that control the short-lived climate forcing agents CH4, O3, and BC in the atmosphere? How is the chemical reactivity of the atmosphere on a global scale affected by anthropogenic emissions? How can we improve chemistry-climate modeling of these processes?
Tier 2
- Over large, remote regions, what are the distributions of BC and other aerosols important as short-lived climate forcers? What are the sources of new particles? How rapidly do aerosols grow to CCN-active sizes? How well are these processes represented in models?
- What type of variability and spatial gradients occur over remote ocean regions for greenhouse gases (GHGs) and ozone depleting substances (ODSs)? How do the variations among air parcels help identify anthropogenic influences on photochemical reactivity, validate satellite data for these gases, and refine knowledge of sources and sinks?
Significance
ATom delivers unique data and analysis to address the Science Mission Directorate objectives of acquiring “datasets that identify and characterize important phenomena in the changing Earth system” and “measurements that address weaknesses in current Earth system models leading to improvement in modeling capabilities.” ATom will provide unprecedented challenges to the CCMs used as policy tools for climate change assessments, with comprehensive data on atmospheric chemical reactivity at global scales, and will work closely with modeling teams to translate ATom data to better, more reliable CCMs. ATom provides extraordinary validation data for remote sensing.
Quality Assessment
Uncertainty varies with the particle size distribution. For 10s averages in the clean free troposphere, typical systematic uncertainties for the accumulation mode are: number ±3.9%; surface +8%/-18%; volume +12%/-28%. Random uncertainties are ±15% for all three parameters. Detailed information on uncertainties and data quality evaluation, including comparisons between multiple instruments, are in Brock et al. (2019).
Data Acquisition, Materials, and Methods
Project Overview:
ATom makes global-scale measurements of the chemistry of the atmosphere using the NASA DC-8 aircraft. Flights span the Pacific and Atlantic Oceans, nearly pole-to-pole, in continuous profiling mode, covering remote regions that receive long-range inputs of pollution from expanding industrial economies. The payload has proven instruments for in situ measurements of reactive and long-lived gases, diagnostic chemical tracers, and aerosol size, number, and composition, plus spectrally resolved solar radiation and meteorological parameters.
Combining distributions of aerosols and reactive gases with long-lived GHGs and ODSs enables disentangling of the processes that regulate atmospheric chemistry: emissions, transport, cloud processes, and chemical transformations. ATom analyzes measurements using customized modeling tools to derive daily averaged chemical rates for key atmospheric processes and to critically evaluate Chemistry-Climate Models (CCMs). ATom also differentiates between hypotheses for the formation and growth of aerosols over the remote oceans.
Aerosol Microphysical Properties Instruments:
| Instrument | Full Name | Contact Person | Type | Measurements |
|---|---|---|---|---|
| AMP | In Situ Measurements of Aerosol Microphysical Properties | Charles Brock | Spectrometer (in situ) | Dry aerosol particle size distribution |
Five instruments, two nucleation-mode aerosol size spectrometers (NMASS; Williamson et al., 2018), two ultra-high sensitivity aerosol spectrometers (UHSAS; Kupc et al., 2018), and a laser aerosol spectrometer (LAS) comprise the AMP package. The AMP package provides particle size distributions with up to one-second time resolution for dry aerosol particles between 0.003 and 4.8 µm in diameter. Details of methods, uncertainties, and data products from the AMP package are in Brock et al. (2019). During ATom, the instruments were used to investigate how particles in the remote atmosphere influence climate by examining the origin of small particles in the remote atmosphere and their growth to sizes where they can affect clouds and the sources, characteristics, and distribution of soil dust and sea-spray particles, and 3) the importance long-range transport from human and natural sources on background aerosol properties.
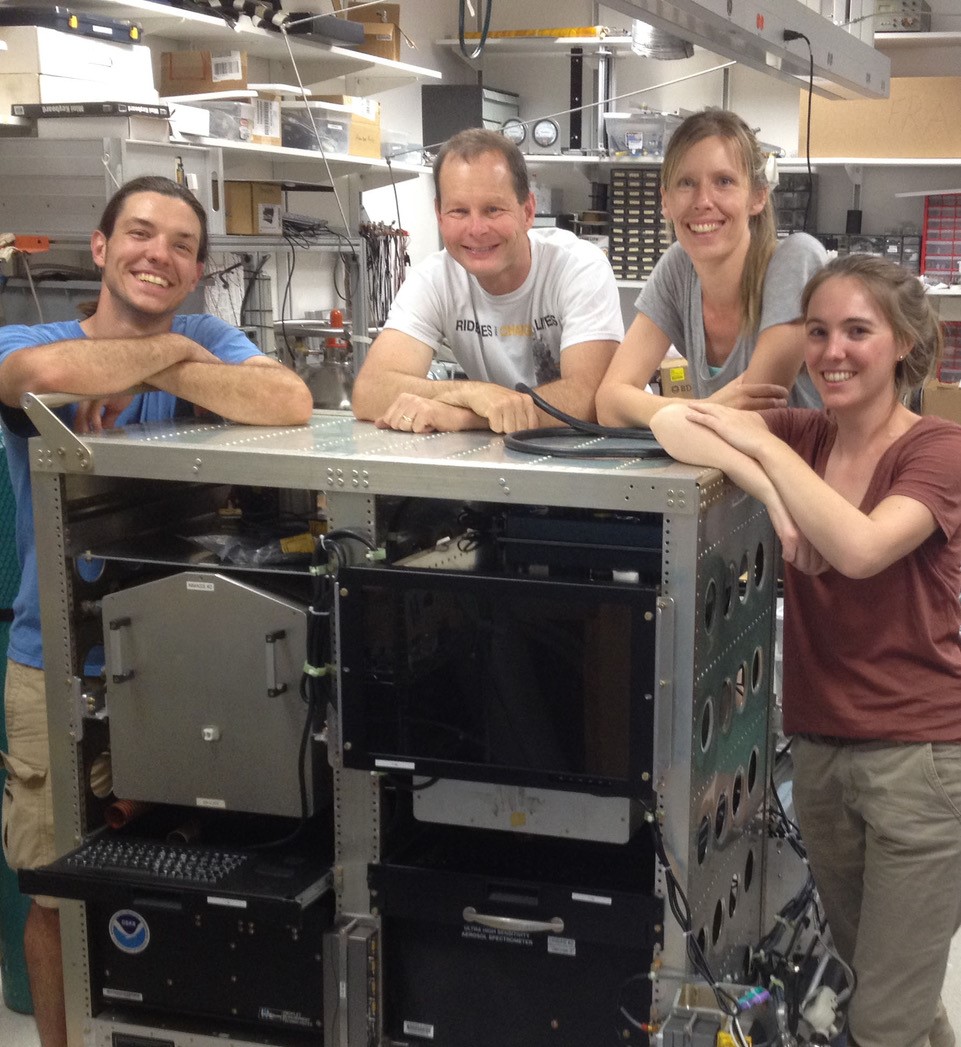
Figure 2: The AMP instrument package.
Data Access
These data are available through the Oak Ridge National Laboratory (ORNL) Distributed Active Archive Center (DAAC).
ATom: L2 In Situ Measurements of Aerosol Microphysical Properties (AMP)
Contact for Data Center Access Information:
- E-mail: uso@daac.ornl.gov
- Telephone: +1 (865) 241-3952
References
Brock, C. A., Williamson, C., Kupc, A., Froyd, K., Erdesz, F., Wagner, N., Richardson, M., Schwarz, J. P., Gao, R.-S., Katich, J. M., Campuzano-Jost, P., Nault, B. A., Schroder, J. C., Jimenez, J. L., Weinzierl, B., Dollner, M., Bui, T. P., and Murphy, D. M.: Aerosol size distributions during the Atmospheric Tomography (ATom) mission: methods, uncertainties, and data products, Atmos. Meas. Tech. Discuss., https://doi.org/10.5194/amt-2019-44, in review, 2019.
Kupc, A., Williamson, C., Wagner, N. L., Richardson, M., and Brock, C. A.: Modification, calibration, and performance of the Ultra-High Sensitivity Aerosol Spectrometer for particle size distribution and volatility measurements during the Atmospheric Tomography Mission (ATom) airborne campaign, Atmos. Meas. Tech., 11, 369-383, https://doi.org/10.5194/amt-11-369-2018, 2018.
Williamson, C., Kupc, A., Wilson, J., Gesler, D. W., Reeves, J. M., Erdesz, F., McLaughlin, R., and Brock, C. A.: Fast time response measurements of particle size distributions in the 3–60 nm size range with the nucleation mode aerosol size spectrometer, Atmos. Meas. Tech., 11, 3491-3509, https://doi.org/10.5194/amt-11-3491-2018, 2018.