Documentation Revision Date: 2019-11-07
Dataset Version: 1
Summary
The soil measurements were collected from established plots along two transects during 2012 and 2013 at 5.8 cm to 20 cm depths. Soil temperature was measured at approximately 5.8 cm. The DBH measurements were made during October 2012 for a variety of tree species. Hemispherical canopy photographs of each plot were also obtained.
There are two measurement data files in comma-separated format (.csv) with this dataset. There are six companion files with canopy photos taken at the plots (.zip).
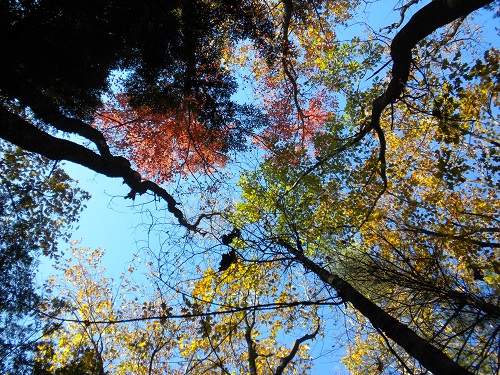
Figure 1.Canopy image taken at Harvard Forest, 2012-10-18, Transect 2, plot 56. Source: companion file Photos_2012-10-18.zip.
Citation
Cuenca, R., and Y. Hagimoto. 2019. AirMOSS: In Situ Soil Moisture and Tree Measurements, Harvard Forest, 2012-2013. ORNL DAAC, Oak Ridge, Tennessee, USA. https://doi.org/10.3334/ORNLDAAC/1677
Table of Contents
- Dataset Overview
- Data Characteristics
- Application and Derivation
- Quality Assessment
- Data Acquisition, Materials, and Methods
- Data Access
- References
Dataset Overview
This dataset provides in situ measurements of soil temperature, moisture, conductivity, measured diameter of tree at breast height (DBH) and total height collected at the Harvard Forest, Petersham, Massachusetts, USA, during October 2012 and July - August 2013. These measurements were collected in support of the Airborne Microwave Observatory of Subcanopy and Subsurface (AirMOSS) project to validate root-zone soil measurements and carbon flux model estimates.
The soil measurements were collected from established plots along two transects during 2012 and 2013 at 5.8 cm to 20 cm depths. Soil temperature was measured at approximately 5.8 cm. The DBH measurements were made during October 2012 for a variety of tree species. Hemispherical canopy photographs of each plot were also obtained.
Project: Airborne Microwave Observatory of Subcanopy and Subsurface (AirMOSS)
The goal of NASA’s Airborne Microwave Observatory of Subcanopy and Subsurface (AirMOSS) investigation is to provide high-resolution observations of root-zone soil moisture over regions representative of the major North American climatic habitats (biomes), quantify the impact of variations in soil moisture on the estimation of regional carbon fluxes, and extrapolate the reduced-uncertainty estimates of regional carbon fluxes to the continental scale of North America.
- The AirMOSS campaign used an airborne ultra-high frequency synthetic aperture radar flown on a Gulfstream-III aircraft to derive estimates of soil moisture down to approximately 1.2 meters.
- Extensive ground, tower, and aircraft in-situ measurements were collected to validate root-zone soil measurements and carbon flux model estimates.
Related Datasets:
All AirMOSS data can be accessed at https://airmoss.ornl.gov or through the Soil Moisture Visualizer at https://daac.ornl.gov/soilmoisture/
Data Characteristics
Spatial Coverage: Harvard Forest, Massachusetts, USA
Spatial Resolution: Measurement were made in established 20 x 20 m plots along two transects.
Temporal Coverage: 2012-10-15 to 2013-08-22
Temporal Resolution: Measurements were collected on five different days
Study Area (coordinates in decimal degrees)
|
Site |
Westernmost Longitude |
Easternmost Longitude |
Northernmost Latitude |
Southernmost Latitude |
|---|---|---|---|---|
|
Harvard Forest, MA |
-72.184 |
-71.1755 |
42.54923 |
42.53611 |
Data File Information
There are two measurement data files in comma-separated format (.csv) with this dataset. There are six companion files with canopy photos taken at the plots (.zip).
AirMOSS_HarvardForest_SoilMoisture_2012-2013.csv: Soil moisture, temperature and conductivity measurements made along two transects at 0-5.8 cm to 0-20 cm depths. Measurements were not taken for every depth at every plot. Refer to Table 3 in Section five of this document for additional details.
Table 1. Variables in the data file AirMOSS_HarvardForest_SoilMoisture_2012-2013.csv
| Variable | Units | Description |
|---|---|---|
| sample_date | YYYY-MM-DD | Date of measurement |
| transect_id | Transect ID | |
| plot_id | Plot number | |
| sample | Sample number | |
| longitude | Decimal degrees | Longitude of plot |
| latitude | Decimal degrees | Latitude of plot |
| east | m | Plot easting |
| north | m | Plot northing |
| soil_temp | Degrees C | Soil temperature measurement at 5.8 cm depth |
| real_dielectric | Dielectric measurement at 5.8 cm depth | |
| conductivity | s/m | Soil conductivity at 5.8 cm depth |
| soil_moisture_xx | percent | Soil moisture measurements (%) where XX = 0-3.8, 0-5.8, 0-7.6, 0-12, and 0-20 cm depth. Measurements for each depth were not made at all plots and years |
| comments | Comments regarding the measurements, if any |
HarvardForest_dbh_ba_2012.csv: This file provides measurements made at eight plots along Transect 1 and at plot 4, Transect 2 for tree DBH and tree height (1-2 measurements for per plot) and species. Basal area measurements were also made at plot 4. All measurements are for 2012-10-15 and 2012-10-18.
Table 2. Variables in the data file HarvardForest_dbh_ba_2012.csv
| Variable | Units | Description |
|---|---|---|
| date | YYYY-MM-DD | Date of measurement |
| plot_id | Plot number | |
| longitude | Decimal degrees | Longitude of plot |
| latitude | Decimal degrees | Latitude of plot |
| height | m | Height of representative tree at plot |
| dbh | cm | Diameter at breast height |
| species | Tree species or hardwood | |
| basal_area | cm | Basal area measurements made at plot 4, Transect 2, 2012-10-18 |
Companion Files
There are six .zip files with the hemispherical canopy photographs images taken at each plot along the transects in .jpg format. The zip files are named by dates corresponding to the data collection dates. The number of images per file varies. Example file name: Photos_2012-10-15.zip
Application and Derivation
Current estimates of Net Ecosystem Exchange (NEE) at regional and continental scales contain significant uncertainty. It has been shown that root-zone soil moisture (RZSM) content has a first-order effect on NEE. The objective of the AirMOSS project is to provide measurements to estimate RZSM using a P-band airborne radar. With the goal of producing a RMSE of 5 percent or less between the radar retrievals and the in situ soil water content data, the uncertainty in volumetric soil water content for regions monitored by the P-band radar will be reduced leading to reduced uncertainty in the carbon flux estimates for North America (Cuenca et al., 2015). These data were collected in support of the AirMOSS campaign.
Quality Assessment
Not provided.
Data Acquisition, Materials, and Methods
These data were collected in support of the AirMOSS campaign. For AirMOSS, NASA's Uninhabited Aerial Vehicle Synthetic Aperture Radar (UAVSAR) was flown on a Gulfstream-III aircraft, making frequent flights over the Harvard Forest and nine other sites in nine different biomes of North America over the course of four years. Harvard Forest is a temperate deciduous forest, elevation of 353 m.
Soil Moisture
Soil moisture data were collected at established 20 x 20 m plots along two transects specifically to monitor soil water content over a depth representative of that which would have an impact on the P-band radar signal. The table below provides the measurement methods and transect information.
Table 3. Soil moisture methods
|
Campaign ID |
Date |
Summary |
Lines of Transect |
|
1 |
2012-10-15 |
We measured soil water contents for one line (15 plots) of Transect #1. All variables were integrated average values from surface to the depth of 5.8 cm using a Stevens POGO portable soil sensor (vegetation measurements were also made at every other plot along this transect) |
1→10→19→28→37→46→55→64→73→82 →83→84→85→86→87 (Transect #1) |
|
2 |
2012-10-18 |
We measured soil water contents for four lines (36 plots) of Transect #2. All variables were integrated average values from surface to the depth of 5.8 cm using a Stevens POGO portable soil sensor (vegetation measurements were also made at plot 4) |
1→10→19→28→37→46→55→64→73 (Transect #2) 2→11→20→29→38→47→56→65→74 (Transect #2) 3→12→21→30→39→48→57→66→75 (Transect #2) 4→13→22→31→40→49→58→67→76 (Transect #2) |
|
3 |
2013-07-10 |
We measured soil water contents for two lines (18 plots) of Transect #2. Soil moisture was measured at two profiles at each plot: 0~5.8 cm using the Stevens POGO portable soil sensor and 0~12 cm using the Fieldscout TDR 300 soil moisture meter. For a subset of plots, we measured soil moisture for two additional profiles using the Fieldscout TDR 300 soil moisture meter: 0~3.8 cm and 0~7.6 cm |
1→10→19→28→37→46→55→64→73 (Transect #2) 2→11→20→29→38→47→56→65→74 (Transect #2) |
|
4 |
2013-07-12 |
We measured soil water contents for one line (9 plots) of Transect #2. Soil moisture was measured at two profiles at each plot: 0~5.8 cm using the Stevens POGO portable soil sensor and 0~12 cm using the Fieldscout TDR 300 soil moisture meter. For a subset of plots, we measured soil moisture for two additional profiles using the Fieldscout TDR 300 soil moisture meter: 0~3.8 cm and 0~7.6 cm |
3→12→21→30→39→48→57→66→75 (Transect #2) |
|
5 |
2013-08-19 |
We measured soil water contents for one and half lines (12 plots) of Transect #2. Soil moisture was measured at three profiles at each plot: 0~5.8 cm using the Stevens POGO portable soil sensor, and 0~7.6cm and 0~12 cm using the Fieldscout TDR 300 soil moisture meter |
1→10→19→28→37→46→55→64→73 (Transect #2) 74→65→56 (Transect #2) |
|
6 |
2013-08-22 |
We measured soil water contents for one and half lines (14 plots) of Transect #2. Soil moisture was measured at three profiles at each plot: 0~5.8 cm using the Stevens POGO portable soil sensor, and 0~7.6cm and 0~12 cm using the Fieldscout TDR 300 soil moisture meter |
1→10→19→28→37→46→55→64→73 (Transect #2) 74→65→56→47→38 (Transect #2) |
Refer to Cuenca et al. 2015 for additional information, and to the related dataset (Hagimoto et al. 2016) available at the ORNL DAAC.
Vegetation Measurements
DBH measurements were made at the same 20 x 20 m2 plots as the soil measurements on October 15, 2012 along Transect 1 at every other plot, and Transect 2, plot 4, on October 18, 2012 (campaigns 1 and 2 in the above soil moisture descriptions). Tree species was recorded. Height was measured for 1-2 representative individuals per plot. Basal area measurements were also made at plot 4 only.
Data Access
These data are available through the Oak Ridge National Laboratory (ORNL) Distributed Active Archive Center (DAAC).
AirMOSS: In Situ Soil Moisture and Tree Measurements, Harvard Forest, 2012-2013
Contact for Data Center Access Information:
- E-mail: uso@daac.ornl.gov
- Telephone: +1 (865) 241-3952
References
Cuenca, R.H., Y. Hagimoto, T.M. Ring, and J.P. Beamer. 2015. Interpretation of in situ observations in support of P-band radar retrievals. Geoscience and Remote Sensing Symposium (IGARSS), 2015 IEEE International. 5083-5086. http://dx.doi.org/10.1109/IGARSS.2015.7326976
Hagimoto, Y., R. Cuenca, and AirMOSS Science Team. 2016. AirMOSS: L2 Hourly In-Ground Soil Moisture at AirMOSS Sites, 2011-2015. ORNL DAAC, Oak Ridge, Tennessee, USA. https://doi.org/10.3334/ORNLDAAC/1416