Documentation Revision Date: 2018-12-19
Data Set Version: 1
Summary
SAR tomography is an extension of conventional SAR imaging techniques in which a scene is acquired multiple times from slightly different vantage points. After appropriate calibration and processing, the set of images can be coherently combined to determine the radar backscatter at arbitrary points within a 3D volume of space. Three dimensional radar backscatter maps were produced for both sites. Tomographic techniques were applied to the radar measurements in order to refocus the stack of images at various height planes throughout the canopy.
There are 18 data files in HDF5 format included in this dataset. Two KMLs providing the spatial coverage of the radar imagery are included as companion files.
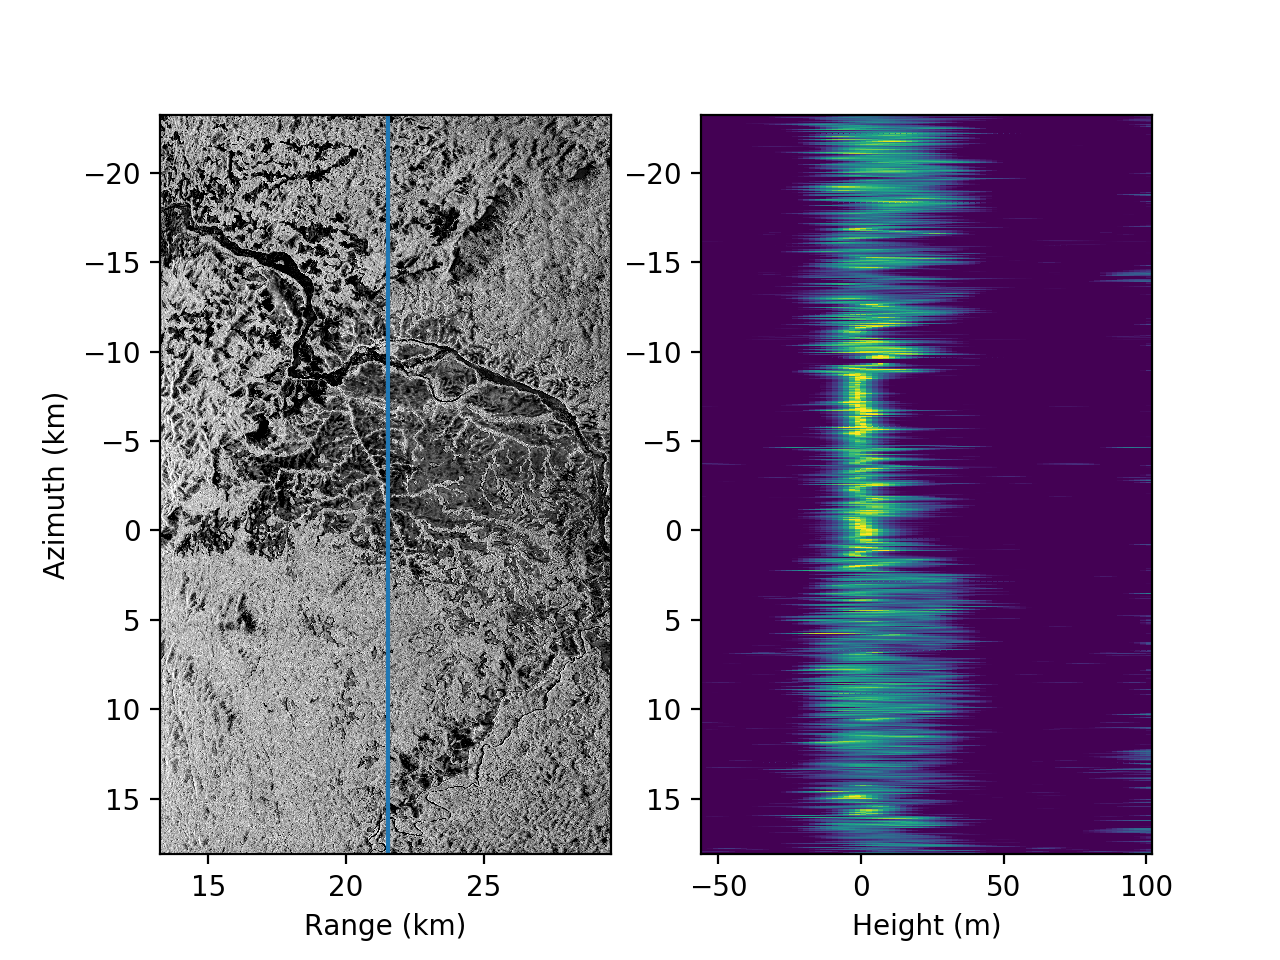
Figure 1. Tomographic image of Lope National Park focused to z=0 (left) and the height profile (right) for the slice marked by the blue line. Note the contrast between dark areas dominated by surface scattering and the bright areas with scattering through the forest canopy.
Citation
Hawkins, B.P., N. Pinto, M. Lavalle, and S. Hensley. 2018. AfriSAR: Polarimetric Height Profiles by TomoSAR, Lope and Rabi Forests, Gabon, 2016. ORNL DAAC, Oak Ridge, Tennessee, USA. https://doi.org/10.3334/ORNLDAAC/1577
Table of Contents
- Data Set Overview
- Data Characteristics
- Application and Derivation
- Quality Assessment
- Data Acquisition, Materials, and Methods
- Data Access
- References
Data Set Overview
This dataset provides height profiles derived from UAVSAR (Uninhabited Aerial Vehicle Synthetic Aperture Radar; JPL) data acquired over Lope National Park and Rabi Forest in Gabon as part of the AfriSAR campaign in 2016. These data were produced using synthetic aperture radar tomography (TomoSAR), a method that reveals three-dimensional forest structures by extending the conventional two-dimensional imaging capabilities of radars using multiple images acquired from slightly different antenna positions. AfriSAR was an airborne campaign that collected radar, lidar, and field measurements of forests in Gabon, West Africa as part of a collaborative mission between NASA, the European Space Agency, and the Gabonese Space Agency. These data will help prepare for and calibrate current and upcoming spaceborne missions that aim to gauge the role of forests in Earth's carbon cycle, such as the Global Ecosystem Dynamics Investigation (GEDI).
SAR tomography is an extension of conventional SAR imaging techniques in which a scene is acquired multiple times from slightly different vantage points. After appropriate calibration and processing, the set of images can be coherently combined to determine the radar backscatter at arbitrary points within a 3D volume of space. Three dimensional radar backscatter maps were produced for both sites. Tomographic techniques were applied to the radar measurements in order to refocus the stack of images at various height planes throughout the canopy.
Project: AfriSAR
The AfriSAR mission was an airborne campaign that collected radar and field measurements of forests in Gabon, West Africa. The mission was a NASA collaboration with the European Space Agency (ESA) and the Gabonese Space Agency. During the 2016 AfriSAR campaign, NASA UAVSAR and LVIS instruments collected data that will be used to derive forest canopy height, structure, and topography. The AfriSAR data will help prepare for and calibrate current and upcoming spaceborne missions that aim to gauge the role of forests in Earth's carbon cycle.
Acknowledgement:
The work reported here was performed at the Jet Propulsion Laboratory, California Institute of Technology, under contract with the National Aeronautics and Space Administration.
Data Characteristics
Spatial Coverage: Lope National Park and Rabi Forest in Gabon
Spatial Resolution:
The postings of the data files are as follows:
- 15 m ground spacing
- 8 m height spacing in Fourier products
- 2 m height spacing in Capon products
The vertical resolution varies across the swath as illustrated in Figure 2.
Temporal Coverage:
The Lope data was acquired on February 25, 2016. The Rabi data was acquired on February 28, 2016. Each flight lasted approximately four hours.
Temporal Resolution:
Not applicable. The images acquired at different times were combined to solve for one 3D image. All data were acquired within a four hour window in the morning when winds were expected to be at a minimum to reduce temporal decorrelation impacts to the data.
Study Area: (These coordinates are the approximate locations of the study sites and may not match the extent of the data files. All latitude and longitude are given in decimal degrees.)
| Site | Northern Extent | Southern Extent | Western Extent | Eastern Extent |
|---|---|---|---|---|
| Lope National Park | 0.067 | -0.345 | 11.432 | 11.825 |
| Rabi Forest | -1.654 | -2.049 | 9.699 | 10.112 |
Data File Information
There are a total of 18 files in HDF version 5 (HDF5) format in this dataset. Each file contains a number of HDF5 attributes and datasets. The files describe their own contents, such as the names, dimensions, and binary format of each dataset.
They can be examined with standard HDF5 tools like h5ls, as shown below:
$ h5ls lope-tomo-fourier-hh.h5Azimuths Dataset {2872}
Heights Dataset {20}
Latitude Dataset {2872 , 1640}
Longitude Dataset {2872 , 1640}
Ranges Dataset {1640}
TerrainHeight Dataset {2872 , 1640}
Tomogram Dataset {20, 2872, 1640}
Tomographic Data Properties
Two methods were used to generate tomographic data: (1) the Fourier beamformer was used to produce polarimetric data on an 8-m height grid and (2) the Capon beamforming method is a “super resolution” technique that was used to produce tomographic data on a 2-m height grid. There is a separate file for each polarimetric combination, e.g., HHHH, HHVV, etc.
Fourier beamforming method
The Fourier beamformer was used to produce polarimetric data on an 8-m height grid.
The stacks SLCs were refocused to various tomographic height planes and multilooked using spectral methods. The multilook window size is 6 pixels in range and 24 pixels in azimuth. Each H5 format file contains a 3D array of backscatter values on a regular grid of (azimuth, height, range) postings. There is a separate file for each polarimetric combination produced using the Fourier beamforming method.
Table 1. Data files produced using the Fourier beamforming method
| Site | Polarimetric combination | File |
|---|---|---|
| Lope National Park | HH | lope-tomo-fourier-hh.h5 |
| Lope National Park | HHHV | lope-tomo-fourier-hhhv.h5 |
| Lope National Park | HHVV | lope-tomo-fourier-hhvv.h5 |
| Lope National Park | HV | lope-tomo-fourier-hv.h5 |
| Lope National Park | HVVV | lope-tomo-fourier-hvvv.h5 |
| Lope National Park | VV | lope-tomo-fourier-vv.h5 |
| Rabi Forest | HH | rabi-tomo-fourier-hh.h5 |
| Rabi Forest | HHHV | rabi-tomo-fourier-hhhv.h5 |
| Rabi Forest | HHVV | rabi-tomo-fourier-hhvv.h5 |
| Rabi Forest | HV | rabi-tomo-fourier-hv.h5 |
| Rabi Forest | HVVV | rabi-tomo-fourier-hvvv.h5 |
| Rabi Forest | VV | rabi-tomo-fourier-vv.h5 |
Capon beamforming method
The Capon beamforming method is a “super resolution” technique that was used to produce tomographic data on a 2-m height grid. However, this method does not guarantee that relative calibration is preserved between polarimetric channels, so only a subset of the polarimetric data was processed in this manner (no phase information is provided. There is one file for each site that is produced on a finer height grid using the Capon beamforming method:
Table 2. Data files produced using the capon beamforming method
| Site | Polarimetric combination | File |
|---|---|---|
| Lope National Park | HH | lope-tomo-capon-hh.h5 |
| Lope National Park | HV | lope-tomo-capon-hv.h5 |
| Lope National Park | VV | lope-tomo-capon-vv.h5 |
| Rabi Forest | HH | rabi-tomo-capon-hh.h5 |
| Rabi Forest | HV | rabi-tomo-capon-hv.h5 |
| Rabi Forest | VV | rabi-tomo-capon-vv.h5 |
Data Structure
An overview of the datasets contained within each HDF5 file are listed in Table 3.
Tomogram (Heights, Azimuths, and Ranges) data
The data named Tomogram contains the backscatter data in the radar coordinate system, a quasi-cylindrical (this radar coordinate system is not a truly cylindrical system because the reference path (range=0) traces a circular arc of constant altitude instead of a straight line) system where range measures the distance of a target from the flight track and azimuth measures its position along track (Rosen et al. 2000). Specifically, the tomogram is an HxMxN array of radar backscatter values, where H is the height dimension, M is the azimuth dimension, and N is the range dimension.
These scales are provided in the HDF5 file as the Heights, Azimuths, and Ranges datasets. Note that the tomographic height scale is measured relative to the digital elevation model (DEM), which is derived from the Shuttle Radar Topography Mission (SRTM) and provided in the TerrainHeight dataset.
Latitude and Longitude data
Data for georeferencing are provided in the Latitude and Longitude data. With these lookup tables one can determine the location of a tomogram pixel (i,j,k) in radar coordinates:
Tomogram[i,j,k] → (r, s, h) = (Ranges[k], Azimuths[j], Heights[i] + TerrainHeight[j,k])Alternatively, the geographic coordinates of tomogram pixel (i,j,k) are approximately
Tomogram[i,j,k] → LLH = (Latitude[j,k], Longitude[j,k], Heights[i] + TerrainHeight[j,k])
Table 3. Data in each HDF5 data file.
| Dataset | Dimensions | Units |
|---|---|---|
| Azimuths | 1 (H) | meters |
| Heights | 1 (M) | meters |
| Ranges | 1 (N) | meters |
| Latitude | 1 (y) | degrees |
| Longitude | 1 (x) | degrees |
| TerrainHeight | 2 (y*x) | meters |
| Tomogram | 3 (H*M*N) |
HDF5 Attributes
Each file also contains a useful subset of metadata saved as HDF5 attributes, shown below in Table 4.
Table 4. Attributes contained within the HDF files
| Attribute | Units | Description |
|---|---|---|
| Altitude | m | Mean radar altitude above WGS84 ellipsoid |
| ElectronicSteeringAngle | degrees | Radar azimuth angle |
| Format | File format version | File format version |
| LooksAzimuth | Number of SLC azimuth samples per tomogram pixel | |
| LooksRange | Number of SLC range pixels per tomogram pixel | |
| PegHeading | degrees | Coordinate system heading |
| PegLatitude | degrees | Coordinate system center latitude |
| PegLongitude | degrees | Coordinate system center longitude |
| Pitch | degrees | Radar pitch angle |
| Yaw | degrees | Radar yaw angle |
| Wavelength | m | Radar wavelength |
Data Source Information
Full metadata are provided in the annotation files available on the UAVSAR web site (Table 5). These data are based on the single look complex (SLC) stack processed datasets available on the UAVSAR website. Please visit the UAVSAR website additional details about the source data.
Table 5. Source SLC stack processed datasets from UAVSAR
| Site | UAVSAR Data Portal URL -- registration required |
|---|---|
| Lope National Park | https://uavsar.jpl.nasa.gov/cgi-bin/product.pl?jobName=lopenp_TM140_03 |
| Rabi Forest | https://uavsar.jpl.nasa.gov/cgi-bin/product.pl?jobName=rabifo_TM130_02 |
GDAL VRT for converting coordinate system
While the tomogram is provided in its natural radar coordinate system, the HDF5 files can be converted to any convenient coordinate system using a GDAL VRT (Virtual Format file; .vrt) file. VRT files is a format driver for GDAL that allows a virtual GDAL dataset to be composed from other spatial data types. More information about the VRT format can be found at https://www.gdal.org/gdal_vrttut.html. An example VRT file is provided below for lope-tomo-capon-hh.h5:
<VRTDataset rasterXSize="1640" rasterYSize="2872">

    <Metadata domain="GEOLOCATION">

        <MDI key="LINE_OFFSET">0</MDI>

        <MDI key="LINE_STEP">1</MDI>

        <MDI key="PIXEL_OFFSET">0</MDI>

        <MDI key="PIXEL_STEP">1</MDI>

        <MDI key="X_BAND">1</MDI>

        <MDI key="X_DATASET">HDF5:"lope-tomo-capon-hh.h5"://Longitude</MDI>

        <MDI key="Y_BAND">1</MDI>

        <MDI key="Y_DATASET">HDF5:"lope-tomo-capon-hh.h5"://Latitude</MDI>

    </Metadata>

    <VRTRasterBand dataType="Float32" band="1">

        <Metadata>

            <MDI key="STATISTICS_MAXIMUM">2.3249223232269</MDI>

            <MDI key="STATISTICS_MEAN">0.010658995476696</MDI>

            <MDI key="STATISTICS_MINIMUM">-0.0081823449581861</MDI>

            <MDI key="STATISTICS_STDDEV">0.010889506415258</MDI>

        </Metadata>

        <SimpleSource>

            <SourceFilename relativeToVRT="0">HDF5:"lope-tomo-capon-hh.h5"://Tomogram</SourceFilename>

            <SourceBand>29</SourceBand>

            <SourceProperties RasterXSize="1640" RasterYSize="2872" DataType="Float32" BlockXSize="128" BlockYSize="128" />

        </SimpleSource>

    </VRTRasterBand>

</VRTDataset>
Only the first band of the HDF file is defined in the example above. After creating a VRT file in the same folder as the source HDF, use gdalwarp to create a georeferenced GeoTIFF containing the data in the first band:
$ gdalwarp -geoloc -t_srs EPSG:4326 -of GTiff lope-tomo-capon-hh.h5.vrt lope-tomo-capon-hh_band1.tifNote the use of the ‘‘-geoloc” option, which is essential for achieving reasonable geolocation accuracy. By default, the command above will output a single-band image corresponding to the slice through height=0. However, the VRT file is a simple text file that can be edited to include different or additional height layers.
Companion Files
Two KMLs providing the spatial coverage of the radar imagery are included as companion files:
- rabi_forest.kml
- lope_forest.kml
Application and Derivation
TomoSAR yield three-dimensional representations of forest vertical structure from two-dimensional radar data, enhancing researcher’s ability to study wildlife habitats and produce more accurate measurements of forest structure and carbon stocks. Figure 2 depicts a slice through the Lope tomographic dataset. Vertical resolution varies across the swath.
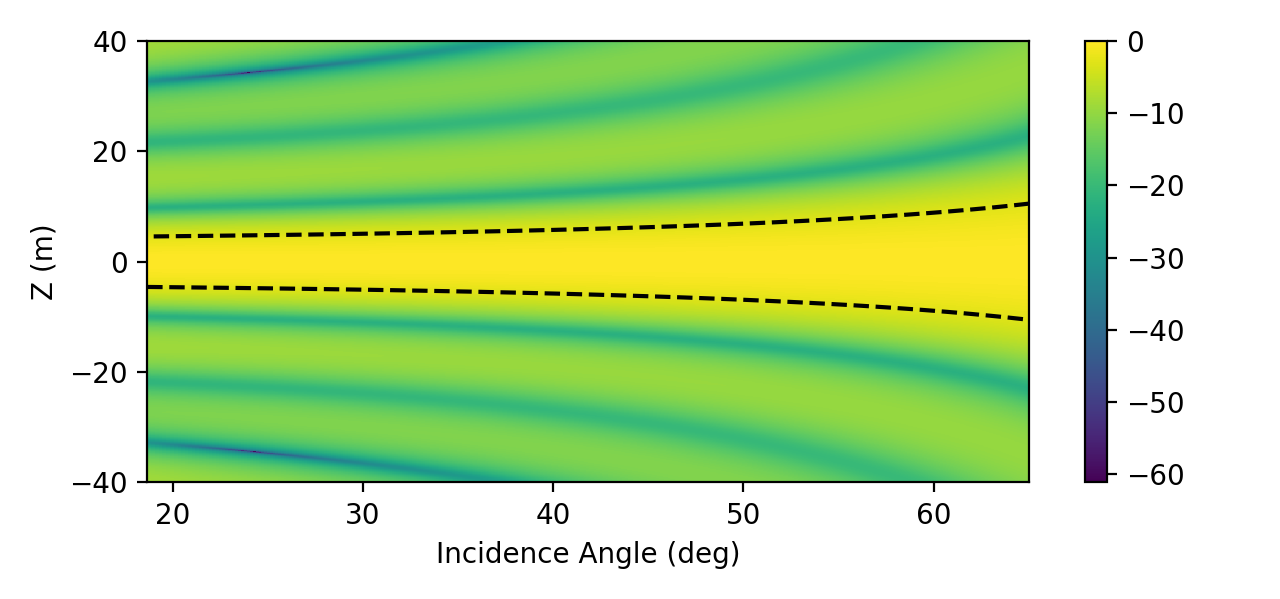
Figure 2. Point spread function of hypothetical targets at zero height (Z=0) for Lope baseline configuration and the Fourier beamforming method. The dotted line marks the resolution (3 dB contour).
Quality Assessment
Except where noted, performance characteristics should be commensurate with standard UAVSAR polarimetric data (Fore et al. 2015). The implementation of the Fourier beamformer used to produce this dataset introduces a scale factor proportional to the number of looks. As a consequence, there is a constant offset in the radiometric calibration of the Fourier data. However, relative radiometric calibration and polarimetric calibration are preserved in the Fourier data. The Capon beamformer uses local statistics for each pixel’s height spectrum, so radiometric calibration may not be preserved in the Capon data. Regarding geometric accuracy, the provided geolocation arrays (Latitude and Longitude HDF5 datasets) are most accurate (< 1 m) for targets on the DEM (e.g., Tomogram[i,...] where i satisfies Heights[i]=0). Other targets are displaced from their Latitude and Longitude grid cells in proportion to their height above the DEM as illustrated in Figure 3. If high geometric accuracy is desired, simply use the radar coordinate system.
Data Acquisition, Materials, and Methods
Study Sites
Gabon's forest is part of the Congolian tropical forests, altogether the second largest rainforest in the world after the Amazon. About 85 percent of the country's land is forested. The forests in Gabon are inhabited by a wide variety of plants and animals and are largely undisturbed by human activity. The Lope National Park contains extensive inland forest coverage with a wide range of forest canopy heights up to 50 m. The Rabi site is a 25-hectare permanent forest monitoring plot established as part of the Smithsonian Institution of Global Earth Observatories (SIGEO) world-wide network of forest plots. Close proximity to oil fields and commercial logging activity are a strain on biodiversity.
AfriSAR Flights
The UAVSAR L-band instrument was flown aboard NASA’s C-20A aircraft during February 2016 flights over study sites in Gabon. The flight tracks were flown at an altitude of 12.5 km and spanned a roughly 120-m vertical synthetic aperture.
TomoSAR Technique
Each flight line captures the radar backscatter projected onto its imaging plane. By varying the radar altitude between image acquisitions, we vary the angle of this projection and can therefore reconstruct the full height profile. Figure 3 demonstrates a slice through the Lope tomographic data set. These data were produced using synthetic aperture radar tomography (TomoSAR), a method that reveals three-dimensional forest structures by extending the conventional two-dimensional imaging capabilities of radars using multiple images acquired from slightly different antenna positions (Lavalle et al. 2017).
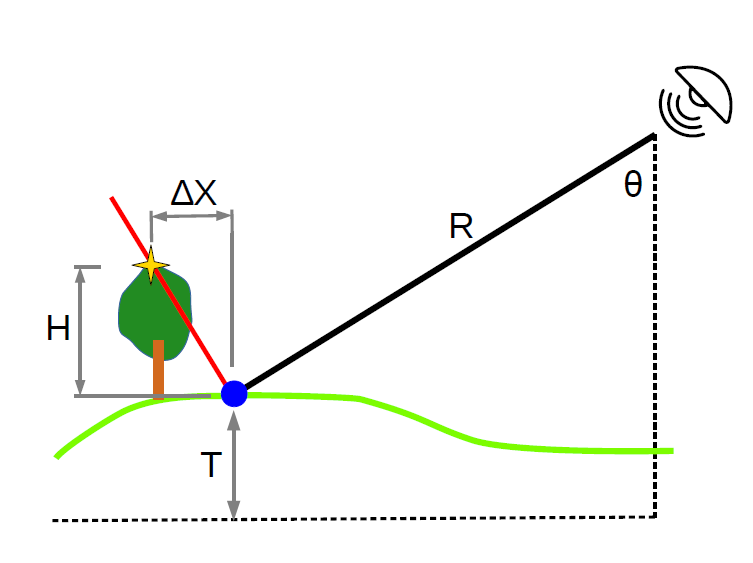
Figure 3. Radar geometry. The target Tomogram[i,j,k] shown by the yellow star is located at range coordinate R = Ranges[k]. Its azimuth coordinate is Azimuths[j]. Its height above the terrain (green line) is H = Heights[i]. The height of the terrain above the ellipsoid is T = TerrainHeight[j,k]. Other targets at the same range and azimuth coordinates are all located on the red line. The Latitude and Longitude coordinates are only given for points at H=0 on the terrain surface (blue dot). If the coordinates Latitude[j,k] and Longitude[j,k] are used to locate a target at H 6= 0, a planimetric error X = H/ tan will result.
The tomographic processing begins with the single look complex (SLC) data products generated by the standard UAVSAR stack processor, which includes a motion measurement error calibration step (Hensley et al. 2015). In order to further reduce relative phase errors between the images in a stack, a second motion measurement error calibration step is performed (Tebaldini et al. 2016). Finally, the phase calibrated SLC images are considered samples of the backscatter kz spectrum and the profiles are recovered either with a simple discrete time Fourier transform (Reigber and Moreira 2000) or the Capon method (Lombardini and Reigber 2003).
Data Access
These data are available through the Oak Ridge National Laboratory (ORNL) Distributed Active Archive Center (DAAC).
AfriSAR: Polarimetric Height Profiles by TomoSAR, Lope and Rabi Forests, Gabon, 2016
Contact for Data Center Access Information:
- E-mail: uso@daac.ornl.gov
- Telephone: +1 (865) 241-3952
References
A.G. Fore, B.D. Chapman, B.P. Hawkins, S. Hensley, C.E. Jones, T.R. Michel, and R.J. Muellerschoen. UAVSAR Polarimetric Calibration. IEEE Transactions on Geoscience and Remote Sensing, 53(6): 3481-3491. 10.1109/TGRS.2014.2377637
S. Hensley, T. Michel, M. Simard, C. Jones, R. Muellerschoen, C. Le, H. Zebker, and B. Chapman. Residual motion estimation for UAVSAR: Implications of an electronically scanned array. In 2009 IEEE Radar Conference, pages 1–5, May 2009. https://doi.org/10.1109/RADAR.2009.4977065
M. Lavalle, B. Hawkins and S. Hensley, "Tomographic imaging with UAVSAR: Current status and new results from the 2016 AfriSAR campaign," 2017 IEEE International Geoscience and Remote Sensing Symposium (IGARSS), Fort Worth, TX, 2017, pp. 2485-2488.
https://doi.org/10.1109/IGARSS.2017.8127498
F. Lombardini and A. Reigber. Adaptive spectral estimation for multibaseline SAR tomography with airborne L-band data. In 2003 IEEE International Geoscience and Remote Sensing Symposium, pages 2014–2016, 2003. https://doi.org/10.1109/IGARSS.2003.1294324
A. Reigber and A. Moreira. First demonstration of airborne SAR tomography using multibaseline L-band data. IEEE Transactions on Geoscience and Remote Sensing, 38(5):2142–2152, Sept 2000. https://doi.org/10.1109/36.868873
P. A. Rosen, S. Hensley, I. R. Joughin, F. K. Li, S. N. Madsen, E. Rodriguez, and R. M. Goldstein. Synthetic aperture radar interferometry. Proceedings of the IEEE, 88(3):333–382, March 2000. https://doi.org/10.1109/5.838084
S. Tebaldini, F. Rocca, M. Mariotti d’Alessandro, and L. Ferro-Famil. Phase calibration of airborne tomographic SAR data via phase center double localization. IEEE Transactions on Geoscience and Remote Sensing, 54(3):1775–1792, March 2016. https://dx.doi.org/10.1109/TGRS.2015.2488358