Documentation Revision Date: 2018-07-20
Data Set Version: 1
Summary
All products were generated with the prototype NISAR interferometric processor ISCE (Interferometric Software Computing Environment) and the PLAnT toolbox (Polarimetric-Interferometric Lab and Analysis Tool) starting from polarimetric SAR (PolSAR) single-look-complex (SLC) images. PolInSAR canopy height and uncertainty products were derived using an algorithm based on the random-volume-over-ground (RVoG) and structured-volume-over-ground (SVoG) models. Uncertainty layers were generated using a parallelized Metropolis-Hastings algorithm with adaptive tuning samples from the modeled probability distribution. Polarimetric Coherence TomoSAR (PCT) forest structure products were derived employing a Legendre polynomial expansion to solve for forest vertical profile.
There are 51 data files in GeoTIFF (.tif ) format with this dataset
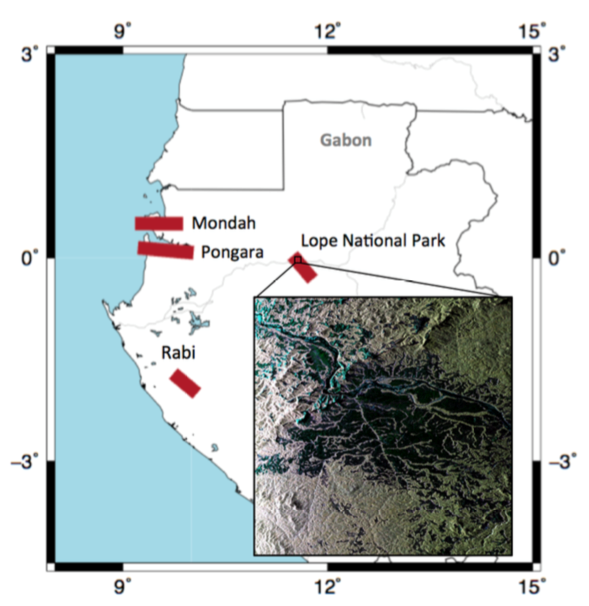
Figure 1. Sites where polarimetric-tomographic UAVSAR data were acquired during the 2016 AfriSAR airborne campaign. Red rectangles show the extension of the area covered by UAVSAR. The inset shows the RGB composition of the VV, HV and HH backscatter for a 225 km2 patch within the Lope National Park UAVSAR swath (Figure from Lavalle et al., 2017).
Citation
Lavalle, M., B.V. Riel, G. Shiroma, and B.P. Hawkins. 2018. AfriSAR: Canopy Structure Derived from PolInSAR and Coherence TomoSAR NISAR tools. ORNL DAAC, Oak Ridge, Tennessee, USA. https://doi.org/10.3334/ORNLDAAC/1601
Table of Contents
- Data Set Overview
- Data Characteristics
- Application and Derivation
- Quality Assessment
- Data Acquisition, Materials, and Methods
- Data Access
- References
Data Set Overview
The study sites for this product generation effort included Mondah, Rabi and Lope National Parks, Gabon (data from Pongara will be available in the near future). The areas contain extensive mangrove and inland forest coverage, and a wide range of forest canopy heights up to 50 m. This dataset contains forest vertical structure and associated uncertainty products derived by applying multi-baseline Polarimetric Interferometric Synthetic Aperture Radar (PolInSAR) and Polarimetric Coherence Tomographic SAR (PCT or PC-TomoSAR) techniques. The data were collected from multiple repeat-pass flights over Gabonese forests using the Uninhabited Aerial Vehicle Synthetic Aperture Radar (UAVSAR) instrument in February-March 2016. In addition, supplementary data products based on various intermediate parameters of the UAVSAR data are provided and include radar backscatter, coherence, and viewing and terrain geometry.
All products were generated with the prototype NISAR interferometric processor ISCE (Interferometric Software Computing Environment) and the PLAnT toolbox (Polarimetric-Interferometric Lab and Analysis Tool) starting from polarimetric SAR (PolSAR) single-look-complex (SLC) images that can be requested through the UAVSAR website. PolInSAR canopy height and uncertainty products were derived using an algorithm based on the random-volume-over-ground (RVoG) and structured-volume-over-ground (SVoG) models. Uncertainty layers were generated using a parallelized Metropolis-Hastings algorithm with adaptive tuning samples from the modeled probability distribution. Polarimetric Coherence TomoSAR (PCT) forest structure products were derived employing a Legendre function to solve for forest vertical profile.
Project: AfriSAR
AfriSAR was an airborne campaign that collected radar, lidar and field measurements of forests in Gabon, West Africa. The mission was a collaboration between NASA, the European Space Agency (ESA) and the Gabonese Space Agency. During the 2016 AfriSAR campaign, NASA UAVSAR and LVIS instruments collected data that are being used to derive forest canopy height, structure and topography. The AfriSAR data will help prepare for and calibrate current and upcoming spaceborne missions such as NISAR and BIOMASS that aim to gauge the role of forests in Earth’s carbon cycle.
Related Dataset:
Denbina, M., M. Simard, B.V. Riel, B.P. Hawkins, and N. Pinto. 2018. AfriSAR: Rainforest Canopy Height Derived from PolInSAR and Lidar Data, Gabon. ORNL DAAC, Oak Ridge, Tennessee, USA. https://doi.org/10.3334/ORNLDAAC/1589
Related Publications:
M. Lavalle, G. H. X. Shiroma, P. Agram, E. Gurrola, G. F. Sacco and P. Rosen, "Plant: Polarimetric-interferometric Lab and Analysis Tools for ecosystem and land-cover science and applications," 2016 IEEE International Geoscience and Remote Sensing Symposium (IGARSS), Beijing, 2016, pp. 5354-5357. doi: 10.1109/IGARSS.2016.7730395
Pourshamsi, M., M. Garcia, M. Lavalle, and H. Balzter, “A machine learning approach to PolInSAR and lidar fusion for improved forest canopy height estimation using NASA AfriSAR campaign data,” accepted for publication in IEEE Journal of Selected Topics in Applied Earth Observations and Remote Sensing, Special Issue, 2017.
Riel, B., M. Denbina, and M. Lavalle, “Assessing uncertainties of forest height estimation from polarimetric interferometric SAR data,” accepted for publication in IEEE Journal of Selected Topics in Applied Earth Observations and Remote Sensing, Special Issue, 2017.
Acknowledgements:
This work was conducted at the Jet Propulsion Laboratory, California Institute of Technology, under contract with the National Aeronautics and Space Administration.
Data Characteristics
Spatial Coverage: Three sites: Mondah, Rabi and Lope National Parks, Gabon (data from Pongara will be available in the near future)
Spatial Resolution: 1 arc second (approx. 30 m) pixel spacing matching the SRTM DEM
Temporal Coverage: 2016-02-25 to 2016-03-08
Temporal Resolution: Once
Table 1. Study Area (coordinates in decimal degrees)
| Site | Westernmost Longitude | Easternmost Longitude | Northernmost Latitude | Southernmost Latitude |
|---|---|---|---|---|
| Lope, Mondah, and Rabi National Parks, Gabon | 9.169444444 | 11.86416667 | 0.61 | -2.067777778 |
Table 2. Coordinates of the three individual sites.
| Site | Western Extent | Eastern Extent | Northern Extent | Southern Extent |
|---|---|---|---|---|
| Lope National Park, Gabon | 11.40666667 | 11.86417 | 0.084722222 | -0.372777778 |
| Mondah National Park, Gabon | 9.169444444 | 9.881111111 | 0.6011060 | 0.406666667 |
| Rabi National Park, Gabon | 9.6777778 | 10.13555556 | -1.626944444 | -2.0677778 |
Data File Information
The dataset is composed of 51 data files in GeoTIFF (.tif) format. Each of the three sites has 17 data files (17 x 3 = 51). This includes canopy height, uncertainty and structure as well as supplemental data files used to derive canopy height and support biomass estimation. The supplementary data products are based on various intermediate parameters of the ISCE/PLAnT data processing and include radar backscatter, coherence, and terrain geometry.
Table 3. File names and descriptions
Note that SITE refers to Monda, Rabi, and Lope.
| File names | Units | Descriptions |
|---|---|---|
| Products below are derived from multi-baseline polarimetric interferometry technique |
|
|
| SITE_polinsar_canopy_height.tif | meters | The canopy height hv is the average tree height in meters estimated via PolInSAR technique within the multi-looked radar resolution cell estimated by an algorithm based on the random-volume-over-ground (RVoG) model. It includes the effects of temporal decorrelation. It is recommended to use this product in conjunction with its uncertainty and mask products described below. |
| SITE_polinsar_canopy_height _uncertainty.tif | meters | The canopy height uncertainty product represents the standard deviation in meters of the canopy height product hv described above. |
| SITE_polinsar_canopy_coherence.tif | none | The canopy coherence γv is the interferometric complex coherence of the canopy-dominated scattering mechanism. Coherence estimates from multiple baselines were merged into a single product after minimizing a cost function based on the mask products described below. Note that the ground phase has been already removed from this product. |
| SITE_polinsar_ground_coherence.tif | none | The ground coherence γg is the interferometric complex coherence of the ground-dominated scattering mechanism. Ground here means both soil direct and soil-trunk scattering. Coherence estimates from multiple baselines were merged into a single product after minimizing a cost function based on the mask products described below. The ground phase has been already removed from this product. |
| SITE_polinsar_mask_separation.tif | none | The mask coherence separation is the distance between γv and γg in the complex plane. |
| SITE_polinsar_mask_error.tif | meters | The mask coherence error is the Cramer-Rao bound of the standard deviation of the interferometric canopy coherence phase arg(γv) scaled by the merged vertical wavenumber kz. This product represents the precision of the canopy phase height estimates, which is related to the uncertainty of the tree height estimates. |
| SITE_polinsar_mask_location.tif | none | The mask coherence location is the Euclidean distance between the line passing through γg and γv in the complex plane and the origin of the axis. It represents the minimum coherence magnitude over the space of polarimetric scattering mechanisms. |
| SITE_polinsar_vertical_wavenumber.tif | rad/meters | The merged vertical interferometric wavenumber kz represents the vertical sensitivity of the interferometer. Its units are inverse of meter. It changes with incidence angle, local terrain slope, range distance and perpendicular baseline. |
|
The products below were derived using the coherence tomography technique |
||
| SITE_pct_coefficient_a10.tif | none | The coherence tomography first-order coefficient is the coefficient a10 of the Legendre polynomial expansion of the canopy coherence γv. It can be used to estimate the first- order vertical profile at a given elevation within the canopy. The coefficient tells how vegetation structure approximated by a linear function is vertically distributed. This coefficient was calculated using the products canopy height and Legendre functions f0, f1. |
| SITE_pct_coefficient_a20.tif | none | The coherence tomography second-order coefficient is the coefficient a20 of the Legendre polynomial expansion of the canopy coherence v. It tells how vegetation structure approximated by second-order function is vertically distributed. This coefficient has been calculated using the products canopy height and Legendre functions f0, f1 and f2 . |
| SITE_pctf0.tif | none | The zero-order Legendre function is the function f0 of the Legendre polynomial expansion of the canopy coherence. |
| SITE_pct_legendre_function_f1.tif | none | The first-order Legendre function is the function f1 of the Legendre expansion of the canopy coherence. |
| SITE_pct_legendre_function_f2.tif | none | The second-order Legendre function is the function f2 of the Legendre expansion of the canopy coherence. |
| Supplementary data products | ||
| SITE_cross_pol_backscatter.tif | dB | The average cross-polarimetric backscatter is the HV backscatter averaged (incoherently) over time for all available tracks for each site. No radiometric terrain correction has been applied to this product. This product is distributed either as gamma cross-section (Lope site) or as sigma cross-section with area projected on the flat ellipsoid (Rabi and Mondah sites). |
| SITE_local_incidence_angle.tif | degrees | The local incidence angle is the angle in degrees between the look vector from the target to radar and the normal to the local terrain. |
| SITE_terrain_slope_angle.tif | degrees | The terrain slope angle is the angle in degrees between the normal to the local ellipsoid and the normal to the local terrain along range. The 1-arcsec SRTMv3 was used to calculate the normal to the local terrain. |
| SITE_projection_angle.tif | degrees | The projection angle is the angle in degrees between the radar image plane and the normal to the local terrain. The 1-arcsec SRTMv3 was used to calculate the normal to the local terrain. |
Table 4. Properties of the .tif files
For all files: Map units are in degrees; No data value=-9999; # bands=1; scaling=1.
|
File name |
Min value |
Max value |
Mean |
|---|---|---|---|
| lope_cross_pol_backscatter.tif | -160.4 | 1.6 | -14.8 |
| lope_local_incidence_angle.tif | 6 | 122.3 | 50.4 |
| lope_pct_coefficient_a10.tif | -8 | 7.7 | 0 |
| lope_pct_coefficient_a20.tif | -0.9 | 370.7 | 15 |
| lope_pct_legendre_function_f0.tif | 0.1 | 0.9 | 0.6 |
| lope_pct_legendre_function_f1.tif | -0.4 | 0.2 | -0.3 |
| lope_pct_legendre_function_f2.tif | -0.2 | 0 | -0.1 |
| lope_polinsar_canopy_coherence.tif | -0.5 | 0.9 | 0.2 |
| lope_polinsar_canopy_height.tif | 0 | 91.6 | 26 |
| lope_polinsar_canopy_height_uncertainty.tif | 3.1 | 12 | 9.2 |
| lope_polinsar_ground_coherence.tif | -0.2 | 0.9 | 0.5 |
| lope_polinsar_mask_error.tif | 0 | 3.92E+08 | 521.9 |
| lope_polinsar_mask_location.tif | 0 | 0.9 | 0.3 |
| lope_polinsar_mask_separation.tif | 0 | 0.8 | 0.3 |
| lope_polinsar_vertical_wavenumber.tif | -3.3 | 4.5 | -0.1 |
| lope_projection_angle.tif | 1.2 | 86.2 | 40.6 |
| lope_terrain_slope_angle.tif | -48.8 | 82.9 | 1.3 |
| mondah_cross_pol_backscatter.tif | -58 | 0 | -21.5 |
| mondah_local_incidence_angle.tif | 8.8 | 91.3 | 49.9 |
| mondah_pct_coefficient_a10.tif | -9.3 | 8.2 | 0.1 |
| mondah_pct_coefficient_a20.tif | -0.7 | 564.3 | 20.6 |
| mondah_pct_legendre_function_f0.tif | 0.1 | 0.9 | 0.7 |
| mondah_pct_legendre_function_f1.tif | -0.4 | 0.4 | -0.1 |
| mondah_pct_legendre_function_f2.tif | -0.2 | 0 | 0 |
| mondah_polinsar_canopy_coherence.tif | -0.4 | 0.9 | 0.1 |
| mondah_polinsar_canopy_height.tif | 0 | 70.4 | 17.6 |
| mondah_polinsar_canopy_height_uncertainty.tif | 0 | 12 | 7.1 |
| mondah_polinsar_ground_coherence.tif | 0 | 0.9 | 0.4 |
| mondah_polinsar_mask_error.tif | 0 | 237773.2 | 1.4 |
| mondah_polinsar_mask_location.tif | 0 | 0.9 | 0.4 |
| mondah_polinsar_mask_separation.tif | 0 | 1 | 0.2 |
| mondah_polinsar_vertical_wavenumber.tif | -1000.2 | 580.8 | 0 |
| mondah_projection_angle.tif | 2.5 | 81.5 | 40.3 |
| mondah_terrain_slope_angle.tif | -31.2 | 70.7 | 0.2 |
| rabi_cross_pol_backscatter.tif | -58 | -5.7 | -14.5 |
| rabi_local_incidence_angle.tif | 9.4 | 93.1 | 50 |
| rabi_pct_coefficient_a10.tif | -4.5 | 3.6 | 0 |
| rabi_pct_coefficient_a20.tif | -0.6 | 139.3 | 5.4 |
| rabi_pct_legendre_function_f0.tif | 0.1 | 0.9 | 0.5 |
| rabi_pct_legendre_function_f1.tif | -0.4 | 0 | -0.3 |
| rabi_pct_legendre_function_f2.tif | -0.2 | 0 | -0.1 |
| rabi_polinsar_canopy_coherence.tif | -0.4 | 0.8 | 0 |
| rabi_polinsar_canopy_height.tif | 0 | 79.6 | 25.5 |
| rabi_polinsar_canopy_height_uncertainty.tif | 2.2 | 12 | 5.8 |
| rabi_polinsar_ground_coherence.tif | 0 | 0.9 | 0.4 |
| rabi_polinsar_mask_error.tif | 0 | 3.05E+09 | 7999.8 |
| rabi_polinsar_mask_location.tif | 0 | 0.9 | 0.1 |
| rabi_polinsar_mask_separation.tif | 0 | 0.8 | 0.4 |
| rabi_polinsar_vertical_wavenumber.tif | -1.4 | 0 | -0.1 |
| rabi_projection_angle.tif | 2.5 | 81.3 | 40.5 |
| rabi_terrain_slope_angle.tif | -31.1 | 69.2 | 0.6 |
Spatial information common to all files:
GEOGCS['WGS 84', DATUM['WGS_1984'
SPHEROID ['WGS 84',6378137,298.257223563
AUTHORITY['EPSG','7030']]
AUTHORITY['EPSG','6326']]
PRIMEM['Greenwich',0]
UNIT['degree',0.0174532925199433]
AUTHORITY['EPSG','4326']])
Companion files
There are two companion files with this dataset:
AfriSAR_PolInSARWorkshop_Lavalle.pdf: A workshop presentation on the UAVSAR AfriSAR Campaign. This provides additional details on instrumentation, flights, and UAVSAR.
Polarimetric_CT.pdf: This guide document in .pdf format.
Application and Derivation
Canopy height and vertical structure products from African tropical rain forests will help parameterize models of carbon storage in a previously-understudied region. This information can also inform policymakers working on climate mitigation and forest conservation policies.
Quality Assessment
Canopy height uncertainty products are included with this dataset and represent the standard deviation in meters of the canopy height. A probabilistic approach was used to represent the distribution of possible canopy parameter values using the Bayesian Theorem. A parallelized Metropolis-Hastings algorithm with adaptive tuning samples from the modeled probability distribution was used to produce the uncertainty estimates.
Data Acquisition, Materials, and Methods
The study sites included Mondah, Rabi and Lope National Parks, Gabon. The study areas contain extensive mangrove and inland forest coverage, and a wide range of forest canopy heights up to 50 m.
The table below shows the number of flights for each site used to generate the PolInSAR and Polarization Coherence TomoSAR products. The site of Mondah was imaged by several UAVSAR flights resulting in a larger number of zero and long interferometric baselines. The sites of Lope and Rabi have different soil and vegetation characteristics compared to Mondah and feature stronger topographic variations as well as a wider range of biomass values. The UAVSAR flights over Rabi and Mondah were designed to allow for denser multi-baseline stacks with short time intervals between each track in order to apply specifically multi-baseline PolInSAR and TomoSAR techniques.
Table 5. Flight numbers per site.
| Site | Number of flight tracks | Number of processed tracks | Number of long-baseline pairs |
|---|---|---|---|
| Lope National Park, Gabon | 7 | 21 | 21 |
| Mondah National Park, Gabon | 9 | 36 | 33 |
| Rabi National Park, Gabon | 10 | 45 | 45 |
The specific algorithms used to generate these products are detailed the publications listed below in the References section. Figure 2 summarizes the main steps of the processing chain based on the ISCE/PLAnT packages used to generate the PolInSAR and Polarization Coherence TomoSAR products.
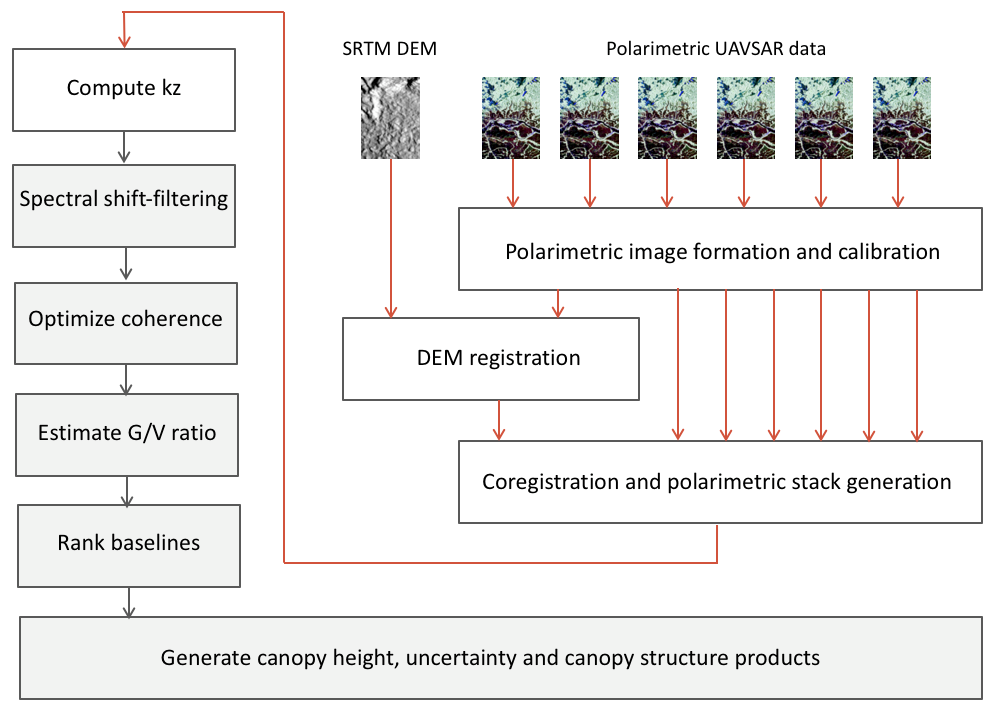
Figure 2. Diagram of the PolInSAR and Polarization Coherence TomoSAR processing (Lavalle et al., 2017).
Generation of the Data Products
Multi-baseline Polarimetric Interferometry Technique
Canopy height: Canopy height estimated by an algorithm based on the random-volume-over-ground (RVoG) model. Thus, it includes the effects
of temporal decorrelation. No lidar or field data were used to calibrate or constrain the inversion algorithm. The objective of this product was to assess a radar-only estimate of canopy height in order to understand the extent to which PolInSAR algorithms work on tropical African forests. AfriSAR sites Lope and Rabi have been imaged with short repeat intervals. Some flights over Mondah have longer repeat interval. The effect of water beneath mangroves was deliberately ignored in order to have a common basis for comparing all sites with the same algorithm. Note that the geometric effects of the slanted radar resolution cell were not corrected, which is important when comparing PolInSAR-derived heights with lidar-derived heights. It is recommended to use this product in conjunction with its uncertainty and mask products.
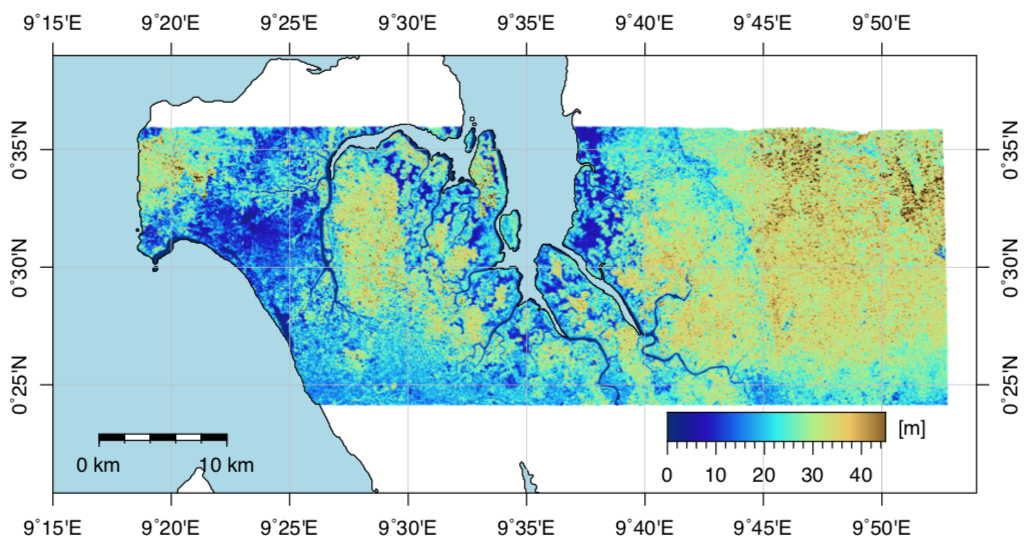
Figure 3. Canopy height product for the Mondah site generated using the ISCE/PLAnT processing chain.
Canopy height uncertainty: The standard deviation in meters of the canopy height product hv described above. A probabilistic approach was used to represent the distribution of possible canopy parameter values by using Bayes’ Theorem:
p (m|γ) ∝ p (γ|R(m), σγ) p (m) p (σγ)
where:
m is the vector of our canopy parameters,
γ is the vector of the observed coherences,
R(m) is the output of the RVoG model for a given m, and
σγ is the standard deviation of the observed coherences.
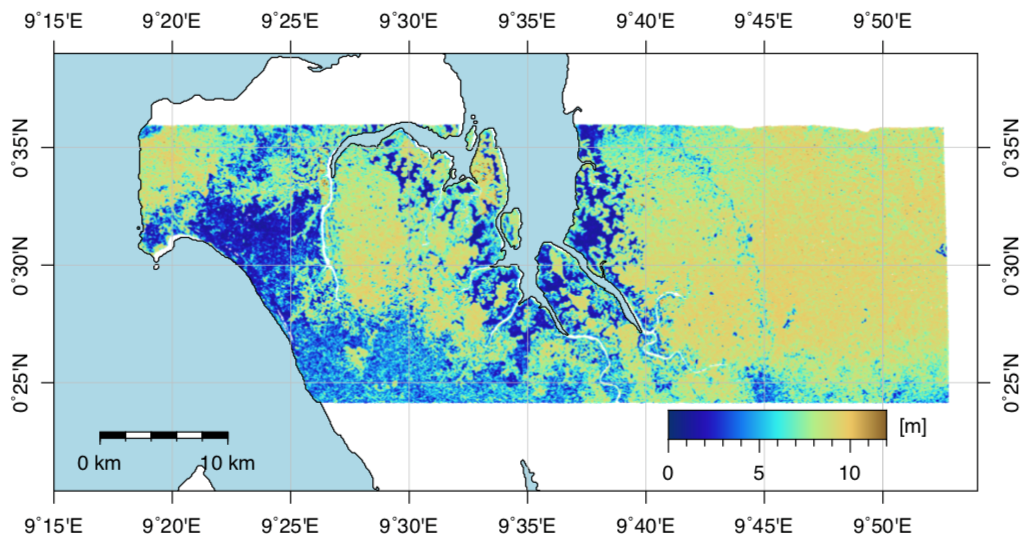
Figure 4. Canopy height uncertainty product for the Mondah site generated using the ISCE/PLAnT processing chain.
Canopy coherence: The canopy coherence γv was obtained by maximizing the distance between canopy- and ground-dominated coherences over the space of polarimetric scattering mechanisms. Coherence estimates from multiple baselines were merged in a single product after minimizing a cost function based on the mask products. The canopy coherence can be used to estimate canopy height with basic PolInSAR algorithms.
Ground coherence: The ground coherence was obtained by maximizing the distance between canopy- and ground-dominated coherences over the space of polarimetric scattering mechanisms. Coherence estimates from multiple baselines are merged in a single product after minimizing a cost function based on the mask products. The ground coherence is linked to the properties of both soil and canopy.
Mask coherence separation: The distance d = | γv - γg | between γv and γg in the complex plane. Large values of d are preferred in order for the ground phase estimation (achieved via RVoG line-circle intersection) to be robust against the effects of the noise. Bare ground and short vegetation tend to have a small d, although noise and temporal decorrelation can result in large values of d even for short vegetation. It is recommended to use this mask in conjunction with the canopy height product. This mask can be also used to find correlation between PolInSAR observables and ecological parameters.
Mask coherence error: The Cramer-Rao bound of the standard deviation of the interferometric canopy coherence phase arg(γv) scaled by the merged vertical wavenumber kz. This product represents the precision of the canopy phase height estimates, which is related to the uncertainty of the tree height estimates. It is recommended to use this product in conjunction with the canopy height product and external validation datasets. The mask is also useful to find correlation between the canopy height uncertainty product and the canopy phase standard deviation.
Mask coherence location: The Euclidean distance between the line passing through γg and γv in the complex plane and the origin of the axis. It represents the minimum coherence magnitude over the space of polarimetric scattering mechanisms. A very small value of coherence location (RVoG line near the origin) or very large value of coherence location (canopy and ground coherences close to each other) lead typically to larger canopy height estimation errors. It is recommended to use this mask in conjunction with the canopy height product. This mask can be also used to find correlation between PolInSAR observables and ecological parameters.
Merged vertical interferometric wavenumber: The vertical sensitivity of the interferometer, and changes with incidence angle, local terrain, slope, range distance and perpendicular base-line. For AfriSAR, the vertical wavenumber ranges typically from 0 m-1 to 0.6 m-1 across the set of interferometric baselines. The merged vertical wavenumber product is the vertical wavenumber of the baseline that has been selected in order to achieve good separation between γv and γg while keeping high the canopy coherence. Note that a wrong baseline selection may lead to large canopy height estimation error. As a rule of thumb, if a sample is expected to have short vegetation and the selected merged kz happens to be small, then it is possible that the optimum baseline selection failed (due for instance to speckle noise or mismatch between selection metric and forest structure). It is recommended to look at this product when comparing radar-derived canopy height with other data sources (e.g., lidar).
Coherence Tomography Products
Coherence tomography first-order coefficient: The coefficient a10 of the Legendre polynomial expansion of the canopy coherence γv. It can be used to estimate the first- order vertical profile f(z) at a given elevation z within the canopy, 0 < z < hv. The coefficient tells how vegetation structure approximated by a linear function is vertically distributed. This coefficient has been calculated using the products canopy height hv and Legendre functions f0, f1 . Values of a10 smaller than zero indicate scattering coming predominantly from the ground. It is recommended to use this product in conjunction with the PolInSAR mask products. Note that failure in the optimum multi-baseline selection will affect this product.
Coherence tomography second-order coefficient: The coefficient a20 of the Legendre polynomial expansion of the canopy coherence v. It tells how vegetation structure approximated by second-order function is vertically distributed. This coefficient has been calculated using the products canopy height hv and Legendre functions f0, f1 and f2. It can be used to estimate the second-order vertical profile f(z) for a given elevation z within the canopy, 0 < z < hv. Note that temporal decorrelation might affect this product significantly. It is recommended to use this product in conjunction with the PolInSAR coherence mask products. In case of large errors, using a first-order approximation for the vertical profile might lead to better results.
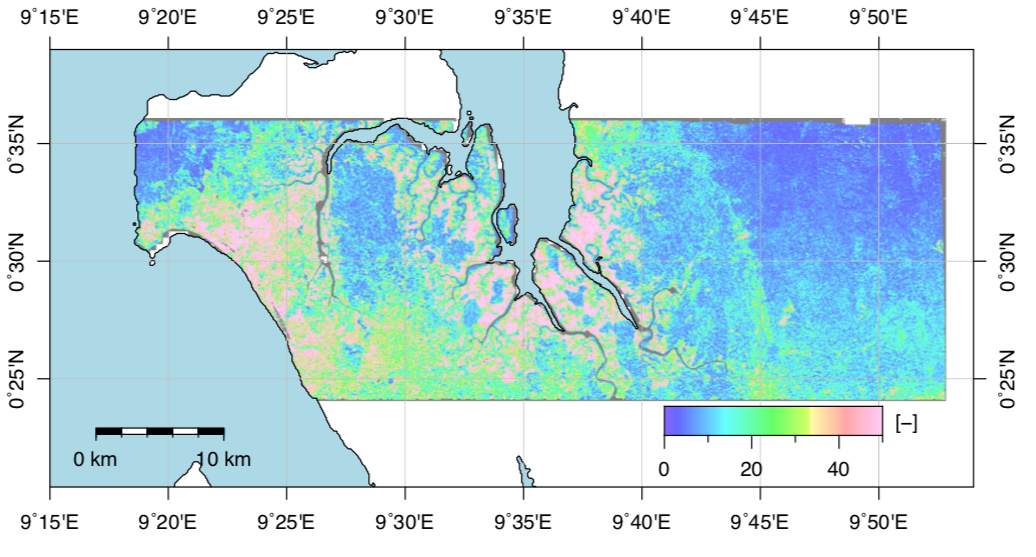
Figure 5. Second-order PC-TomoSAR Legendre coefficient for representing the vertical structure for the Mondah site generated using the ISCE/PLAnT processing chain.
Zero-order Legendre function: The function f0 of the Legendre polynomial expansion of the canopy coherence. In the zero-order expansion, the canopy coherence (after ground phase removal) is approximated by
γv ~ ejkz hv/2 f0
The function f0 is the Sinc coherence model of a uniform random layer of height hv.
First-order Legendre function: The function f1 of the Legendre expansion of the canopy coherence. In the first order expansion, the canopy coherence (after ground phase removal) is given by
γv ~ ejkz hv/2 (f0 + a10f1)
Second-order Legendre function: The function f2 of the Legendre expansion of the canopy coherence. In the second-order expansion, the canopy coherence (after ground phase removal) is given by
γv ~ ejkz hv/2 (f0 + a10f1 + a20f2)
where a10 and a20 are the first- and second- order coherence tomography coefficients, respectively.
Supplementary Products
Average cross-polarimetric backscatter: The HV backscatter averaged (incoherently) over time for all available tracks for each site. While time averaging does not reduce speckle, it reduces the effects of thermal noise and dielectric changes. No radiometric terrain correction has been applied to this product. This product is distributed either as gamma cross-section (Lope site) or as sigma cross-section with area projected on the flat ellipsoid (Rabi and Mondah sites). The gamma cross-section can be conveniently used to correct for terrain slope using the local incidence angle and the projection angle.
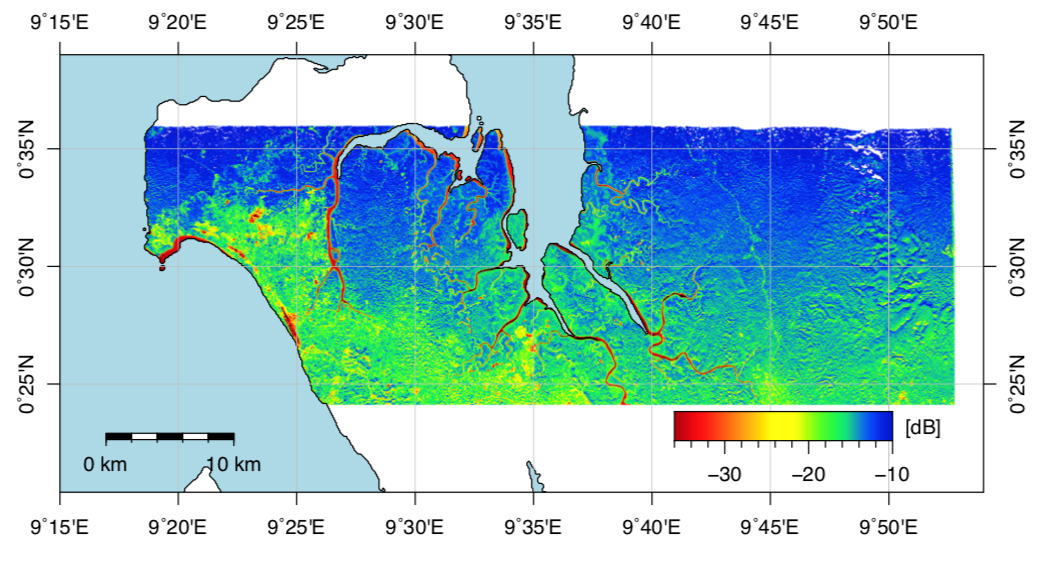
Figure 6. Average cross-polarimetric backscatter for the Mondah site generated using the ISCE/PLAnT processing chain.
Local incidence angle: The angle in degrees between the look vector from the target to radar and the normal to the local terrain. The 1-arcsec SRTMv3 was used to calculate the normal to the local terrain. The vertical interferometric sensitivity depends on the local incident angle. Therefore, this product can be used to investigate the dependence of the PolInSAR- and TomoSAR-derived products on look direction and incidence angle.
Terrain slope angle: The angle in degrees between the normal to the local ellipsoid and the normal to the local terrain along range. The 1-arcsec SRTMv3 has was to calculate the normal to the local terrain. For each image sample, terrain slope was approximated by taking one sample before and after in the slant-range projected DEM and dividing by two times the multi-looked pixel spacing. PolSAR and PolInSAR measurements as well as forest ecological characteristics depend on terrain slope. Thus, this product can be used in conjunction with other products to quantify the effect of terrain slope on PolSAR-, PolInSAR- and TomoSAR-derived products.
Projection angle: The angle in degrees between the radar image plane and the normal to the local terrain. The 1-arcsec SRTMv3 was used to calculate the normal to the local terrain. The projection angle is typically used to correct the radiometric distortions induced by terrain slope by applying the normalization factor cos(proj_angle)/cos(inc_angle). This product can also be used to investigate the effects of the imaging geometry (look direction and local topography) on the interferometric coherence magnitude and phase.
A Note about Lidar Data
Lidar data collected by the LVIS instrument onboard a B-200 aircraft were used to assist data analysis and product assessment. Refer to the companion file included with this dataset for additional details. The LiDAR data are not included with this dataset.
For additional information, refer to Lavelle et al., 2017, and the companion file AfriSAR_PolInSARWorkshop_lavallel.pdf.
Data Access
These data are available through the Oak Ridge National Laboratory (ORNL) Distributed Active Archive Center (DAAC).
AfriSAR: Canopy Structure Derived from PolInSAR and Coherence TomoSAR NISAR tools
Contact for Data Center Access Information:
- E-mail: uso@daac.ornl.gov
- Telephone: +1 (865) 241-3952
References
Cloude, S.R., Polarization coherence tomography. Radio Sci., 41(4), Aug. 2006.
Lavalle, M., B. Hawkins, and S. Hensley, “Tomographic Imaging with UAVSAR: Current status and new results from the 2016 AfriSAR campaign,” in 2017 IEEE International Geoscience and Remote Sensing Symposium (IGARSS), July 2017. 10.1109/IGARSS.2017.8127498
Papathanassiou K.P. and S.R. Cloude. Single-baseline polarimetric SAR interferometry. 39(11):2352–2363, Nov. 2001.
Pourshamsi, M., M. Garcia, M. Lavalle, and H. Balzter, “A machine learning approach to PolInSAR and lidar fusion for improved forest canopy height estimation using NASA AfriSAR campaign data,” accepted for publication in IEEE Journal of Selected Topics in Applied Earth Observations and Remote Sensing, Special Issue, 2017.
Riel, B., M. Denbina, and M. Lavalle, “Assessing uncertainties of forest height estimation from polarimetric interferometric SAR data,” accepted for publication in IEEE Journal of Selected Topics in Applied Earth Observations and Remote Sensing, Special Issue, 2017.