Documentation Revision Date: 2018-07-05
Data Set Version: 1
Summary
The PolInSAR data were collected by the NASA/JPL Uninhabited Aerial Vehicle Synthetic Aperture Radar (UAVSAR) instrument carried by the NASA C-20A (Gulfstream III). Lidar data were collected by the Land, Vegetation, and Ice Sensor (LVIS) instrument onboard a B-200 aircraft (Beechcraft B200 King Air).
The canopy height fusion data are from an experimental algorithm (to be released in a future Kapok version) that uses machine learning to choose the interferometric baseline for each pixel that gives the best canopy height estimate, based on the characteristics of the observed PolInSAR coherence region. The uncertainties represent the standard deviation in meters of the canopy height and were generated using a parallelized Metropolis-Hastings algorithm with adaptive tuning samples from the modeled probability distribution.
There are 34 data files in GeoTIFF (.tif ) format with this dataset. This includes 8 files with canopy height and uncertainty for each estimation method at each study area. The supplementary data include 13 files for each of the two sites which provide data used to derive the canopy height.
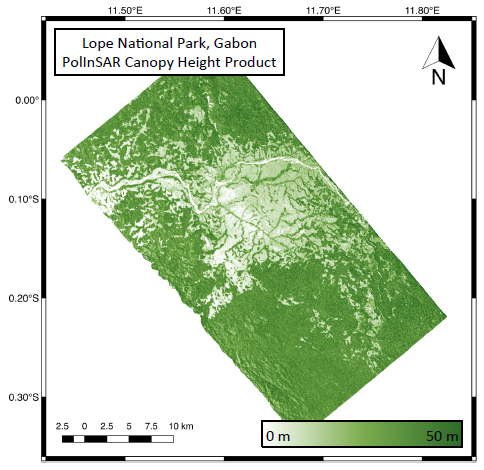
Figure 1. PolInSAR-derived canopy height map for Lope National Park, Gabon. The study areas contain a wide range of forest canopy heights up to 50 m. (figure from Denbina et al., 2017).
Citation
Denbina, M., M. Simard, B.V. Riel, B.P. Hawkins, and N. Pinto. 2018. AfriSAR: Rainforest Canopy Height Derived from PolInSAR and Lidar Data, Gabon. ORNL DAAC, Oak Ridge, Tennessee, USA. https://doi.org/10.3334/ORNLDAAC/1589
Table of Contents
- Data Set Overview
- Data Characteristics
- Application and Derivation
- Quality Assessment
- Data Acquisition, Materials, and Methods
- Data Access
- References
Data Set Overview
This dataset provides estimates of forest canopy height and canopy height uncertainty for study areas in the Pongara National Park and the Lope National Park, Gabon. Two canopy height products are included: 1) Canopy height was derived from multi-baseline Polarimetric Interferometric Synthetic Aperture Radar (PolInSAR) data using an inversion of the random volume over ground (RVoG) model and Kapok, an open source Python library. 2) Canopy height was derived from a fusion of PolInSAR and Land, Vegetation, and Ice Sensor (LVIS) Lidar data. This dataset also includes various intermediate parameters of the PolInSAR data (including radar backscatter, coherence, and viewing and terrain geometry) which provide additional insight into the input data used to invert the RVoG model and accuracy of the canopy height estimates. The AfriSAR campaign was flown from 2016-02-27 to 2016-03-08. AfriSAR data were collected by NASA, in collaboration with the European Space Agency (ESA) and the Gabonese Space Agency.
The PolInSAR data were collected by the NASA/JPL Uninhabited Aerial Vehicle Synthetic Aperture Radar (UAVSAR) instrument carried by the NASA C-20A (Gulfstream III). Lidar data were collected by the Land, Vegetation, and Ice Sensor (LVIS) instrument onboard a B-200 aircraft (Beechcraft B200 King Air).
The canopy height fusion data are from an experimental algorithm (to be released in a future Kapok version) that uses machine learning to choose the interferometric baseline for each pixel that gives the best canopy height estimate, based on the characteristics of the observed PolInSAR coherence region. The uncertainties represent the standard deviation in meters of the canopy height and were generated using a parallelized Metropolis-Hastings algorithm with adaptive tuning samples from the modeled probability distribution.
Project: AfriSAR
The AfriSAR mission was an airborne campaign that collected radar and field measurements of tropical forests in Gabon, West Africa. The mission was a NASA collaboration with the European Space Agency (ESA) and the Gabonese Space Agency. During the 2016 AfriSAR campaign, NASA UAVSAR and LVIS instruments collected data that will be used to derive forest canopy height, structure, and topography. The AfriSAR data is a precursor to upcoming spaceborne missions that examine the role of forests in Earth's carbon cycle.
Related publication
Denbina, M., Simard, M. and Hawkins, B., 2018. Forest Height Estimation Using Multibaseline PolInSAR and Sparse Lidar Data Fusion. IEEE Journal of Selected Topics in Applied Earth Observations and Remote Sensing, (99), pp.1-19. DOI: 10.1109/JSTARS.2018.2841388
Acknowledgements
This work was conducted at the Jet Propulsion Laboratory under NASA grant number NNX16AP74G.
Data Characteristics
Spatial Coverage: Pongara and Lope National Parks, Gabon
Spatial Resolution: 1 arc second (approx. 30 m) pixel spacing
Temporal Coverage: 2016-02-27 to 2016-03-08
Temporal Resolution: Once
Study Area (coordinates in decimal degrees)
| Site | Westernmost Longitude | Easternmost Longitude | Northernmost Latitude | Southernmost Latitude |
|---|---|---|---|---|
| Pongara and Lope National Parks, Gabon | 9.28806 | 11.8303 | 0.237222 | -0.338889 |
Data File Information
There are 34 data files in GeoTIFF (.tif ) format with this dataset. This includes 8 files with canopy height and uncertainty for each estimation method at each study area. The supplementary data include 13 files for each of the two sites which provide data used to derive the canopy height.
Canopy height data files
The files provide forest canopy height estimated with two different methods:
1) PollnSAR-derived (based on multi-baseline PolInSAR data using inversion of the random volume over ground (RVoG) model, and Kapok to generate the canopy height products)
2) PollnSAR-LiDAR Fusion (canopy heights estimated using a fusion of PolInSAR and LVIS lidar data). The fusion files include “fusion” in the file names.
No data values for all files are set to "-9999". Uncertainty data are also included that represent the standard deviation in meters of the canopy height.
Table 1. File names and descriptions
| File name | Description |
|---|---|
| PolInSAR-derived | |
| lope_canopyheight.tif | Estimated canopy height data for Lope National Park |
| lope_canopyheight_uncertainty.tif | Estimated canopy height uncertainty - the standard deviation in meters of the canopy height data for Lope National Park |
| pongara_canopyheight.tif | Estimated canopy height data for Pongara National Park |
| pongara_canopyheight_uncertainty.tif | Estimated canopy height uncertainty - the standard deviation in meters of the canopy height data for Pongara National Park |
| PolInSAR-Lidar Fusion | |
| lope_canopyheightfusion.tif | Estimated canopy height data for Lope National Park from the fusion of PollnSAR and Lidar data |
| lope_canopyheightfusion_uncertainty.tif | Estimated canopy height uncertainty from the fusion of PollnSAR and Lidar data - the standard deviation in meters of the canopy height data for Lope National Park |
| pongara_canopyheightfusion.tif | Estimated canopy height data for Pongara National Park from the fusion of PollnSAR and Lidar data |
| pongara_canopyheightfusion_uncertainty.tif | Estimated canopy height uncertainty from the fusion of PollnSAR and Lidar data- the standard deviation in meters of the canopy height data for Pongara National Park |
Table 2. Properties of the GeoTIFF canopy height files
| File names | Variable Units | Min value | Max Value | Mean value | Std dev | # Columns | # Rows |
|---|---|---|---|---|---|---|---|
| PolInSAR-derived | |||||||
| lope_canopyheight.tif | meters | 0 | 60.4 | 30.3 | 13.7 | 1436 | 1502 |
| lope_canopyheight_uncertainty.tif | meters | 0.5 | 10.7 | 4.9 | 1.3 | 1436 | 1502 |
| pongara_canopyheight.tif | meters | 0 | 60.4 | 22.2 | 17.4 | 2590 | 962 |
| pongara_canopyheight_uncertainty.tif | meters | 0.5 | 11.1 | 5 | 1.7 | 2590 | 962 |
| PolInSAR-Lidar Fusion | |||||||
| lope_canopyheightfusion.tif | meters | 0 | 60.4 | 27.5 | 16.1 | 1436 | 1502 |
| lope_canopyheightfusion_uncertainty.tif | meters | 0.5 | 13.6 | 5.2 | 1.5 | 1436 | 1502 |
| pongara_canopyheightfusion.tif | meters | 0 | 60.4 | 21.4 | 18.3 | 2590 | 962 |
| pongara_canopyheightfusion_uncertainty.tif | meters | 0.5 | 11.9 | 4.7 | 1.7 | 2590 | 962 |
Supplemental data files
The supplementary data products are based on various intermediate parameters of the UAVSAR data and include radar backscatter, coherence, and viewing and terrain geometry.
Table 3. File names and descriptions
| File names | Descriptions |
|---|---|
| pongara_canopycoh_mag.tif | Canopy-dominated (“high”) coherence magnitude, Pongara study area |
| pongara_groundcoh_mag.tif | Ground-dominated (“low”) coherence magnitude, Pongara study area |
| pongara_masksep.tif | Coherence separation, Pongara study area |
| lope_rangeslopeangle.tif | Ground range terrain slope angle, in degrees, Lope study area |
| pongara_maskerr.tif | Cramer-Rao phase center height standard deviation, in meters, Pongara study area |
| lope_canopycoh_mag.tif | Canopy-dominated (“high”) coherence magnitude, Lope study area |
| pongara_groundcoh_pch.tif | Ground-dominated (“low”) coherence phase center height, Pongara study area |
| lope_kzmerged.tif | Vertical wavenumber of chosen baseline, in radians per meter, Lope study area |
| lope_maskerr.tif | Cramer-Rao phase center height standard deviation, in meters, for Lope study area |
| lope_ambiguityheight.tif | Ambiguity height of chosen baseline, in meters, Lope study area |
| pongara_HVbackscatter.tif | Average HV backscatter (sigma-nought), in dB, Pongara study area |
| lope_groundcoh_pch.tif | Ground-dominated (“low”) coherence phase center height, in meters, for Lope study area |
| lope_masksep.tif | Coherence separation, for Lope study area |
| pongara_lookangle.tif | SAR look angle, in degrees, Pongara study area |
| lope_lookangle.tif | SAR look angle, in degrees, Lope study area |
| pongara_kzmerged.tif | Vertical wavenumber of chosen baseline, in radians per meter, Pongara study area |
| lope_maskloc.tif | Coherence line location, Lope study area |
| pongara_rangeslopeangle.tif | Ground range terrain slope angle, in degrees, Pongara study area |
| lope_HVbackscatter.tif | Average HV backscatter (sigma-nought), in dB, Lope study area |
| pongara_ambiguityheight.tif | Ambiguity height of chosen baseline, in meters, Pongara study area |
| pongara_azimuthslopeangle.tif | Azimuth terrain slope angle, in degrees, Pongara study area. |
| pongara_canopycoh_pch.tif | Canopy-dominated (“high”) coherence phase center height, in meters, Pongara study area |
| pongara_maskloc.tif | Coherence line location, Pongara study area |
| lope_groundcoh_mag.tif | Ground-dominated (“low”) coherence magnitude, Lope study area |
| lope_azimuthslopeangle.tif | Azimuth terrain slope angle, in degrees, Lope study area. |
| lope_canopycoh_pch.tif | Canopy-dominated (“high”) coherence phase center height, Lope study area |
Table 4. Properties of the GeoTIFF supplemental files
| File names | Variable units | Min value | Max value | Mean value | Std dev | # Columns | # Rows |
|---|---|---|---|---|---|---|---|
| pongara_canopycoh_mag.tif | none | 0 | 0.9 | 0.6 | 0.1 | 2590 | 962 |
| pongara_groundcoh_mag.tif | none | 0 | 0.9 | 0.6 | 0.1 | 2590 | 962 |
| pongara_masksep.tif | none | 0 | 0.9 | 0.3 | 0.2 | 2590 | 962 |
| lope_rangeslopeangle.tif | degrees | -80.7 | 75.3 | -0.1 | 7.4 | 1436 | 1502 |
| pongara_maskerr.tif | meters | 0 | 100 | 1.1 | 4.8 | 2590 | 962 |
| lope_canopycoh_mag.tif | none | 1.4 | 0.9 | 0.7 | 0 | 1436 | 1502 |
| pongara_groundcoh_pch.tif | meters | 0 | 48.2 | 4.3 | 3.5 | 2590 | 962 |
| lope_kzmerged.tif | rad/m | 0 | 1.4 | 0 | 0 | 1436 | 1502 |
| lope_maskerr.tif | meters | 0 | 55.3 | 1 | 0.5 | 1436 | 1502 |
| lope_ambiguityheight.tif | meters | 0 | 405751.1 | 91 | 565.2 | 1436 | 1502 |
| pongara_HVbackscatter.tif | dB | -46.9 | -2.7 | -17.3 | 8.8 | 2590 | 962 |
| lope_groundcoh_pch.tif | meters | 0 | 10519.5 | 6.1 | 15.5 | 1436 | 1502 |
| lope_masksep.tif | none | 0 | 1.1 | 0.4 | 0.1 | 1436 | 1502 |
| pongara_lookangle.tif | degrees | 21.5 | 65.7 | 49.3 | 12.4 | 2590 | 962 |
| lope_lookangle.tif | degrees | 20.1 | 66.2 | 49.8 | 12.2 | 1436 | 1502 |
| pongara_kzmerged.tif | rad/m | 0 | 0.4 | 0 | 0 | 2590 | 962 |
| lope_maskloc.tif | none | 0 | 0.9 | 0.6 | 0.1 | 1436 | 1502 |
| pongara_rangeslopeangle.tif | degrees | -45 | 31.3 | 0 | 3.7 | 2590 | 962 |
| lope_HVbackscatter.tif | dB | -38.2 | 1 | -13.7 | 5 | 1436 | 1502 |
| pongara_ambiguityheight.tif | meters | 0 | 194.6 | 59.9 | 44.5 | 2590 | 962 |
| pongara_azimuthslopeangle.tif | degrees | -47.4 | 51.5 | 0 | 3.6 | 2590 | 962 |
| pongara_canopycoh_pch.tif | meters | 0 | 63.7 | 12.2 | 9.9 | 2590 | 962 |
| pongara_maskloc.tif | none | 0 | 0.9 | 0.4 | 0.3 | 2590 | 962 |
| lope_groundcoh_mag.tif | none | 3.4 | 0.9 | 0.7 | 0 | 1436 | 1502 |
| lope_azimuthslopeangle.tif | degrees | -70.5 | 61 | 0 | 7.3 | 1436 | 1502 |
| lope_canopycoh_pch.tif | meters | 0 | 44248.3 | 16.7 | 63.8 | 1436 | 1502 |
Table 5. Properties common to all canopy height and supplemental files
| No data value | Map units | # Bands | Scaling |
|---|---|---|---|
| -9999 | degree | 1 | 1 |
Spatial information for all files:
GEOGCS['WGS 84', DATUM['WGS_1984', SPHEROID['WGS 84',6378137,298.257223563,
AUTHORITY['EPSG','7030']],
AUTHORITY['EPSG','6326']],
PRIMEM['Greenwich',0],
UNIT['degree',0.0174532925199433],
AUTHORITY['EPSG','4326']]
Companion File Information
There are three companion files associated with this dataset. The denbina_kapok_polinsar_canopyht_methods.pdf is a document describes the canopy height and related products released for the areas of Lope National Park and Pongara National Park, Gabon, as part of the AfriSAR campaign.
The lope_kapok_processing_script.py and pongara_kapok_processing_script.py are the scripts that were used to generate the PolInSAR products
Application and Derivation
Canopy height data from African tropical rainforests will help to parameterize models of carbon storage in a previously-understudied region. This information can also inform policymakers working on climate mitigation and forest conservation policies.
Quality Assessment
Canopy height uncertainty products are included with this dataset and represent the standard deviation in meters of the canopy height. A probabilistic approach was used to represent the distribution of possible canopy parameter values using Bayesian Theorem. A parallelized Metropolis-Hastings algorithm with adaptive tuning samples from the modeled probability distribution was used to produce the uncertainty estimates.
Data Acquisition, Materials, and Methods
Study sites
Gabon’s forest is part of the Congolian tropical forests, altogether the second largest rainforest in the world after the Amazon. About 85 percent of the country’s land is forest and only about 1.5 million people live there. The forests in Gabon are special in that they are rich in plants and animals, but empty of people and intact in most places. The Pongara National Park and Lope National Park study areas contain extensive mangrove and inland forest coverage, respectively, and a wide range of forest canopy heights up to 50 m.
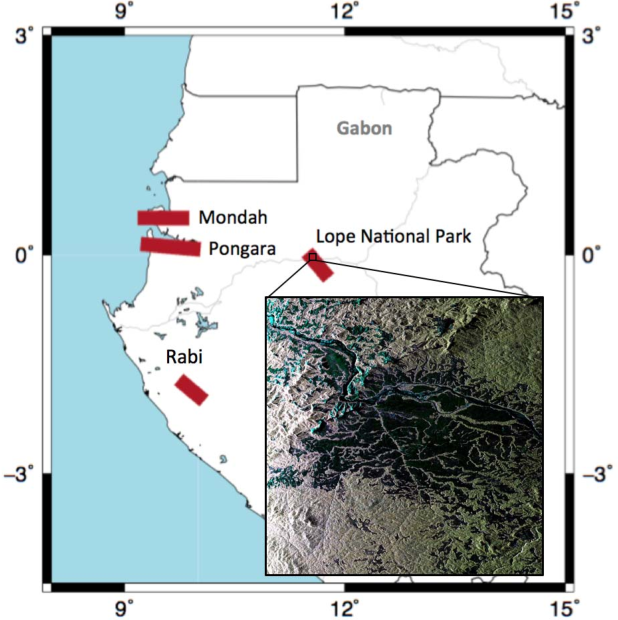
Figure 2. Pongara and Lope National Park sites where UAVSAR and LVIS data were acquired during the 2016 AfriSAR airborne campaign (Lavalle et al. 2017).
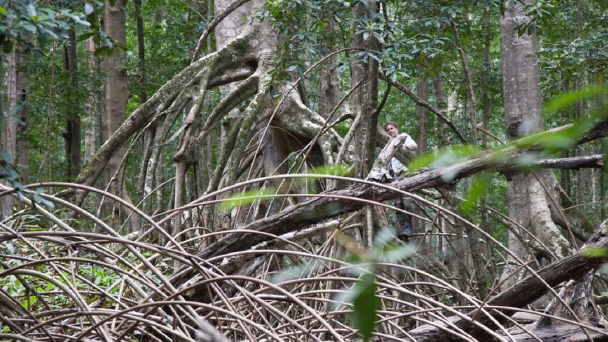
Figure 3. Pongara National Park, Gabon (figure from Simard et al., 2016).
Methods
For more detailed information please refer to the companion file denbina_kapok_polinsar_canopyht_methods.pdf.
Canopy Height
The PolInSAR data were collected by the NASA/JPL Uninhabited Aerial Vehicle Synthetic Aperture Radar (UAVSAR) instrument carried by the NASA C-20A (Gulfstream III).
Forest canopy height was estimated from the multi-baseline PolInSAR data using inversion of the random volume over ground (RVoG) model, and Kapok was used to generate the canopy height products (not the uncertainty or fusion products). Kapok is an open source Python library containing algorithms to estimate forest height and other parameters using polarimetric synthetic aperture radar interferometry (PoIIn-SAR). Kapok imports data collected by NASA's Uninhabited Aerial Vehicle Synthetic Aperture Radar (UAVSAR) instrument. The data are freely available from the UAVSAR website at uavsar.jpl.nasa.gov, and comes in the form of single-look complex (SLC) stacks containing images of complex reflectivity (amplitude and phase) for each flight line and polarization, as well as additional files describing the metadata and geometry.
Once imported by Kapok, all multi-look data are saved within a single compressed file using the HDF5 file format. Output products can be exported in various GIS-ready raster formats (e.g., GeoTIFF or ENVI format).
Lidar data were collected by the Land, Vegetation, and Ice Sensor (LVIS) instrument onboard a B-200 aircraft (Beechcraft B200 King Air).
Canopy Height Processing Steps
A flowchart showing a basic outline of the various processing steps is shown in Fig. 3. First, the UAVSAR SLC stack product is downloaded. Kapok uses these data to calculate a multi-look PolInSAR covariance matrix for each pixel in the imagery, and converts the downloaded vertical wavenumber, look vector, and geolocation information into arrays of values with the same dimensions as the multi-looked covariance matrix. All necessary parameters for further processing are saved with the same pixel spacing and spatial extent as datasets within a single HDF5 file.
After importing the data and calculating the multi-look covariance matrix, a coherence optimization procedure is performed in order to find the PolInSAR coherences with the largest separation in the complex plane. After coherence optimization, the interferometric phase of the ground surface beneath the forest canopy is estimated, as in the standard three-stage random volume over ground (RVoG) model inversion procedure (Cloude and Papathanassiou, 2003).
When estimating canopy height from multi-baseline datasets, the baseline pair must be chosen to use for each pixel in the image or perform a global optimization for multiple pairs simultaneously. Canopy heights are then estimated for the selected baselines using inversion of the RVoG model.
The canopy height products were created by solving for the forest canopy height and extinction parameters of the model, ignoring the effects of temporal decorrelation. The products assume that temporal decorrelation is negligible and use a free extinction value in the model inversion procedure, as this is the most common inversion method found in the literature.
Pixels with low HV backscatter were masked out to avoid estimating forest heights over water areas. In the canopy height products, these pixels have canopy height set to zero (e.g., non-forest).
The estimated canopy heights are then exported as a geocoded raster using the UAVSAR stack latitude/longitude information.
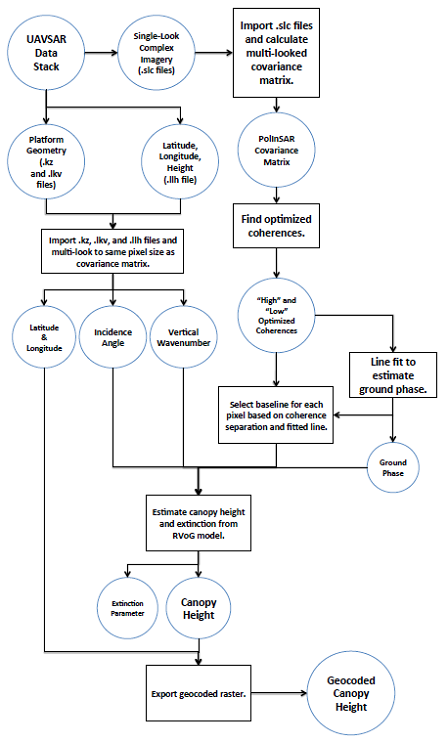
Figure 4. Process flow chart.
Canopy Height Fusion Products using an Experimental Algorithm
Canopy heights were also estimated using a fusion of PolinSAR and the LVIS Lidar data (used to train the algorithm). The fusion algorithm is still experimental but will be released in a future version of Kapok and described in Denbina et al 2018. The algorithm uses machine learning to choose the interferometric baseline for each pixel that gives the best canopy height estimate, based on the characteristics of the observed PolInSAR coherence region.
A sparse sampling (approximately 250-m spacing in both azimuth and range directions) of the relative height 100 (RH100) data was used for training. Since the RH100 values were used for training, potential biases in the LVIS RH100 data are expected to be reflected in these products. The Lidar data only guides the choice of which baseline’s canopy height estimate to choose for each pixel, it does not tune or modify the RVoG model parameters or inversion procedure.
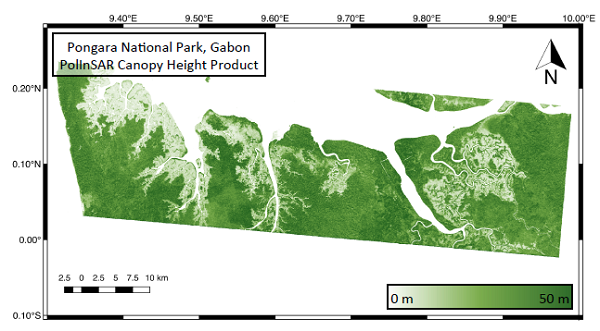
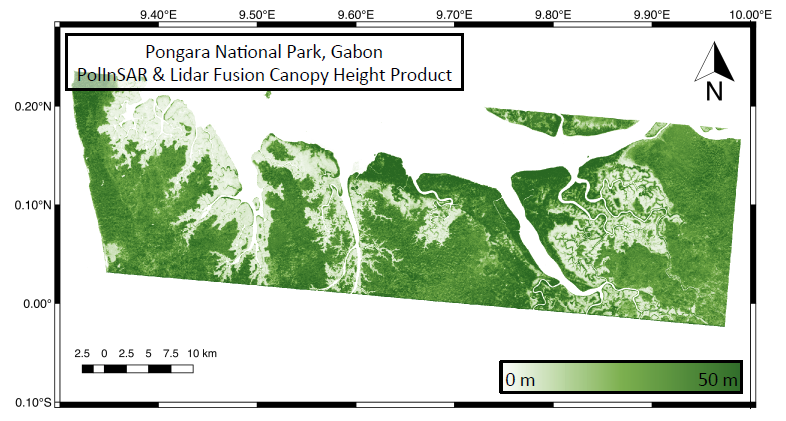
Figure 5. PolInSAR-derived canopy height (top) and canopy height derived from PolInSAR and Lidar fusion (bottom image) for Pongara National Park, Gabon (Denbina et al., 2017).
Uncertainty Products-Canopy Height and Canopy Height Fusion Products
The process described is the same for the fusion products. Uncertainty products represent the standard deviation in meters of the canopy height product hv. A probabilistic approach was used to represent the distribution of possible canopy parameter values by using Bayes’ Theorem:
p (m|γ) ∝ p (γ|R(m), σγ) p (m) p (σγ)
where
m is the vector of our canopy parameters, γ is the vector of the observed coherences, R(m) is the output of the RVoG model for a given m, and σγ is the standard deviation of the observed coherences.
Canopy Height Supplemental Products
The supplementary products are based on various intermediate parameters of the UAVSAR data. These products can give additional insight into the input data used to invert the RVoG model and accuracy of the canopy height estimates.
Radar Backscatter
The Average HV Backscatter file contains the average σ0 of the HV polarization channel across all UAVSAR flight tracks. The values were averaged in linear units, and the resulting average was converted to the power in dB.
Geometry Products
The geometry products describe the geometry of the sensor position and viewing angle, as well as the estimated slope of the underlying terrain (calculated from the 1 arc second SRTM DEM):
- The Look Angle file contains the look (or incidence) angle, in degrees. The look angle represents the angle between the SAR look vector and the sensor nadir for each pixel
- The Ground Range Terrain Slope Angle file contains the terrain slope angle, in degrees, measured in the ground range direction of the radar (e.g., either towards or away from the SAR sensor). A positive slope represents terrain oriented towards the radar, while a negative slope represents terrain oriented away from the radar
- The Azimuth Terrain Slope Angle file contains the terrain slope angle, in degrees, measured in the azimuth direction of the radar (e.g., along the direction of the aircraft flight track). A positive azimuth slope points towards the beginning of the UAVSAR flight, while a negative azimuth slope points towards the end of the UAVSAR flight
- The Vertical Wavenumber file contains the vertical wavenumber, in radians per meter, of the selected baseline for each pixel. This gives an idea of the sensitivity of the measured interferometric phases to the vertical height of the scatterers.
- The 2π Ambiguity Height file contains the ambiguity height, in meters, of the selected baseline for each pixel. The 2π ambiguity height is the difference in vertical height that would result in an interferometric phase shift of 2π radians (a complete cycle).
PolInSAR Coherence Products
These products contain the values of the optimized coherence magnitudes and coherence phase center heights, for the baselines used to estimate the PolInSAR canopy height product:
- The Canopy-Dominated (“High”) Coherence Magnitude is the coherence magnitude of γhigh ( γhigh is the canopy-dominated (highest observed phase center) coherence), for the baselines selected by the baseline selection procedure. This coherence magnitude is indicative of the decorrelation of the forest canopy from volumetric decorrelation, temporal decorrelation, and potentially other decorrelation sources.
- The Ground-Dominated (“Low”) Coherence Magnitude is similar, but for γlow (γlow is the ground-dominated (lowest observed phase center) coherence).
- The Canopy-Dominated (“High”) Coherence Phase Center Height represents the height of the γhigh phase center above the estimated ground surface. Note that this is not the same as the canopy height, as generally the high coherence phase center will not lie at the top of the canopy, but rather somewhere within the forest’s vertical structure.
- The Ground-Dominated (“Low”) Coherence Phase Center Height is similar, but for γlow. Note that while we would expect γhigh to generally contain small (or even negligible) ground backscatter at L-band, this is not the case for γlow. The γlow coherence will often contain significant amounts of ground backscatter, and will therefore lie closer to the ground than γhigh.
For pixels which were masked as non-forest, the coherence magnitude products will be equal to one, and the phase center height products will be equal to zero.
Data Quality Products
These products provide insight into the forest height estimation accuracy through metrics of the PolInSAR coherences:
- The Cramer-Rao Phase Center Height Standard Deviation is a measure of the standard deviation of the γhigh phase center. This product is capped at a maximum standard deviation of 100 m.
- The Coherence Separation is the value of |γhigh −γlow| for the selected baseline of each pixel, representing the separation of observed PolInSAR coherences observed within the canopy.
- The Coherence Line Location is the value of the shortest line length between the line fitted to γhigh and γlow, and the origin of the complex plane. The product of this metric, and the coherence separation metric, are used to choose which baseline to invert for each pixel in the imagery. The baseline with the highest value of the product is chosen.
For pixels which were masked as non-forest, the coherence magnitude products will be equal to one, and the phase center height products will be equal to zero.
For more detailed information please refer to the companion file denbina_kapok_polinsar_canopyht_methods.pdf.
Data Access
These data are available through the Oak Ridge National Laboratory (ORNL) Distributed Active Archive Center (DAAC).
AfriSAR: Rainforest Canopy Height Derived from PolInSAR and Lidar Data, Gabon
Contact for Data Center Access Information:
- E-mail: uso@daac.ornl.gov
- Telephone: +1 (865) 241-3952
References
Cloude, S.R. and K.P. Papathanassiou. 2003. Three-stage inversion process for polarimetric SAR interferometry, in IEE Proceedings - Radar, Sonar and Navigation, vol. 150, no. 3, pp. 125-134. https://dx.doi.org/10.1049/ip-rsn:20030449
Denbina, M., M. Simard, B. Riel, B. Haaawkins, and N. Pinto. 2017. AfriSAR Product Manual for Kapok-Generated PollnSAR Canopy Height Products, Lope and Pongara National Parks, Gabon. This release is version 1.0, generated May 11, 2017.
Denbina, M., Simard, M. and Hawkins, B., 2018. Forest Height Estimation Using Multibaseline PolInSAR and Sparse Lidar Data Fusion. IEEE Journal of Selected Topics in Applied Earth Observations and Remote Sensing, (99), pp.1-19. DOI: 10.1109/JSTARS.2018.2841388
Lavalle, Marco, Brian P. Hawkins and Scott Hensley. “Tomographic imaging with UAVSAR: Current status and new results from the 2016 AfriSAR campaign.” 2017 IEEE International Geoscience and Remote Sensing Symposium (IGARSS) (2017): 2485-2488.
Simard, M., M. Denbina, V.H. Rivera-Monroy, E. Castaneda, and L. Fatoyinbo. 2016. Estimation of Carbon Stocks in Mangrove Ecosystems based on polinSAR retrievals. Presentation.