Documentation Revision Date: 2020-09-22
Dataset Version: 1
Summary
There are 176 data files in GeoTIFF (.tif) format with this dataset.
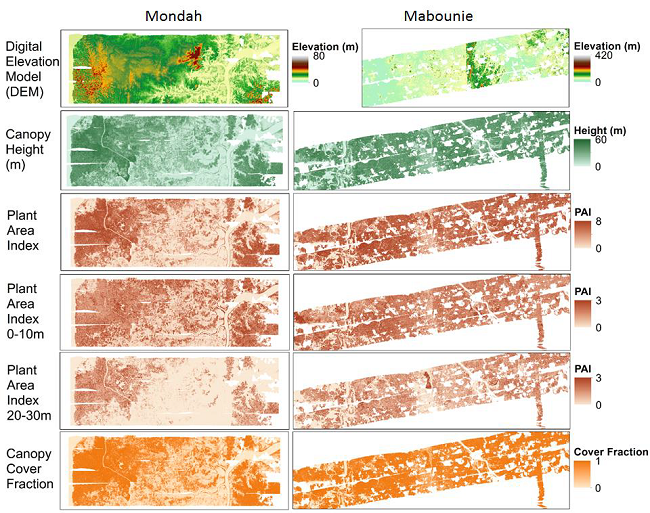
Figure 1. Gridded Land, Vegetation, and Ice Sensor (LVIS) instrument data products at 25 m spatial resolution over the Mondah Forest (left) and Mabounie (right) sites in Gabon. Note that the images labeled "DEM" are plotted from the bare ground elevation data files included in the dataset. Source: J. Armston
Citation
Armston, J., H. Tang, S. Hancock, S. Marselis, L. Duncanson, J. Kellner, M. Hofton, J.B. Blair, T. Fatoyinbo, and R.O. Dubayah. 2020. AfriSAR: Gridded Forest Biomass and Canopy Metrics Derived from LVIS, Gabon, 2016. ORNL DAAC, Oak Ridge, Tennessee, USA. https://doi.org/10.3334/ORNLDAAC/1775
Table of Contents
- Dataset Overview
- Data Characteristics
- Application and Derivation
- Quality Assessment
- Data Acquisition, Materials, and Methods
- Data Access
- References
Dataset Overview
This dataset contains gridded forest characterization products derived from full-waveform lidar data acquired by NASA's airborne Land, Vegetation, and Ice Sensor (LVIS) instrument for five forested sites in Gabon, Africa, during the 2016 NASA-ESA AfriSAR campaign. The LVIS lidar instrument was flown over study sites in Lope, Mondah/Akanda, Pongara, Rabi, and Mabouni from February to March 2016. Derived canopy cover, canopy heights, bare ground elevation, plant area index (PAI), and foliage height diversity (FHD), and respective uncertainties are provided at a 25 m resolution for each of the five study sites. Aboveground biomass density (AGBD) and uncertainty were modeled at 50 m and 100 m resolutions for the Lope, Mondah, and Mabounie sites using field inventory data and waveform height and cover metrics. Lidar grid cell data collection statistics (i.e., number of shots and flight lines) and a data mask are also included. This research leverages high-quality forest inventory datasets collected during the AfriSAR campaign for one of the least studied and most unique forest ecosystems in the world.
Project: AfriSAR
The AfriSAR mission was an airborne campaign that collected radar and field measurements of forests in Gabon, West Africa. The mission was a NASA collaboration with the European Space Agency (ESA) and the Gabonese Space Agency. During the 2016 AfriSAR campaign, NASA UAVSAR and LVIS instruments collected data that will be used to derive forest canopy height, structure, and topography. The AfriSAR data will help prepare for and calibrate current and upcoming spaceborne missions that aim to gauge the role of forests in Earth's carbon cycle.
Related Publication
Fatoyinbo, T., et al. 2020. The 2016 NASA AfriSAR Campaign: Airborne SAR and Lidar Measurements of Tropical Forest Structure and Biomass in Support of Future Space Missions. In progress
Related Datasets
Fatoyinbo, T., S.S. Saatchi, J. Armston, J. Poulsen, S. Marselis, N. Pinto, L. Duncanson, L.J.T. White, and K. Jeffery. 2018. AfriSAR: Mondah Forest Tree Species, Biophysical, and Biomass Data, Gabon, 2016. ORNL DAAC, Oak Ridge, Tennessee, USA. https://doi.org/10.3334/ORNLDAAC/1580
Saatchi, S.S., J. Chave, N. Labriere, N. Barbier, M. Maxime-Rejou, A. Ferraz, and S. Tao. 2019. AfriSAR: Aboveground Biomass for Lope, Mabounie, Mondah, and Rabi Sites, Gabon. ORNL DAAC, Oak Ridge, Tennessee, USA. https://doi.org/10.3334/ORNLDAAC/1681
Tang, H., J. Armston, S. Hancock, M. Hofton, J.B. Blair, T. Fatoyinbo, and R.O. Dubayah. 2018. AfriSAR: Canopy Cover and Vertical Profile Metrics Derived from LVIS, Gabon, 2016. ORNL DAAC, Oak Ridge, Tennessee, USA. https://doi.org/10.3334/ORNLDAAC/1591
Acknowledgments
This work was funded by the NASA AfriSAR Mission (grant number NNX16AP74G).
Data Characteristics
Spatial Coverage: Lope, Mondah/Akanda, Pongara, Rabi, and Mabounie study sites in Gabon, Africa
Spatial Resolution: L3 LVIS-derived products provided at a 25 m resolution; modeled aboveground biomass is provided at 50 m and 100 m resolutions
Temporal Coverage: 2016-02-20 to 2016-03-08
Temporal Resolution: One-time measurements
Study Area: Latitudes and longitudes are provided in decimal degrees.
| Site | Westernmost Longitude | Easternmost Longitude | Northernmost Latitude | Southernmost Latitude |
|---|---|---|---|---|
| Full extent | 9.179286 | 12.02394 | 0.631722 | -2.29494 |
| Lope | 11.39674 | 12.02394 | -0.01559 | -0.64224 |
| Mabounie | 9.935094 | 10.7425 | -0.67959 | -0.95097 |
| Mondah/Akanda | 9.269389 | 9.631119 | 0.631722 | 0.534436 |
| Pongara | 9.179286 | 9.995917 | 0.265536 | 0.004522 |
| Rabi | 9.594942 | 10.27658 | -1.68464 | -2.29494 |
Data File Information:
There are 176 data files in GeoTIFF (.tif) format. The files are named lvis2_site_2016022020160308_level_variable_e32732_v0301_resolution.tif, where
lvis2 = instrument
site = sites; mond (Mondah/Akanda), lope (Lope), mabo (Mabounie), rabi (Rabi), pong (Pongara)
2016022020160308 = date range of LVIS flightline acquisition
level = data product level; l3a1, l3a2, l3b1, l3b2, l3c1, l3d1, l4a1
variable = data product variable
e32732 = map projection
v0301 = processing version
resolution = spatial resolution in meters
Table 1. File names and descriptions for each data product level.
| File Names | Description | Number of Files | Resolution |
|---|---|---|---|
|
lvis2_site_2016022020160308_l3a1_variable_ e32732_v0301_r025m.tif
|
product = l3a1 is the mean at the respective height (i.e, variable) variable = 8 relative heights (RH) in meters above ground level (X): RH25, RH50, RH75, RH90, RH95, RH98, RH99, RH100 |
8 variable files for product = l3a1, 1 file for each of 5 site; 40 files total |
25 m |
|
lvis2_site_2016022020160308_l3b1_variable_ e32732_v0301_r025m.tif
|
product = l3b1 is the mean of the respective canopy metric (i.e, variable) variable = 7 canopy metrics: |
7 variable files for product = l3b1, 1 file for each of 5 site; 35 files total |
25 m |
|
lvis2_site_2016022020160308_l3c1_ground_elev_ e32732_v0301_r025m.tif |
product = l3c1 and variable = gound_elev is bare ground elevation in meters above mean sea level |
1 variable files for product = l3c1 and variable = gound_elev, 1 file for each of 5 site; 5 files total |
25 m |
|
lvis2_site_2016022020160308_l3d1_variable_ e32732_v0301_r025m.tif |
product = l3d1 is lidar grid cell statistics and data mask variable = 3 lidar metrics: |
3 variable files for product = l3d1, 1 file for each of 5 site; 15 files total |
25 m |
|
lvis2_site_2016022020160308_l4a1_agb_ e32732_v0301_resolution.tif |
product = l4a1 and variable = agb is gridded modeled aboveground biomass and uncertainty in megagrams per hectare |
2 resolution files for product = l4a1 and variable = agb, 1 file for each of the sites Lope, Mabounie, Mondah/Akanda; 6 files total |
50 m, 100 m |
Data File Details
The projection is "WGS 84 / UTM zone 32S", EPSG 32732, and the no data value is -9999.
L3 products have one data band per file and L4 product has 4 bands per file.
Application and Derivation
AfriSAR presents a unique opportunity to test refined methods for retrieval of canopy height and vertical profile metrics in high aboveground biomass rainforests (up to 600 Mg/ha) with dense canopies (>90% cover), where the greatest uncertainty exists. This research leverages high-quality forest inventory datasets collected through the AfriSAR campaign for one of the least studied and unique forest ecosystems in the world.
Quality Assessment
Only good quality LVIS shots dictated by quality flags are included in original LVIS footprint data, depending largely on whether the ground was reached by the lidar waveform. There was no temporal discrepancy between field and lidar data for the calibration of the biomass data. Quality Assurance and Quality Control (QAQC) were applied to field data. Biomass estimates were compared to those from Labriere et al. (2018). Additional information on quality assurance can be found in Fatoyinbo et al. (2020).
Known Problems
For all gridded products, cloud cover resulted in lidar data gaps. There are also gaps between flight lines, where the flight lines were not exactly adjacent resulting in missing values.
For the gridded biomass products, there is inherent uncertainty in ground estimates of aboveground biomass (i.e., field estimates) propagated through to the gridded biomass products. Moreover, geolocation uncertainty of the field data resulted in poorer alignment between the field plots and the LVIS lidar data. Both these uncertainties propagated through in the gridded biomass products.
These known problems could limit the data's use (e.g., uncertainty, sampling problems, blanks, QC samples)
Data Acquisition, Materials, and Methods
Study Area
Gridded products were derived from full-waveform lidar data acquired by NASA's LVIS instrument for the Lope, Mondah/Akanda, Pongara, Rabi, and Mabounie study sites in Gabon, Africa.
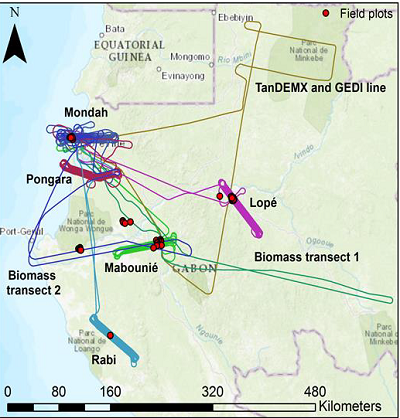
Figure 2. Locations of AfriSAR LVIS acquisitions and field data sites.
NASA's Airborne Land, Vegetation, and Ice Sensor (LVIS) Instrument
LVIS is an airborne, wide-swath imaging laser altimeter system that is flown over target areas to collect data on surface topography and 3D structure. Utilizing a system that includes a 1064 nm wavelength laser and three detectors, the entire time history of the outgoing and return pulses are digitized, allowing unambiguous determination of range and return pulse structure. Combined with aircraft position and attitude knowledge, the sensor produces topographic maps with dm accuracy and vertical height and structure measurements of overflown terrain (e.g., vegetation and ice).
Data Collection
LVIS was flown in Gabon from February to March 2016 on the NASA Langley King Air B-200 at an altitude of 7.3 km. Dates and locations of individual flights are shown in Table 3.
Table 3. LVIS acquisition sites and dates.
| Site | Date in 2016 | Reported in this Dataset? |
|---|---|---|
| Mabounié | February 20 | Yes |
| TanDEM-X transect | February 22 | No |
| GEDI crossover transect | February 22 | No |
| Biomass-1 transect | February 23 | No |
| Lopé | March 2 | Yes |
| Pongara | March 4 | Yes |
| Rabi | March 7 | Yes |
| Mondah/Akanda | March 4 | Yes |
| Mondah/Akanda | March 8 | Yes |
| Biomass-2 Transect | March 8 | No |
Data Product Derivation
Relative Height Metric and Bare Earth Elevation Grids
LVIS 25 m x 25 m (0.0625 ha) spatial resolution relative height metric and bare earth elevation grids were generated from the footprint elevation and height metrics. The bare earth elevation or Digital Elevation Model (DEM) interpolation approach used the natural neighbor algorithm, which finds the nearest subset of input points to an interpolation point and weights them based on the proportion of overlap between the polygon defined by a Voronoi diagram around the interpolation point and one based on the input points only (Sibson, 1981).
Canopy Cover and Vertical Profile Metric Grids
LVIS 25 m x 25 m (0.0625 ha) spatial resolution canopy cover and vertical profile metric grids were generated from the footprint canopy cover and vertical profile metrics including total canopy cover, foliage height diversity, total plant area index (PAI), and PAI in height intervals of 0-10 m, 10-20 m, 20-30 m, and >30 m. The gridded products were derived by aggregation of all shots falling within individual cells according to their ground location and calculating the mean and standard deviation of values.
Foliage height diversity (FHD) is a canopy structural index that describes the vertical heterogeneity of foliage profile (MacArthur and Horn, 1969). It is unitless.
Aboveground Biomass Density
Aboveground biomass density (AGBD) and uncertainty were modeled for the Lope, Mondah/Akanda, and Mabounie sites using field inventory data and waveform height and cover metrics, combined in a non-linear Bayesian modelling framework to predict aboveground biomass density and uncertainty at 0.25 ha and 1 ha spatial resolution. A model that follows the functional form of the scaling equations used to derive mass from individual tree structure was used in this study to model AGBD at the plot level:
AGBD (Mg ha-1) = Ha x SBAb x WSGc (1)
Where AGBD is Aboveground Biomass Density, H is the canopy top height and WSG is the wood specific gravity. RH98 was used for the canopy top height (H) since this is less sensitive to noise (Hancock et al., 2019). However, this model is also parameterized in terms of stand basal area (SBA) and wood specific gravity (WSG), neither of which are directly measured by the lidar waveforms. Therefore, to model SBA in this study, a linear model was developed parameterized by cover and height for prediction from lidar measurements:
SBA (m2 ha-1) = RH90 x CCz = Hmax (2)
Where SBA is the Stand Basal Area Density, and CCz = Hmax is canopy cover at the top of the canopy (i.e., total cover). Since spatially explicit estimates of WSG are not available at 1 ha spatial resolution, regional WSG values defined by Chave et al. (2009) were used and model performance was tested with and without its inclusion. Models were independently developed at spatial resolutions of 0.25 ha and 1 ha, for which we had in situ AGBD data that could be co-located with waveform footprints with relative geolocation errors of <5%. Specification of these models required explicit treatment of heteroscedasticity and the non-normal error distribution of the response (AGBD). This was achieved through the use of a Generalized Linear Model (GLM), selecting a Gamma distribution for modelling the continuous, non-negative, and positive-skewed AGBD data, where the variance is proportional to the mean squared. Estimation of model parameters was undertaken in a generalized non-linear Bayesian framework using R software. Posterior predictive distributions provided realistic per-pixel estimates of uncertainty in the form of 1 sigma credible intervals. Model performance was assessed by leave-one-out (LOO) cross-validation.
Data Sources
Gridded canopy cover metrics were generated from the footprint-level metrics (Tang et al., 2018). Details on field data used for the calibration of the biomass models are available in Fatoyinbo et al. (2018). Other field data used for the calibration of the models are provided by N. Labrière et al. (2018).
Data Access
These data are available through the Oak Ridge National Laboratory (ORNL) Distributed Active Archive Center (DAAC).
AfriSAR: Gridded Forest Biomass and Canopy Metrics Derived from LVIS, Gabon, 2016
Contact for Data Center Access Information:
- E-mail: uso@daac.ornl.gov
- Telephone: +1 (865) 241-3952
References
Chave, J., D. Coomes, S. Jansen, S.L. Lewis, N.G. Swenson, and A.E. Zanne. 2009. Towards a worldwide wood economics spectrum. Ecology Letters, 12:351–366. https://doi.org/10.1111/j.1461-0248.2009.01285.x
Fatoyinbo, T., et al. 2020. The 2016 NASA AfriSAR Campaign: Airborne SAR and Lidar Measurements of Tropical Forest Structure and Biomass in Support of Future Space Missions. In progress
Fatoyinbo, T., S.S. Saatchi, J. Armston, J. Poulsen, S. Marselis, N. Pinto, L. Duncanson, L.J.T. White, and K. Jeffery. 2018. AfriSAR: Mondah Forest Tree Species, Biophysical, and Biomass Data, Gabon, 2016. ORNL DAAC, Oak Ridge, Tennessee, USA. https://doi.org/10.3334/ORNLDAAC/1580
Hancock, S., J. Armston, M. Hofton, X. Sun, H. Tang, L.I. Duncanson, J.R. Kellner, and R. Dubayah. 2019. The GEDI Simulator: A Large-Footprint Waveform Lidar Simulator for Calibration and Validation of Spaceborne Missions. Earth and Space Science, 6(2):294–310. https://doi.org/10.1029/2018EA000506
Labrière, N., S. Tao, J. Chave, K. Scipal, T.L. Toan, K. Abernethy, et al. 2018. In Situ Reference Datasets From the TropiSAR and AfriSAR Campaigns in Support of Upcoming Spaceborne Biomass Missions. IEEE Journal of Selected Topics in Applied Earth Observations and Remote Sensing, 11(10):3617–3627. https://doi.org/10.1109/JSTARS.2018.2851606
MacArthur, R.H., and H.S. Horn. 1969. Foliage profile by vertical measurements. Ecology, 50:802–804. https://www.jstor.org/stable/i306277
Sibson, R. 1981. A Brief Description of Natural Neighbor Interpolation. In V. Barnett (Eds.) Interpreting Multivariate Data (pp. 21–36). John Wiley and Sons, New York.
Tang, H., J. Armston, S. Hancock, M. Hofton, J.B. Blair, T. Fatoyinbo, and R.O. Dubayah. 2018. AfriSAR: Canopy Cover and Vertical Profile Metrics Derived from LVIS, Gabon, 2016. ORNL DAAC, Oak Ridge, Tennessee, USA. https://doi.org/10.3334/ORNLDAAC/1591